Waste Recycling Services Market Analysis APAC, North America, Europe, Middle East and Africa, South America - US, China, Germany, UK, Japan - Size and Forecast 2024-2028

Waste Recycling Services Market Analysis APAC, North America, Europe, Middle East and Africa, South America - US, China, Germany, UK, Japan - Size and Forecast 2024-2028

Published: Jul 2024 164 Pages SKU: IRTNTR76418

Market Overview at a Glance

$21.1 B
Market Opportunity
5.95%
CAGR
5.24
YoY growth 2023-2024(%)

Waste Recycling Services Market Size 2024-2028 

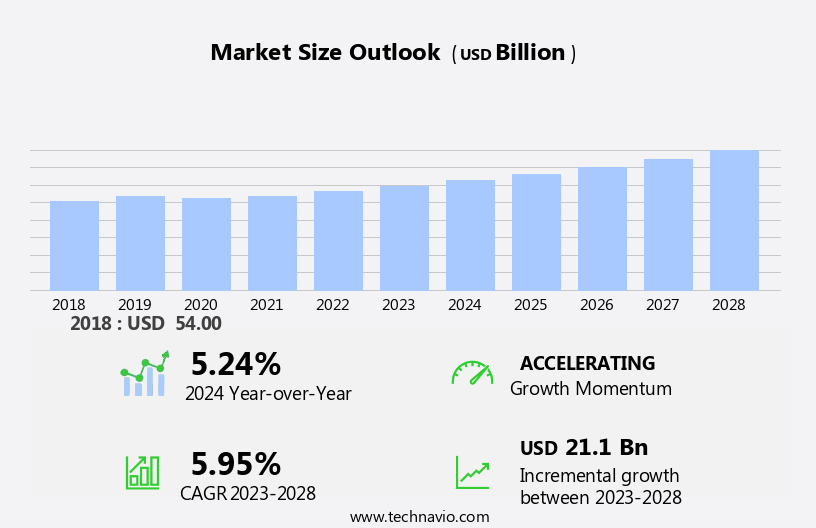
The waste recycling services market size is forecast to increase by USD 21.1 billion at a CAGR of 5.95% between 2023 and 2028.

  • The market is experiencing significant growth, driven by key factors such as the increasing number of partnerships and collaborations among industry players. This trend is expected to continue as waste recycling becomes an increasingly important aspect of sustainability efforts. Another significant growth area is the demand for electric waste recycling, as the world becomes increasingly reliant on technology. However, the market also faces challenges, particularly In the realm of plastic recycling. The complexities and costs associated with effectively and sustainably recycling plastic continue to pose significant hurdles. Despite these challenges, the market is poised for continued expansion, driven by growing consumer awareness and regulatory support for sustainable waste management practices.

What will be the Size of the Waste Recycling Services Market During the Forecast Period?

Waste Recycling Services Market Size

 Request Free Sample

  • The market is experiencing significant growth due to increasing global awareness towards reducing the environmental impact of tech product disposal. Planned obsolescence of tech products, such as mobile devices, contributes to a vast amount of electronic waste (e-waste). Informal processors In the informal sector, who often handle e-waste through haphazard dumping, pose risks to nature and human health due to the presence of harmful toxins like mercury and lead. Consumers are becoming more conscious of the need for e-waste disposal through authorized channels to ensure proper treatment and recovery of valuable materials like plastic, metal, and insulators. Companies like SAHAAS Zero Waste are leading the charge in providing waste management recycling services, ensuring the safe dismantling and processing of e-waste.
  • Additionally, the recycling process involves the separation and treatment of various components, such as trays, fencing posts, and circuit boards, to recover valuable materials. However, the presence of harmful toxins in e-waste can pose risks to workers involved In the recycling process, leading to diseases like lead poisoning. Therefore, stringent safety measures and regulations are essential to ensure the safety of workers and the environment. The recycling of plastic and metal from e-waste not only reduces the amount of waste going to landfills but also helps In the production of new tech products, creating a circular economy. The market for waste recycling services is expected to continue growing as consumers become more environmentally conscious and governments implement stricter regulations on e-waste disposal.

How is this Waste Recycling Services Industry segmented and which is the largest segment?

The waste recycling services industry research report provides comprehensive data (region-wise segment analysis), with forecasts and estimates in "USD billion" for the period 2024-2028, as well as historical data from 2018-2022 for the following segments.

  • Application
    • Municipal
    • Industrial
    • Others
  • Product
    • Paper and paperboard
    • Metals
    • Plastics
    • Glass
    • Others
  • Geography
    • APAC
      • China
      • Japan
    • North America
      • US
    • Europe
      • Germany
      • UK
    • Middle East and Africa
    • South America

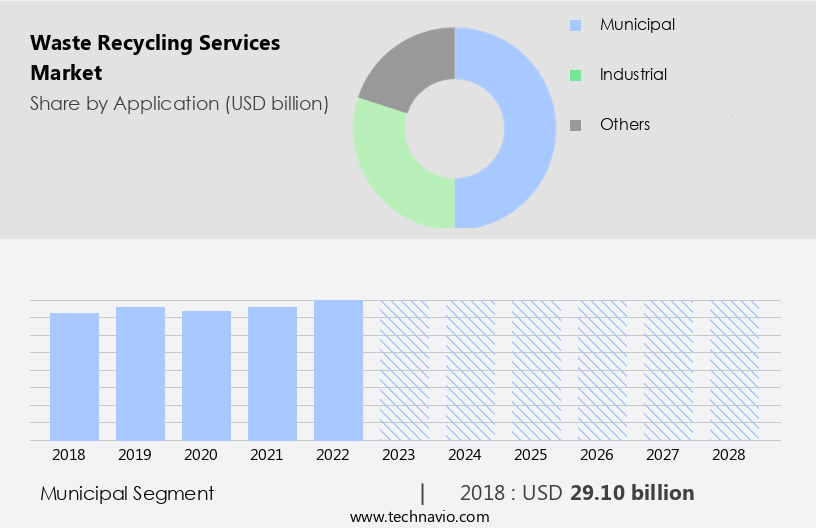
By Application Insights

  • The municipal segment is estimated to witness significant growth during the forecast period.

Waste recycling services have gained significant importance due to the environmental, economic, and social implications of waste disposal. Municipalities are increasingly recognizing the environmental consequences of waste disposal in landfills and incinerators. Recycling offers several benefits, including the reduction of waste materials, conservation of natural resources such as timber, metals, and minerals, and energy savings. By recycling, municipalities can decrease their reliance on raw materials, preserve ecosystems, and minimize pollution. Moreover, recycling typically consumes less energy than producing goods from raw materials, leading to potential cost savings and contributing to energy efficiency goals. The recycling process involves various stages, including pickup requests, collection centers, and treatment facilities for IT e-waste, consumer e-waste, mobile devices, plastic, metal, mercury, insulators, trays, fencing posts, and recovery of various waste materials.

However, it is essential to ensure proper handling and disposal of harmful toxins present In these waste materials to protect nature and human health. The informal sector, which includes informal processors and workers, poses health risks due to exposure to diseases and hazardous substances. Therefore, it is crucial to promote authorized channels for e-waste disposal and adhere to Extended Producer Responsibility (EPR) and Producer Responsibility Organization (PRO) regulations. The reverse logistics chain plays a vital role In the efficient and effective recycling process.

Waste Recycling Services Market Size

Get a glance at the  Waste Recycling Services Industry report of share of various segments Request Free Sample

The municipal segment was valued at USD 29.10 billion in 2018 and showed a gradual increase during the forecast period.
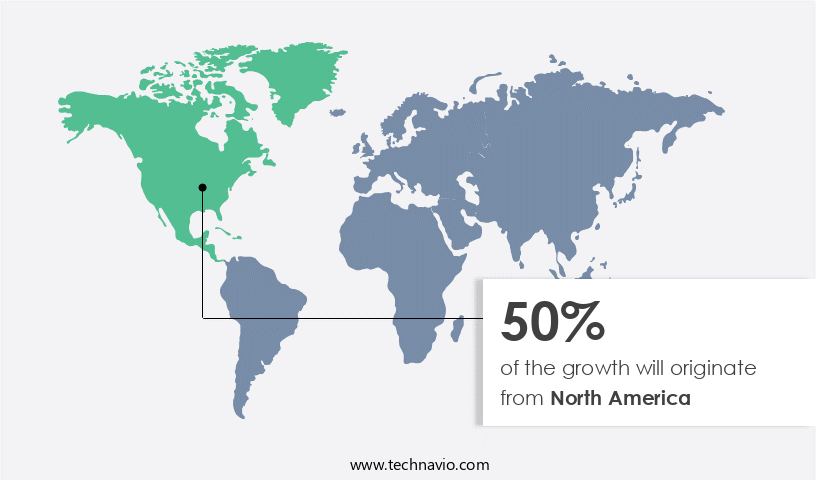
Regional Analysis

  • North America is estimated to contribute 50% to the growth of the global market during the forecast period.

Technavio's analysts have elaborately explained the regional trends and drivers that shape the market during the forecast period.

Waste Recycling Services Market Share by Geography

For more insights on the market share of various regions, Request Free Sample

In APAC, there is a growing emphasis on circular economy principles, leading to an increased focus on waste reduction, reuse, and recycling. This shift is driven by heightened environmental awareness and the recognition of the detrimental effects of waste on ecosystems. Governments In the region are implementing regulations to support sustainable waste management practices, such as the Extended Producer Responsibility (EPR) for plastic packaging in India. EPR initiatives require producers to take back and manage the disposal of their products at the end of their life cycle, encouraging the development of waste recycling services.

Additionally, the recycling market in APAC is expanding as a result, with a focus on the recycling of materials like plastic, metal, mercury, insulators, trays, fencing posts, paper & paperboard, plastics, metals, food, glass, yard trimmings, bulbs, batteries & electronics, and more. The recycling process includes collection, treatment, recovery, and disposal through authorized channels to minimize harm to nature and human health. It is essential to ensure proper disposal of electronic waste (e-waste) through authorized channels to prevent haphazard dumping, contamination, and potential health risks to workers In the informal sector. The recycling industry plays a crucial role in reducing pollution, conserving natural resources, and minimizing greenhouse gas emissions.

Market Dynamics

Our waste recycling services market researchers analyzed the data with 2023 as the base year, along with the key drivers, trends, and challenges. A holistic analysis of drivers will help companies refine their marketing strategies to gain a competitive advantage.

What are the key market drivers leading to the rise In the adoption of Waste Recycling Services Industry?

Increasing number of partnerships and collaborations is the key driver of the market.

  • The market is driven by strategic partnerships and collaborations that facilitate the effective management and recycling of various waste materials. In 2023, DS Smith sold four of its UK recycling depots to Veolia ES (UK) Ltd, enhancing Veolia's capabilities In the region. Similarly, in 2020, Lyondell Basell and SUEZ joined forces to acquire TIVACO, a Belgian plastic recycling company, expanding QCP's production capacity for recycled materials to 55,000 tons per year. In 2021, Biffa plc, a leading sustainable waste management company In the UK, acquired Green Circle Polymers Ltd (GCP) for £10 million, bolstering its recycling capabilities. These collaborations are crucial in addressing the intricacies of waste management and recycling, particularly in dealing with tech products, such as e-waste, which may contain harmful toxins.
  • Additionally, the informal sector, often involved in haphazard dumping and contamination, poses significant challenges. Dismantling and treating waste materials, including plastics, metals, and mercury, requires specialized expertise and resources. The recovery of valuable materials like insulators, trays, fencing posts, and recovery of energy from waste materials is essential for both the environment and economic security. The recycling of paper & paperboard, plastics, metals, food, glass, yard trimmings, bulbs, batteries & electronics, and municipal waste is crucial in reducing pollution, energy consumption, and greenhouse gas emissions. The market for waste recycling services is dynamic, with various stakeholders, including consumers, producers, and governments, playing vital roles In the extended producer responsibility and reverse logistics chain.
  • Consequently, consumers are increasingly aware of the importance of e-waste disposal through authorized channels, such as Saahas Zero Waste, a Producer Responsibility Organization. Proper waste management recycling is essential to protect human health and the environment from diseases and contamination. The recycling of waste materials into new products, such as timber, water, minerals, and energy, is a vital component of the circular economy.

What are the market trends shaping the Waste Recycling Services Industry?

Growing electric waste recycling demand is the upcoming market trend.

  • The e-the market In the US has witnessed significant growth due to the increasing volume of discarded electronic devices and equipment. Electronic waste, comprised of items such as computers, smartphones, televisions, and appliances, contains harmful toxins like lead, mercury, cadmium, and brominated flame retardants. These substances can cause environmental contamination and long-term ecological damage when disposed of improperly in landfills or incinerated. The rapid pace of technological innovation and planned obsolescence result in a high volume of outdated or obsolete electronics, leading to a growing need for e-waste recycling. Informal processors In the informal sector often handle a significant portion of e-waste disposal, but their methods can pose health risks to workers and diseases like lead poisoning.
  • Additionally, authorized channels, such as Producer Responsibility Organizations (PROs) and Extended Producer Responsibility (EPR) programs, promote e-waste recycling through reverse logistics chains. Consumers can request pickup or drop off their e-waste at collection centers, ensuring proper disposal and recovery of valuable materials like plastics, metals, and minerals. Recycling e-waste not only protects the environment but also reduces energy consumption, greenhouse gas emissions, and the need for extracting raw materials from nature. It contributes to economic security by providing jobs and revenue opportunities. However, challenges such as high costs, poor quality of recycled goods, and contamination from haphazard dumping remain.
  • Thus, e-waste recycling involves dismantling and treating components like IT e-waste, consumer e-waste (mobile devices), and other items like bulbs, batteries, and electronics. The recycling process includes recovery of materials like plastic, metal, mercury, insulators, trays, and fencing posts. The recovered materials can be used to manufacture new products, reducing the need for extracting raw materials from natural resources and minimizing pollution from energy consumption and air and water pollution.

What challenges does the Waste Recycling Services Industry face during its growth?

Several threats associated with plastic recycling are key challenges affecting the industry's growth.

  • Waste recycling services play a crucial role in mitigating the environmental and health risks associated with the disposal of tech products, particularly those subjected to planned obsolescence. However, the informal processing sector, which often handles a significant portion of e-waste, poses challenges due to the presence of harmful toxins. These workers are at risk of contracting diseases from exposure to these toxins. The recycling process involves several stages, including collection, transportation, sorting, treatment, and recovery. Collection centers and pickup requests are essential for efficient waste management recycling. Consumers play a vital role in reducing waste through proper disposal of their e-waste via authorized channels.
  • Additionally, e-waste contains various materials like plastics, metals, mercury, insulators, trays, fencing posts, and recovery resources like timber, water, minerals, and energy. Recycling these materials helps preserve natural resources, reduce greenhouse gas emissions, and minimize pollution from landfills and incinerators. Despite the benefits, challenges persist. Contamination from non-recyclable items and haphazard dumping can lead to lower-quality recyclables and increased costs. Advanced sorting and processing equipment are necessary to maintain efficiency and quality standards, but they come with high costs. In summary, the market faces significant challenges and opportunities. By investing in advanced technology and encouraging consumers to use authorized channels for e-waste disposal, we can mitigate risks to human health and the environment while maximizing resource recovery.

Exclusive Customer Landscape

The waste recycling services market forecasting report includes the adoption lifecycle of the market, covering from the innovator's stage to the laggard's stage. It focuses on adoption rates in different regions based on penetration. Furthermore, the waste recycling services market report also includes key purchase criteria and drivers of price sensitivity to help companies evaluate and develop their market growth analysis strategies.

Waste Recycling Services Market Share by Geography

 Customer Landscape

Key Companies & Market Insights

Companies are implementing various strategies, such as strategic alliances, waste recycling services market forecast, partnerships, mergers and acquisitions, geographical expansion, and product/service launches, to enhance their presence In the industry. The industry research and growth report includes detailed analyses of the competitive landscape of the market and information about key companies, including:

  • Biffa Plc
  • Casella Waste Systems Inc.
  • Clean Harbors Inc.
  • Covanta Holding Corp.
  • Environ India
  • FCC SA
  • GFL Environmental Inc.
  • Interface Inc.
  • Northstar Recycling Co. Inc.
  • Recology Inc.
  • Reconomy UK Ltd.
  • Remondis SE and Co. KG
  • Rumpke Consolidated Co. Inc.
  • SMS Envocare Ltd.
  • SUEZ SA
  • URBASER SA
  • Veolia Environnement SA
  • Waste Connections Inc.
  • Waste Management Inc.
  • Waste Pro USA Inc.

Qualitative and quantitative analysis of companies has been conducted to help clients understand the wider business environment as well as the strengths and weaknesses of key industry players. Data is qualitatively analyzed to categorize companies as pure play, category-focused, industry-focused, and diversified; it is quantitatively analyzed to categorize companies as dominant, leading, strong, tentative, and weak.

Research Analyst Overview

The market encompasses the collection, treatment, and processing of various waste materials to extract valuable resources and reduce the environmental impact of disposal. This market is driven by several factors, including the increasing awareness of the negative effects of haphazard dumping on nature and human health. One significant contributor to the waste stream is electronic waste (e-waste), which poses unique challenges due to the presence of harmful toxins and the informal processing methods often employed In the informal sector. These challenges have led to the emergence of authorized channels and producer responsibility organizations, promoting Extended Producer Responsibility (EPR) and reverse logistics chains. EPR is a policy approach where manufacturers take back their products at the end of their life cycle to ensure proper disposal and recycling. Reverse logistics chains facilitate the collection, transportation, and processing of waste materials, often involving pickup requests and the establishment of collection centers. In the context of e-waste, IT and consumer electronics, such as mobile devices, are major contributors. The informal sector, which may employ workers in hazardous conditions, often handles a significant portion of e-waste due to the high costs of authorized channels.

However, these informal processors may not employ proper safety measures, leading to potential health risks for workers and the release of harmful toxins into the environment. The recycling process for e-waste involves dismantling the devices to recover valuable materials like metals, plastics, insulators, trays, and fencing posts. These materials can be further processed and used to produce new products, reducing the need for raw materials and the associated energy consumption, greenhouse gas emissions, and pollution. The market also covers other waste materials, such as paper and paperboard, plastics, metals, food, glass, yard trimmings, bulbs, batteries, and electronics. The recycling of these materials not only helps conserve natural resources but also contributes to economic security by reducing the need for importing raw materials and creating jobs In the recycling industry. Despite the benefits, challenges remain, including the high costs of recycled goods, poor quality, and the need for continuous innovation to keep up with evolving waste streams and technologies.

Additionally, the recycling process itself can contribute to pollution, particularly In the form of air, water, and land pollution from incinerators and landfills. To address these challenges, waste reduction efforts are crucial, as is the development of more efficient and sustainable recycling technologies. The recycling industry must continue to adapt and innovate to meet the evolving needs of the market and ensure a circular economy that minimizes waste and maximizes resource recovery.

Waste Recycling Services Market Scope

Report Coverage

Details

Page number

164

Base year

2023

Historic period

2018-2022

Forecast period

2024-2028

Growth momentum & CAGR

Accelerate at a CAGR of 5.95%

Market growth 2024-2028

USD 21.1 billion

Market structure

Fragmented

YoY growth 2023-2024(%)

5.24

Key countries

US, China, Germany, UK, and Japan

Competitive landscape

Leading Companies, Market Positioning of Companies, Competitive Strategies, and Industry Risks

Request Free Sample

What are the Key Data Covered in this Waste Recycling Services Market Research and Growth Report?

  • CAGR of the Waste Recycling Services industry during the forecast period
  • Detailed information on factors that will drive the Waste Recycling Services growth and forecasting between 2024 and 2028
  • Precise estimation of the size of the market and its contribution of the industry in focus to the parent market
  • Accurate predictions about upcoming growth and trends and changes in consumer behaviour
  • Growth of the market across APAC, North America, Europe, Middle East and Africa, and South America
  • Thorough analysis of the market's competitive landscape and detailed information about companies
  • Comprehensive analysis of factors that will challenge the waste recycling services market growth of industry companies

We can help! Our analysts can customize this waste recycling services market research report to meet your requirements.

Get in touch

1 Executive Summary

  • 1.1 Market overview
    • Executive Summary - Chart on Market Overview
    • Executive Summary - Data Table on Market Overview
    • Executive Summary - Chart on Global Market Characteristics
    • Executive Summary - Chart on Market by Geography
    • Executive Summary - Chart on Market Segmentation by Application
    • Executive Summary - Chart on Market Segmentation by Product
    • Executive Summary - Chart on Incremental Growth
    • Executive Summary - Data Table on Incremental Growth
    • Executive Summary - Chart on Company Market Positioning

2 Market Landscape

  • 2.1 Market ecosystem
    • Parent Market
    • Data Table on - Parent Market
  • 2.2 Market characteristics
    • Market characteristics analysis
  • 2.3 Value chain analysis
    • Value Chain Analysis

3 Market Sizing

  • 3.1 Market definition
    • Offerings of companies included in the market definition
  • 3.2 Market segment analysis
    • Market segments
  • 3.3 Market size 2023
    • 3.4 Market outlook: Forecast for 2023-2028
      • Chart on Global - Market size and forecast 2023-2028 ($ billion)
      • Data Table on Global - Market size and forecast 2023-2028 ($ billion)
      • Chart on Global Market: Year-over-year growth 2023-2028 (%)
      • Data Table on Global Market: Year-over-year growth 2023-2028 (%)

    4 Historic Market Size

    • 4.1 Global Waste Recycling Services Market 2018 - 2022
      • Historic Market Size - Data Table on Global Waste Recycling Services Market 2018 - 2022 ($ billion)
    • 4.2 Application segment analysis 2018 - 2022
      • Historic Market Size - Application Segment 2018 - 2022 ($ billion)
    • 4.3 Product segment analysis 2018 - 2022
      • Historic Market Size - Product Segment 2018 - 2022 ($ billion)
    • 4.4 Geography segment analysis 2018 - 2022
      • Historic Market Size - Geography Segment 2018 - 2022 ($ billion)
    • 4.5 Country segment analysis 2018 - 2022
      • Historic Market Size - Country Segment 2018 - 2022 ($ billion)

    5 Five Forces Analysis

    • 5.1 Five forces summary
      • Five forces analysis - Comparison between 2023 and 2028
    • 5.2 Bargaining power of buyers
      • Bargaining power of buyers - Impact of key factors 2023 and 2028
    • 5.3 Bargaining power of suppliers
      • Bargaining power of suppliers - Impact of key factors in 2023 and 2028
    • 5.4 Threat of new entrants
      • Threat of new entrants - Impact of key factors in 2023 and 2028
    • 5.5 Threat of substitutes
      • Threat of substitutes - Impact of key factors in 2023 and 2028
    • 5.6 Threat of rivalry
      • Threat of rivalry - Impact of key factors in 2023 and 2028
    • 5.7 Market condition
      • Chart on Market condition - Five forces 2023 and 2028

    6 Market Segmentation by Application

    • 6.1 Market segments
      • Chart on Application - Market share 2023-2028 (%)
      • Data Table on Application - Market share 2023-2028 (%)
    • 6.2 Comparison by Application
      • Chart on Comparison by Application
      • Data Table on Comparison by Application
    • 6.3 Municipal - Market size and forecast 2023-2028
      • Chart on Municipal - Market size and forecast 2023-2028 ($ billion)
      • Data Table on Municipal - Market size and forecast 2023-2028 ($ billion)
      • Chart on Municipal - Year-over-year growth 2023-2028 (%)
      • Data Table on Municipal - Year-over-year growth 2023-2028 (%)
    • 6.4 Industrial - Market size and forecast 2023-2028
      • Chart on Industrial - Market size and forecast 2023-2028 ($ billion)
      • Data Table on Industrial - Market size and forecast 2023-2028 ($ billion)
      • Chart on Industrial - Year-over-year growth 2023-2028 (%)
      • Data Table on Industrial - Year-over-year growth 2023-2028 (%)
    • 6.5 Others - Market size and forecast 2023-2028
      • Chart on Others - Market size and forecast 2023-2028 ($ billion)
      • Data Table on Others - Market size and forecast 2023-2028 ($ billion)
      • Chart on Others - Year-over-year growth 2023-2028 (%)
      • Data Table on Others - Year-over-year growth 2023-2028 (%)
    • 6.6 Market opportunity by Application
      • Market opportunity by Application ($ billion)
      • Data Table on Market opportunity by Application ($ billion)

    7 Market Segmentation by Product

    • 7.1 Market segments
      • Chart on Product - Market share 2023-2028 (%)
      • Data Table on Product - Market share 2023-2028 (%)
    • 7.2 Comparison by Product
      • Chart on Comparison by Product
      • Data Table on Comparison by Product
    • 7.3 Paper and paperboard - Market size and forecast 2023-2028
      • Chart on Paper and paperboard - Market size and forecast 2023-2028 ($ billion)
      • Data Table on Paper and paperboard - Market size and forecast 2023-2028 ($ billion)
      • Chart on Paper and paperboard - Year-over-year growth 2023-2028 (%)
      • Data Table on Paper and paperboard - Year-over-year growth 2023-2028 (%)
    • 7.4 Metals - Market size and forecast 2023-2028
      • Chart on Metals - Market size and forecast 2023-2028 ($ billion)
      • Data Table on Metals - Market size and forecast 2023-2028 ($ billion)
      • Chart on Metals - Year-over-year growth 2023-2028 (%)
      • Data Table on Metals - Year-over-year growth 2023-2028 (%)
    • 7.5 Plastics - Market size and forecast 2023-2028
      • Chart on Plastics - Market size and forecast 2023-2028 ($ billion)
      • Data Table on Plastics - Market size and forecast 2023-2028 ($ billion)
      • Chart on Plastics - Year-over-year growth 2023-2028 (%)
      • Data Table on Plastics - Year-over-year growth 2023-2028 (%)
    • 7.6 Glass - Market size and forecast 2023-2028
      • Chart on Glass - Market size and forecast 2023-2028 ($ billion)
      • Data Table on Glass - Market size and forecast 2023-2028 ($ billion)
      • Chart on Glass - Year-over-year growth 2023-2028 (%)
      • Data Table on Glass - Year-over-year growth 2023-2028 (%)
    • 7.7 Others - Market size and forecast 2023-2028
      • Chart on Others - Market size and forecast 2023-2028 ($ billion)
      • Data Table on Others - Market size and forecast 2023-2028 ($ billion)
      • Chart on Others - Year-over-year growth 2023-2028 (%)
      • Data Table on Others - Year-over-year growth 2023-2028 (%)
    • 7.8 Market opportunity by Product
      • Market opportunity by Product ($ billion)
      • Data Table on Market opportunity by Product ($ billion)

    8 Customer Landscape

    • 8.1 Customer landscape overview
      • Analysis of price sensitivity, lifecycle, customer purchase basket, adoption rates, and purchase criteria

    9 Geographic Landscape

    • 9.1 Geographic segmentation
      • Chart on Market share by geography 2023-2028 (%)
      • Data Table on Market share by geography 2023-2028 (%)
    • 9.2 Geographic comparison
      • Chart on Geographic comparison
      • Data Table on Geographic comparison
    • 9.3 APAC - Market size and forecast 2023-2028
      • Chart on APAC - Market size and forecast 2023-2028 ($ billion)
      • Data Table on APAC - Market size and forecast 2023-2028 ($ billion)
      • Chart on APAC - Year-over-year growth 2023-2028 (%)
      • Data Table on APAC - Year-over-year growth 2023-2028 (%)
    • 9.4 North America - Market size and forecast 2023-2028
      • Chart on North America - Market size and forecast 2023-2028 ($ billion)
      • Data Table on North America - Market size and forecast 2023-2028 ($ billion)
      • Chart on North America - Year-over-year growth 2023-2028 (%)
      • Data Table on North America - Year-over-year growth 2023-2028 (%)
    • 9.5 Europe - Market size and forecast 2023-2028
      • Chart on Europe - Market size and forecast 2023-2028 ($ billion)
      • Data Table on Europe - Market size and forecast 2023-2028 ($ billion)
      • Chart on Europe - Year-over-year growth 2023-2028 (%)
      • Data Table on Europe - Year-over-year growth 2023-2028 (%)
    • 9.6 Middle East and Africa - Market size and forecast 2023-2028
      • Chart on Middle East and Africa - Market size and forecast 2023-2028 ($ billion)
      • Data Table on Middle East and Africa - Market size and forecast 2023-2028 ($ billion)
      • Chart on Middle East and Africa - Year-over-year growth 2023-2028 (%)
      • Data Table on Middle East and Africa - Year-over-year growth 2023-2028 (%)
    • 9.7 South America - Market size and forecast 2023-2028
      • Chart on South America - Market size and forecast 2023-2028 ($ billion)
      • Data Table on South America - Market size and forecast 2023-2028 ($ billion)
      • Chart on South America - Year-over-year growth 2023-2028 (%)
      • Data Table on South America - Year-over-year growth 2023-2028 (%)
    • 9.8 US - Market size and forecast 2023-2028
      • Chart on US - Market size and forecast 2023-2028 ($ billion)
      • Data Table on US - Market size and forecast 2023-2028 ($ billion)
      • Chart on US - Year-over-year growth 2023-2028 (%)
      • Data Table on US - Year-over-year growth 2023-2028 (%)
    • 9.9 China - Market size and forecast 2023-2028
      • Chart on China - Market size and forecast 2023-2028 ($ billion)
      • Data Table on China - Market size and forecast 2023-2028 ($ billion)
      • Chart on China - Year-over-year growth 2023-2028 (%)
      • Data Table on China - Year-over-year growth 2023-2028 (%)
    • 9.10 Germany - Market size and forecast 2023-2028
      • Chart on Germany - Market size and forecast 2023-2028 ($ billion)
      • Data Table on Germany - Market size and forecast 2023-2028 ($ billion)
      • Chart on Germany - Year-over-year growth 2023-2028 (%)
      • Data Table on Germany - Year-over-year growth 2023-2028 (%)
    • 9.11 UK - Market size and forecast 2023-2028
      • Chart on UK - Market size and forecast 2023-2028 ($ billion)
      • Data Table on UK - Market size and forecast 2023-2028 ($ billion)
      • Chart on UK - Year-over-year growth 2023-2028 (%)
      • Data Table on UK - Year-over-year growth 2023-2028 (%)
    • 9.12 Japan - Market size and forecast 2023-2028
      • Chart on Japan - Market size and forecast 2023-2028 ($ billion)
      • Data Table on Japan - Market size and forecast 2023-2028 ($ billion)
      • Chart on Japan - Year-over-year growth 2023-2028 (%)
      • Data Table on Japan - Year-over-year growth 2023-2028 (%)
    • 9.13 Market opportunity by geography
      • Market opportunity by geography ($ billion)
      • Data Tables on Market opportunity by geography ($ billion)

    10 Drivers, Challenges, and Opportunity/Restraints

    • 10.1 Market drivers
      • 10.2 Market challenges
        • 10.3 Impact of drivers and challenges
          • Impact of drivers and challenges in 2023 and 2028
        • 10.4 Market opportunities/restraints

          11 Competitive Landscape

          • 11.1 Overview
            • 11.2 Competitive Landscape
              • Overview on criticality of inputs and factors of differentiation
            • 11.3 Landscape disruption
              • Overview on factors of disruption
            • 11.4 Industry risks
              • Impact of key risks on business

            12 Competitive Analysis

            • 12.1 Companies profiled
              • Companies covered
            • 12.2 Market positioning of companies
              • Matrix on companies position and classification
            • 12.3 Biffa Plc
              • Biffa Plc - Overview
              • Biffa Plc - Product / Service
              • Biffa Plc - Key news
              • Biffa Plc - Key offerings
            • 12.4 Casella Waste Systems Inc.
              • Casella Waste Systems Inc. - Overview
              • Casella Waste Systems Inc. - Business segments
              • Casella Waste Systems Inc. - Key offerings
              • Casella Waste Systems Inc. - Segment focus
            • 12.5 Clean Harbors Inc.
              • Clean Harbors Inc. - Overview
              • Clean Harbors Inc. - Business segments
              • Clean Harbors Inc. - Key news
              • Clean Harbors Inc. - Key offerings
              • Clean Harbors Inc. - Segment focus
            • 12.6 Covanta Holding Corp.
              • Covanta Holding Corp. - Overview
              • Covanta Holding Corp. - Product / Service
              • Covanta Holding Corp. - Key offerings
            • 12.7 Environ India
              • Environ India - Overview
              • Environ India - Product / Service
              • Environ India - Key offerings
            • 12.8 FCC SA
              • FCC SA - Overview
              • FCC SA - Business segments
              • FCC SA - Key news
              • FCC SA - Key offerings
              • FCC SA - Segment focus
            • 12.9 Interface Inc.
              • Interface Inc. - Overview
              • Interface Inc. - Product / Service
              • Interface Inc. - Key news
              • Interface Inc. - Key offerings
            • 12.10 Northstar Recycling Co. Inc.
              • Northstar Recycling Co. Inc. - Overview
              • Northstar Recycling Co. Inc. - Product / Service
              • Northstar Recycling Co. Inc. - Key offerings
            • 12.11 Reconomy UK Ltd.
              • Reconomy UK Ltd. - Overview
              • Reconomy UK Ltd. - Product / Service
              • Reconomy UK Ltd. - Key offerings
            • 12.12 Remondis SE and Co. KG
              • Remondis SE and Co. KG - Overview
              • Remondis SE and Co. KG - Product / Service
              • Remondis SE and Co. KG - Key offerings
            • 12.13 SUEZ SA
              • SUEZ SA - Overview
              • SUEZ SA - Product / Service
              • SUEZ SA - Key news
              • SUEZ SA - Key offerings
            • 12.14 URBASER SA
              • URBASER SA - Overview
              • URBASER SA - Product / Service
              • URBASER SA - Key offerings
            • 12.15 Veolia Environnement SA
              • Veolia Environnement SA - Overview
              • Veolia Environnement SA - Business segments
              • Veolia Environnement SA - Key news
              • Veolia Environnement SA - Key offerings
              • Veolia Environnement SA - Segment focus
            • 12.16 Waste Management Inc.
              • Waste Management Inc. - Overview
              • Waste Management Inc. - Business segments
              • Waste Management Inc. - Key news
              • Waste Management Inc. - Key offerings
              • Waste Management Inc. - Segment focus
            • 12.17 Waste Pro USA Inc.
              • Waste Pro USA Inc. - Overview
              • Waste Pro USA Inc. - Product / Service
              • Waste Pro USA Inc. - Key offerings

            13 Appendix

            • 13.1 Scope of the report
              • 13.2 Inclusions and exclusions checklist
                • Inclusions checklist
                • Exclusions checklist
              • 13.3 Currency conversion rates for US$
                • Currency conversion rates for US$
              • 13.4 Research methodology
                • Research methodology
              • 13.5 Data procurement
                • Information sources
              • 13.6 Data validation
                • Data validation
              • 13.7 Validation techniques employed for market sizing
                • Validation techniques employed for market sizing
              • 13.8 Data synthesis
                • Data synthesis
              • 13.9 360 degree market analysis
                • 360 degree market analysis
              • 13.10 List of abbreviations
                • List of abbreviations

              Research Methodology

              Technavio presents a detailed picture of the market by way of study, synthesis, and summation of data from multiple sources. The analysts have presented the various facets of the market with a particular focus on identifying the key industry influencers. The data thus presented is comprehensive, reliable, and the result of extensive research, both primary and secondary.

              INFORMATION SOURCES

              Primary sources

              • Manufacturers and suppliers
              • Channel partners
              • Industry experts
              • Strategic decision makers

              Secondary sources

              • Industry journals and periodicals
              • Government data
              • Financial reports of key industry players
              • Historical data
              • Press releases

              DATA ANALYSIS

              Data Synthesis

              • Collation of data
              • Estimation of key figures
              • Analysis of derived insights

              Data Validation

              • Triangulation with data models
              • Reference against proprietary databases
              • Corroboration with industry experts

              REPORT WRITING

              Qualitative

              • Market drivers
              • Market challenges
              • Market trends
              • Five forces analysis

              Quantitative

              • Market size and forecast
              • Market segmentation
              • Geographical insights
              • Competitive landscape

              Interested in this report?

              Get your sample now to see our research methodology and insights!

              Download Now

              Frequently Asked Questions

              Waste Recycling Services market growth will increase by $ 21.1 bn during 2024-2028.

              The Waste Recycling Services market is expected to grow at a CAGR of 5.95% during 2024-2028.

              Waste Recycling Services market is segmented by Application( Municipal, Industrial, Others) Product( Paper and paperboard, Metals, Plastics, Glass, Others)

              Biffa Plc, Casella Waste Systems Inc., Clean Harbors Inc., Covanta Holding Corp., Environ India, FCC SA, GFL Environmental Inc., Interface Inc., Northstar Recycling Co. Inc., Recology Inc., Reconomy UK Ltd., Remondis SE and Co. KG, Rumpke Consolidated Co. Inc., SMS Envocare Ltd., SUEZ SA, URBASER SA, Veolia Environnement SA, Waste Connections Inc., Waste Management Inc., Waste Pro USA Inc. are a few of the key vendors in the Waste Recycling Services market.

              North America will register the highest growth rate of 50% among the other regions. Therefore, the Waste Recycling Services market in North America is expected to garner significant business opportunities for the vendors during the forecast period.

              US, China, Germany, UK, Japan

              • Increasing number of partnerships and collaborationsPartnerships and collaborations are essential components of the global waste recycling services market is the driving factor this market.
              • as they enable organizations to pool resources is the driving factor this market.
              • expertise is the driving factor this market.
              • and capabilities to address the complex challenges of waste management and recycling. In August 2023 is the driving factor this market.
              • DS Smith sold four of its UK recycling depots to Veolia ES (UK) Ltd. On December 07 is the driving factor this market.
              • 2020 is the driving factor this market.
              • Lyondell Basell and SUEZ together acquired a Belgium-based plastic recycling company called TIVACO. With this transaction is the driving factor this market.
              • quality circular polymers (QCP) will increase their production capacity for recycled materials to approximately 55 is the driving factor this market.
              • 000 tons per year. On June 28 is the driving factor this market.
              • 2021 is the driving factor this market.
              • Biffa plc is the driving factor this market.
              • the UKs leading sustainable waste management company is the driving factor this market.
              • paid 10 million pound for Green Circle Polymers Ltd (GCP) in Grangemouth. Green Circle Polymers Ltd (GCP) in Grangemouth was acquired as Scotlands only post-consumer plastics recycling factory (PRF). This acquisition expands and increases Biffas capability in Scotland to process and recycle more plastic trash.  Such partnerships among players are expected to boost the growth of the global waste recycling services market during the forecast period. is the driving factor this market.

              The Waste Recycling Services market vendors should focus on grabbing business opportunities from the Municipal segment as it accounted for the largest market share in the base year.
              RIA - Research AI Assistant
              Ask RIA