Air Cleaner Filters Market Analysis APAC, Europe, North America, Middle East and Africa, South America - US, China, Japan, Germany, France - Size and Forecast 2024-2028
| Published: Oct 2023 | Pages: 180 | SKU: IRTNTR45775 |
Air Cleaner Filters Market 2024-2028
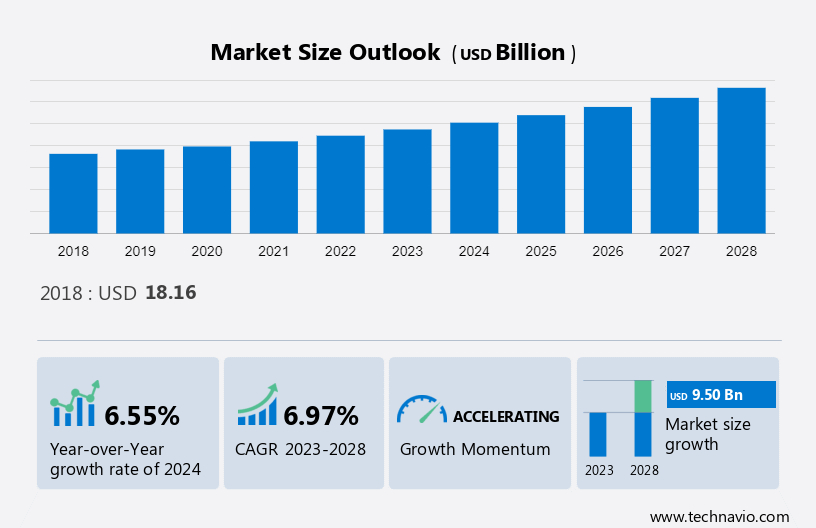
The air cleaner filters market size is estimated to grow at a CAGR of 6.97% between 2023 and 2028. The market size is forecast to increase by USD 9.50 billion. The growth of the market depends on several factors such as the recovery in the automotive industry and the development of next-generation engines, the growing emissions owing to increasing economic activities, and the stringent norms and regulations on emissions
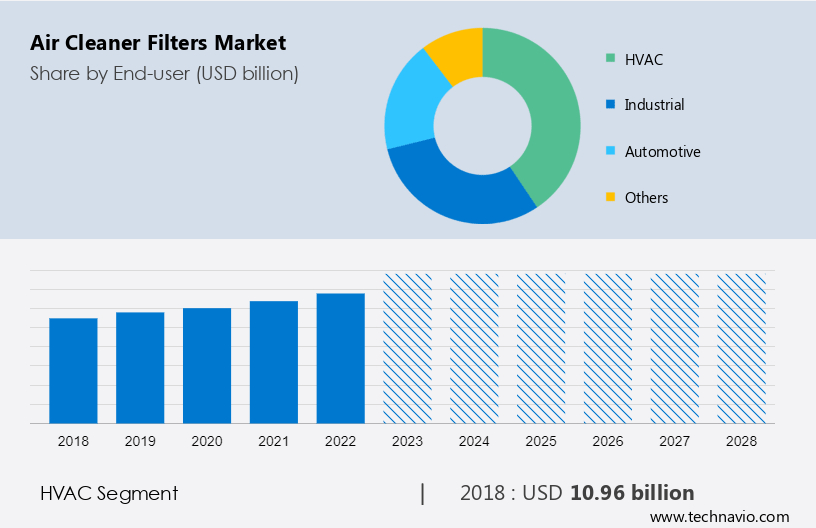
The report offers extensive research analysis on the Air Cleaner Filters Market Report, with a categorization based on End-User, including HVAC, industrial, automotive, and others. It further segments the market by Distribution Channel , encompassing Offline and Online . Additionally, the report provides Geographical segmentation, covering APAC, Europe, North America, Middle East and Africa, and South America. Market size, historical data (2017-2021), and future projections are presented in terms of value (in USD billion) for all the mentioned segments.
What will be the size of the Air Cleaner Filters Market During the Forecast Period?
For More Highlights About this Report, Download Free Sample in a Minute
Air Cleaner Filters Market: Key Drivers, Trends and Challenges
Our researchers analyzed the data with 2023 as the base year, along with the key drivers, trends, and challenges. A holistic analysis of drivers will help companies refine their marketing strategies to gain a competitive advantage.
Key Air Cleaner Filters Market Driver
Growing emissions owing to increasing economic activities is the key factor driving market growth. Economic growth plays an important role in a nation's prosperity. Growth in economic activities in any country brings with it challenges such as acidic emissions and pollution. More economic activities are supported by an increase in industrial manufacturing and infrastructure development, which also result in the emissions of pollutants such as Sulfur dioxide.
Furthermore, with the growth in the global economy and population, more energy will be required to fuel the increased level of activity. The raised demand for electricity will fuel the demand for coal, resulting in higher GHG emissions. As a result, it is expected that the power generation industry will continue to drive the industrial demand for air cleaner filters, thereby boosting the growth of the market during the forecast period.
Key Air Cleaner Filters Market Trends
Growing concern over IAQ in buildings is the primary trend shaping market growth. The alarming pollution levels globally have not only affected the quality of air outdoors but have also adversely impacted that of indoor air. The use of more synthetic composites in construction materials has brought about a deterioration in the IAQ.
In addition, poor IAQ may lead to building-related health issues such as sick building syndrome and multiple chemical sensitivity. Furthermore, the rise in construction activities and massive resurgence in urban infrastructure in APAC will add impetus to the demand for air cleaner filters, thereby driving the growth of the market during the forecast period.
Key Air Cleaner Filters Market Challenge
Lack of awareness about the replacement of air cleaner filters is a challenge that affects market growth. Air cleaner filters have a lifespan, and using them beyond this lifespan may result in the inefficient working of these filters, thus resulting in productivity issues. Many end-users are not aware of the lifespan of the air cleaner filters and the consequences of not replacing them. Unchanged air filters can pose a serious threat to engines and other machinery and hamper their performance.
Furthermore, industrial air cleaners require regular maintenance to work at full efficiency; however, many end-users are unaware of this and use them without proper maintenance. As a result, the efficiency of the air cleaner filter is hampered over time. Thus, the lack of awareness about the replacement of air cleaner filters may impede the growth of the market during the forecast period.
Air Cleaner Filters Market Customer Landscape
The Air Cleaner Filters market analysis research report includes the adoption lifecycle of the market, covering from the innovator’s stage to the laggard’s stage. It focuses on adoption rates in different regions based on penetration. Furthermore, the report also includes key purchase criteria and drivers of price sensitivity to help companies evaluate and develop their growth strategies.
Global Air Cleaner Filters Market Customer Landscape
Who are the Major Air Cleaner Filters Market Companies?
Companies are implementing various strategies, such as strategic alliances, partnerships, mergers and acquisitions, geographical expansion, and product/service launches, to enhance their presence in the market.
- Camfil AB: The company offers air cleaner filters such as city air purifiers, camcarb xg and Hi Flo.
The research report also includes detailed analyses of the competitive landscape of the market and information about 20 market companies, including:
- American Air Filter Co. Inc.
- Carrier Global Corp.
- Cummins Inc.
- Daikin Industries Ltd.
- Dyson Group Co.
- Filtration Group Corp.
- Honeywell International Inc.
- IQAir AG
- Koninklijke Philips N.V.
- LG Electronics Inc.
- MANN HUMMEL International GmbH and Co. KG
- Panasonic Holdings Corp.
- Parker Hannifin Corp.
- Samsung Electronics Co. Ltd.
- Sharp Corp.
- Unilever PLC
- United Filter Industries Pvt. Ltd.
- Whirlpool Corp.
- Donaldson Co. Inc.
Qualitative and quantitative analysis of companies has been conducted to help clients understand the wider business environment as well as the strengths and weaknesses of key market players. Data is qualitatively analyzed to categorize companies as pure play, category-focused, industry-focused, and diversified; it is quantitatively analyzed to categorize companies as dominant, leading, strong, tentative, and weak.
What is the Largest-Growing Segments in the Air Cleaner Filters Market?
The HVAC segment is estimated to witness significant growth during the forecast period. The HVAC industry is subdivided into commercial, residential, and industrial segments. The commercial sector contributes a significant share of the market. The decline in indoor air quality (IAQ) has resulted in the use of better air cleaner filters. Moreover, the rising construction activities in the US will further drive the demand for air cleaner filters.
Get a glance at the market contribution of various segments Download the PDF Sample
The HVAC segment was the largest segment and was valued at USD 10.96 billion in 2018. The choice of air cleaner filters depends on the application and the IAQ. Health centers and research laboratories need high-efficiency filters, and therefore, they use high-efficiency particulate air (HEPA) and ultra-low particulate air (ULPA) filters, which have an efficiency rate of 99.99%. Some of the market players are focusing on launching new variants of air cleaner filters for HVAC applications. Thus, such factors will drive the growth of the segment in the market in focus during the forecast period.
Which are the Key Regions for the Air Cleaner Filters Market?
For more insights on the market share of various regions Download the PDF Sample now!
APAC is estimated to contribute 57% to the growth of the global market during the forecast period. Technavio’s analysts have elaborately explained the regional trends and drivers that shape the market during the forecast period. In APAC, China and India will continue their dominance in the automotive industry, especially in the two-wheel market. Air cleaner filters in the automotive industry remove airborne contaminants, ensuring clean air intake for engine performance and reduced emissions. Furthermore, some of the players operating in the market are focusing on expanding their presence through acquisitions. Hence, these are some of the factors that can influence the demand for air cleaner filters in the region during the forecast period.
Segment Overview
The air cleaner filters market report forecasts market growth by revenue at global, regional & country levels and provides an analysis of the latest trends and growth opportunities from 2018 to 2028.
- End-user Outlook
- HVAC
- Industrial
- Automotive
- Others
- Distribution Channel Outlook
- Offline
- Online
- Region Outlook
- North America
- The U.S.
- Canada
- Europe
- The U.K.
- Germany
- France
- Rest of Europe
- APAC
- China
- India
- South America
- Chile
- Brazil
- Argentina
- Middle East & Africa
- Saudi Arabia
- South Africa
- Rest of the Middle East & Africa
- North America
|
Air Cleaner Filters Market Scope |
|
|
Report Coverage |
Details |
|
Page number |
180 |
|
Base year |
2023 |
|
Historic period |
2018-2022 |
|
Forecast period |
2024-2028 |
|
Growth momentum & CAGR |
Accelerate at a CAGR of 6.97% |
|
Market Growth 2024-2028 |
USD 9.50 billion |
|
Market structure |
Fragmented |
|
YoY growth 2023-2024(%) |
6.55 |
|
Regional analysis |
APAC, Europe, North America, Middle East and Africa, and South America |
|
Performing market contribution |
APAC at 57% |
|
Key countries |
US, China, Japan, Germany, and France |
|
Competitive landscape |
Leading Companies, Market Positioning of Companies, Competitive Strategies, and Industry Risks |
|
Key companies profiled |
American Air Filter Co. Inc., Camfil AB, Carrier Global Corp., Cummins Inc., Daikin Industries Ltd., Dyson Group Co., Filtration Group Corp., Honeywell International Inc., IQAir AG, Koninklijke Philips N.V., LG Electronics Inc., MANN HUMMEL International GmbH and Co. KG, Panasonic Holdings Corp., Parker Hannifin Corp., Samsung Electronics Co. Ltd., Sharp Corp., Unilever PLC, United Filter Industries Pvt. Ltd., Whirlpool Corp., and Donaldson Co. Inc. |
|
Market dynamics |
Parent market analysis, Market growth inducers and obstacles, Fast-growing and slow-growing segment analysis, COVID-19 impact and recovery analysis and future consumer dynamics, Market condition analysis for the forecast period. |
|
Customization purview |
If our report has not included the data that you are looking for, you can reach out to our analysts and get segments customized. |
What are the Key Data Covered in this Air Cleaner Filters Market Research Report?
- CAGR of the market during the forecast period
- Detailed information on factors that will drive the growth of the market between 2024 and 2028
- Precise estimation of the market size and its contribution of the market in focus to the parent market
- Accurate predictions about upcoming trends and changes in consumer behavior
- Growth of the market across APAC, Europe, North America, Middle East and Africa, and South America
- Thorough analysis of the market’s competitive landscape and detailed information about companies
- Comprehensive analysis of factors that will challenge the growth of market companies
We can help! Our analysts can customize this market research report to meet your requirements.
1 Executive Summary
- 1.1 Market overview
- Exhibit 01: Executive Summary – Chart on Market Overview
- Exhibit 02: Executive Summary – Data Table on Market Overview
- Exhibit 03: Executive Summary – Chart on Global Market Characteristics
- Exhibit 04: Executive Summary – Chart on Market by Geography
- Exhibit 05: Executive Summary – Chart on Market Segmentation by End-user
- Exhibit 06: Executive Summary – Chart on Market Segmentation by Distribution Channel
- Exhibit 07: Executive Summary – Chart on Incremental Growth
- Exhibit 08: Executive Summary – Data Table on Incremental Growth
- Exhibit 09: Executive Summary – Chart on Vendor Market Positioning
2 Market Landscape
- 2.1 Market ecosystem
- Exhibit 10: Parent market
- Exhibit 11: Market Characteristics
3 Market Sizing
- 3.1 Market definition
- Exhibit 12: Offerings of vendors included in the market definition
- 3.2 Market segment analysis
- Exhibit 13: Market segments
- 3.3 Market size 2023
- 3.4 Market outlook: Forecast for 2023-2028
- Exhibit 14: Chart on Global - Market size and forecast 2023-2028 ($ billion)
- Exhibit 15: Data Table on Global - Market size and forecast 2023-2028 ($ billion)
- Exhibit 16: Chart on Global Market: Year-over-year growth 2023-2028 (%)
- Exhibit 17: Data Table on Global Market: Year-over-year growth 2023-2028 (%)
4 Historic Market Size
- 4.1 Global air cleaner filters market 2018 - 2022
- Exhibit 18: Historic Market Size – Data Table on global air cleaner filters market 2018 - 2022 ($ billion)
- 4.2 End-user Segment Analysis 2018 - 2022
- Exhibit 19: Historic Market Size – End-user Segment 2018 - 2022 ($ billion)
- 4.3 Distribution channel Segment Analysis 2018 - 2022
- Exhibit 20: Historic Market Size – Distribution channel Segment 2018 - 2022 ($ billion)
- 4.4 Geography Segment Analysis 2018 - 2022
- Exhibit 21: Historic Market Size – Geography Segment 2018 - 2022 ($ billion)
- 4.5 Country Segment Analysis 2018 - 2022
- Exhibit 22: Historic Market Size – Country Segment 2018 - 2022 ($ billion)
5 Five Forces Analysis
- 5.1 Five forces summary
- Exhibit 23: Five forces analysis - Comparison between 2023 and 2028
- 5.2 Bargaining power of buyers
- Exhibit 24: Chart on Bargaining power of buyers – Impact of key factors 2023 and 2028
- 5.3 Bargaining power of suppliers
- Exhibit 25: Bargaining power of suppliers – Impact of key factors in 2023 and 2028
- 5.4 Threat of new entrants
- Exhibit 26: Threat of new entrants – Impact of key factors in 2023 and 2028
- 5.5 Threat of substitutes
- Exhibit 27: Threat of substitutes – Impact of key factors in 2023 and 2028
- 5.6 Threat of rivalry
- Exhibit 28: Threat of rivalry – Impact of key factors in 2023 and 2028
- 5.7 Market condition
- Exhibit 29: Chart on Market condition - Five forces 2023 and 2028
6 Market Segmentation by End-user
- 6.1 Market segments
- Exhibit 30: Chart on End-user - Market share 2023-2028 (%)
- Exhibit 31: Data Table on End-user - Market share 2023-2028 (%)
- 6.2 Comparison by End-user
- Exhibit 32: Chart on Comparison by End-user
- Exhibit 33: Data Table on Comparison by End-user
- 6.3 HVAC - Market size and forecast 2023-2028
- Exhibit 34: Chart on HVAC - Market size and forecast 2023-2028 ($ billion)
- Exhibit 35: Data Table on HVAC - Market size and forecast 2023-2028 ($ billion)
- Exhibit 36: Chart on HVAC - Year-over-year growth 2023-2028 (%)
- Exhibit 37: Data Table on HVAC - Year-over-year growth 2023-2028 (%)
- 6.4 Industrial - Market size and forecast 2023-2028
- Exhibit 38: Chart on Industrial - Market size and forecast 2023-2028 ($ billion)
- Exhibit 39: Data Table on Industrial - Market size and forecast 2023-2028 ($ billion)
- Exhibit 40: Chart on Industrial - Year-over-year growth 2023-2028 (%)
- Exhibit 41: Data Table on Industrial - Year-over-year growth 2023-2028 (%)
- 6.5 Automotive - Market size and forecast 2023-2028
- Exhibit 42: Chart on Automotive - Market size and forecast 2023-2028 ($ billion)
- Exhibit 43: Data Table on Automotive - Market size and forecast 2023-2028 ($ billion)
- Exhibit 44: Chart on Automotive - Year-over-year growth 2023-2028 (%)
- Exhibit 45: Data Table on Automotive - Year-over-year growth 2023-2028 (%)
- 6.6 Others - Market size and forecast 2023-2028
- Exhibit 46: Chart on Others - Market size and forecast 2023-2028 ($ billion)
- Exhibit 47: Data Table on Others - Market size and forecast 2023-2028 ($ billion)
- Exhibit 48: Chart on Others - Year-over-year growth 2023-2028 (%)
- Exhibit 49: Data Table on Others - Year-over-year growth 2023-2028 (%)
- 6.7 Market opportunity by End-user
- Exhibit 50: Market opportunity by End-user ($ billion)
- Exhibit 51: Data Table on Market opportunity by End-user ($ billion)
7 Market Segmentation by Distribution Channel
- 7.1 Market segments
- Exhibit 52: Chart on Distribution Channel - Market share 2023-2028 (%)
- Exhibit 53: Data Table on Distribution Channel - Market share 2023-2028 (%)
- 7.2 Comparison by Distribution Channel
- Exhibit 54: Chart on Comparison by Distribution Channel
- Exhibit 55: Data Table on Comparison by Distribution Channel
- 7.3 Offline - Market size and forecast 2023-2028
- Exhibit 56: Chart on Offline - Market size and forecast 2023-2028 ($ billion)
- Exhibit 57: Data Table on Offline - Market size and forecast 2023-2028 ($ billion)
- Exhibit 58: Chart on Offline - Year-over-year growth 2023-2028 (%)
- Exhibit 59: Data Table on Offline - Year-over-year growth 2023-2028 (%)
- 7.4 Online - Market size and forecast 2023-2028
- Exhibit 60: Chart on Online - Market size and forecast 2023-2028 ($ billion)
- Exhibit 61: Data Table on Online - Market size and forecast 2023-2028 ($ billion)
- Exhibit 62: Chart on Online - Year-over-year growth 2023-2028 (%)
- Exhibit 63: Data Table on Online - Year-over-year growth 2023-2028 (%)
- 7.5 Market opportunity by Distribution Channel
- Exhibit 64: Market opportunity by Distribution Channel ($ billion)
- Exhibit 65: Data Table on Market opportunity by Distribution Channel ($ billion)
8 Customer Landscape
- 8.1 Customer landscape overview
- Exhibit 66: Analysis of price sensitivity, lifecycle, customer purchase basket, adoption rates, and purchase criteria
9 Geographic Landscape
- 9.1 Geographic segmentation
- Exhibit 67: Chart on Market share by geography 2023-2028 (%)
- Exhibit 68: Data Table on Market share by geography 2023-2028 (%)
- 9.2 Geographic comparison
- Exhibit 69: Chart on Geographic comparison
- Exhibit 70: Data Table on Geographic comparison
- 9.3 APAC - Market size and forecast 2023-2028
- Exhibit 71: Chart on APAC - Market size and forecast 2023-2028 ($ billion)
- Exhibit 72: Data Table on APAC - Market size and forecast 2023-2028 ($ billion)
- Exhibit 73: Chart on APAC - Year-over-year growth 2023-2028 (%)
- Exhibit 74: Data Table on APAC - Year-over-year growth 2023-2028 (%)
- 9.4 Europe - Market size and forecast 2023-2028
- Exhibit 75: Chart on Europe - Market size and forecast 2023-2028 ($ billion)
- Exhibit 76: Data Table on Europe - Market size and forecast 2023-2028 ($ billion)
- Exhibit 77: Chart on Europe - Year-over-year growth 2023-2028 (%)
- Exhibit 78: Data Table on Europe - Year-over-year growth 2023-2028 (%)
- 9.5 North America - Market size and forecast 2023-2028
- Exhibit 79: Chart on North America - Market size and forecast 2023-2028 ($ billion)
- Exhibit 80: Data Table on North America - Market size and forecast 2023-2028 ($ billion)
- Exhibit 81: Chart on North America - Year-over-year growth 2023-2028 (%)
- Exhibit 82: Data Table on North America - Year-over-year growth 2023-2028 (%)
- 9.6 Middle East and Africa - Market size and forecast 2023-2028
- Exhibit 83: Chart on Middle East and Africa - Market size and forecast 2023-2028 ($ billion)
- Exhibit 84: Data Table on Middle East and Africa - Market size and forecast 2023-2028 ($ billion)
- Exhibit 85: Chart on Middle East and Africa - Year-over-year growth 2023-2028 (%)
- Exhibit 86: Data Table on Middle East and Africa - Year-over-year growth 2023-2028 (%)
- 9.7 South America - Market size and forecast 2023-2028
- Exhibit 87: Chart on South America - Market size and forecast 2023-2028 ($ billion)
- Exhibit 88: Data Table on South America - Market size and forecast 2023-2028 ($ billion)
- Exhibit 89: Chart on South America - Year-over-year growth 2023-2028 (%)
- Exhibit 90: Data Table on South America - Year-over-year growth 2023-2028 (%)
- 9.8 China - Market size and forecast 2023-2028
- Exhibit 91: Chart on China - Market size and forecast 2023-2028 ($ billion)
- Exhibit 92: Data Table on China - Market size and forecast 2023-2028 ($ billion)
- Exhibit 93: Chart on China - Year-over-year growth 2023-2028 (%)
- Exhibit 94: Data Table on China - Year-over-year growth 2023-2028 (%)
- 9.9 US - Market size and forecast 2023-2028
- Exhibit 95: Chart on US - Market size and forecast 2023-2028 ($ billion)
- Exhibit 96: Data Table on US - Market size and forecast 2023-2028 ($ billion)
- Exhibit 97: Chart on US - Year-over-year growth 2023-2028 (%)
- Exhibit 98: Data Table on US - Year-over-year growth 2023-2028 (%)
- 9.10 Japan - Market size and forecast 2023-2028
- Exhibit 99: Chart on Japan - Market size and forecast 2023-2028 ($ billion)
- Exhibit 100: Data Table on Japan - Market size and forecast 2023-2028 ($ billion)
- Exhibit 101: Chart on Japan - Year-over-year growth 2023-2028 (%)
- Exhibit 102: Data Table on Japan - Year-over-year growth 2023-2028 (%)
- 9.11 Germany - Market size and forecast 2023-2028
- Exhibit 103: Chart on Germany - Market size and forecast 2023-2028 ($ billion)
- Exhibit 104: Data Table on Germany - Market size and forecast 2023-2028 ($ billion)
- Exhibit 105: Chart on Germany - Year-over-year growth 2023-2028 (%)
- Exhibit 106: Data Table on Germany - Year-over-year growth 2023-2028 (%)
- 9.12 France - Market size and forecast 2023-2028
- Exhibit 107: Chart on France - Market size and forecast 2023-2028 ($ billion)
- Exhibit 108: Data Table on France - Market size and forecast 2023-2028 ($ billion)
- Exhibit 109: Chart on France - Year-over-year growth 2023-2028 (%)
- Exhibit 110: Data Table on France - Year-over-year growth 2023-2028 (%)
- 9.13 Market opportunity by geography
- Exhibit 111: Market opportunity by geography ($ billion)
- Exhibit 112: Data Tables on Market opportunity by geography ($ billion)
10 Drivers, Challenges, and Trends
- 10.1 Market drivers
- 10.2 Market challenges
- 10.3 Impact of drivers and challenges
- Exhibit 113: Impact of drivers and challenges in 2023 and 2028
- 10.4 Market trends
11 Vendor Landscape
- 11.1 Overview
- 11.2 Vendor landscape
- Exhibit 114: Overview on Criticality of inputs and Factors of differentiation
- 11.3 Landscape disruption
- Exhibit 115: Overview on factors of disruption
- 11.4 Industry risks
- Exhibit 116: Impact of key risks on business
12 Vendor Analysis
- 12.1 Vendors covered
- Exhibit 117: Vendors covered
- 12.2 Market positioning of vendors
- Exhibit 118: Matrix on vendor position and classification
- 12.3 Camfil AB
- Exhibit 119: Camfil AB - Overview
- Exhibit 120: Camfil AB - Product / Service
- Exhibit 121: Camfil AB - Key offerings
- 12.4 Carrier Global Corp.
- Exhibit 122: Carrier Global Corp. - Overview
- Exhibit 123: Carrier Global Corp. - Business segments
- Exhibit 124: Carrier Global Corp. - Key news
- Exhibit 125: Carrier Global Corp. - Key offerings
- Exhibit 126: Carrier Global Corp. - Segment focus
- 12.5 Daikin Industries Ltd.
- Exhibit 127: Daikin Industries Ltd. - Overview
- Exhibit 128: Daikin Industries Ltd. - Business segments
- Exhibit 129: Daikin Industries Ltd. - Key news
- Exhibit 130: Daikin Industries Ltd. - Key offerings
- Exhibit 131: Daikin Industries Ltd. - Segment focus
- 12.6 Dyson Group Co.
- Exhibit 132: Dyson Group Co. - Overview
- Exhibit 133: Dyson Group Co. - Product / Service
- Exhibit 134: Dyson Group Co. - Key offerings
- 12.7 Honeywell International Inc.
- Exhibit 135: Honeywell International Inc. - Overview
- Exhibit 136: Honeywell International Inc. - Business segments
- Exhibit 137: Honeywell International Inc. - Key news
- Exhibit 138: Honeywell International Inc. - Key offerings
- Exhibit 139: Honeywell International Inc. - Segment focus
- 12.8 IQAir AG
- Exhibit 140: IQAir AG - Overview
- Exhibit 141: IQAir AG - Product / Service
- Exhibit 142: IQAir AG - Key offerings
- 12.9 Koninklijke Philips N.V.
- Exhibit 143: Koninklijke Philips N.V. - Overview
- Exhibit 144: Koninklijke Philips N.V. - Business segments
- Exhibit 145: Koninklijke Philips N.V. - Key news
- Exhibit 146: Koninklijke Philips N.V. - Key offerings
- Exhibit 147: Koninklijke Philips N.V. - Segment focus
- 12.10 LG Electronics Inc.
- Exhibit 148: LG Electronics Inc. - Overview
- Exhibit 149: LG Electronics Inc. - Product / Service
- Exhibit 150: LG Electronics Inc. - Key offerings
- 12.11 MANN HUMMEL International GmbH and Co. KG
- Exhibit 151: MANN HUMMEL International GmbH and Co. KG - Overview
- Exhibit 152: MANN HUMMEL International GmbH and Co. KG - Business segments
- Exhibit 153: MANN HUMMEL International GmbH and Co. KG - Key offerings
- Exhibit 154: MANN HUMMEL International GmbH and Co. KG - Segment focus
- 12.12 Panasonic Holdings Corp.
- Exhibit 155: Panasonic Holdings Corp. - Overview
- Exhibit 156: Panasonic Holdings Corp. - Business segments
- Exhibit 157: Panasonic Holdings Corp. - Key news
- Exhibit 158: Panasonic Holdings Corp. - Key offerings
- Exhibit 159: Panasonic Holdings Corp. - Segment focus
- 12.13 Parker Hannifin Corp.
- Exhibit 160: Parker Hannifin Corp. - Overview
- Exhibit 161: Parker Hannifin Corp. - Business segments
- Exhibit 162: Parker Hannifin Corp. - Key news
- Exhibit 163: Parker Hannifin Corp. - Key offerings
- Exhibit 164: Parker Hannifin Corp. - Segment focus
- 12.14 Samsung Electronics Co. Ltd.
- Exhibit 165: Samsung Electronics Co. Ltd. - Overview
- Exhibit 166: Samsung Electronics Co. Ltd. - Business segments
- Exhibit 167: Samsung Electronics Co. Ltd. - Key news
- Exhibit 168: Samsung Electronics Co. Ltd. - Key offerings
- Exhibit 169: Samsung Electronics Co. Ltd. - Segment focus
- 12.15 Sharp Corp.
- Exhibit 170: Sharp Corp. - Overview
- Exhibit 171: Sharp Corp. - Business segments
- Exhibit 172: Sharp Corp. - Key news
- Exhibit 173: Sharp Corp. - Key offerings
- Exhibit 174: Sharp Corp. - Segment focus
- 12.16 Unilever PLC
- Exhibit 175: Unilever PLC - Overview
- Exhibit 176: Unilever PLC - Business segments
- Exhibit 177: Unilever PLC - Key news
- Exhibit 178: Unilever PLC - Key offerings
- Exhibit 179: Unilever PLC - Segment focus
- 12.17 Whirlpool Corp.
- Exhibit 180: Whirlpool Corp. - Overview
- Exhibit 181: Whirlpool Corp. - Business segments
- Exhibit 182: Whirlpool Corp. - Key offerings
- Exhibit 183: Whirlpool Corp. - Segment focus
13 Appendix
- 13.1 Scope of the report
- 13.2 Inclusions and exclusions checklist
- Exhibit 184: Inclusions checklist
- Exhibit 185: Exclusions checklist
- 13.3 Currency conversion rates for US$
- Exhibit 186: Currency conversion rates for US$
- 13.4 Research methodology
- Exhibit 187: Research methodology
- Exhibit 188: Validation techniques employed for market sizing
- Exhibit 189: Information sources
- 13.5 List of abbreviations
- Exhibit 190: List of abbreviations
Research Framework
Technavio presents a detailed picture of the market by way of study, synthesis, and summation of data from multiple sources. The analysts have presented the various facets of the market with a particular focus on identifying the key industry influencers. The data thus presented is comprehensive, reliable, and the result of extensive research, both primary and secondary.
INFORMATION SOURCES
Primary sources
- Manufacturers and suppliers
- Channel partners
- Industry experts
- Strategic decision makers
Secondary sources
- Industry journals and periodicals
- Government data
- Financial reports of key industry players
- Historical data
- Press releases
DATA ANALYSIS
Data Synthesis
- Collation of data
- Estimation of key figures
- Analysis of derived insights
Data Validation
- Triangulation with data models
- Reference against proprietary databases
- Corroboration with industry experts
REPORT WRITING
Qualitative
- Market drivers
- Market challenges
- Market trends
- Five forces analysis
Quantitative
- Market size and forecast
- Market segmentation
- Geographical insights
- Competitive landscape
PURCHASE FULL REPORT OF
air cleaner filters market market
Key Questions Answered
- What are the key global market and the regional market share?
- What are the revenue-generating key market segments?
- What are the key factors driving and challenging this market’s growth?
- Who are the key market vendors and their growth strategies?
- What are the latest trends influencing the growth of this market?
- What are the variables influencing the market growth in the primary regions?
- What are the factors influencing the growth of the parent market?
Why should you prefer Technavio's market insights report?
- Off-the-shelf research reports
- Reports can be tailored to meet the customer's needs
- Trusted by more than 100 fortune 500 organizations
- Information about the market's key drivers, trends, and challenges
- Parent market analysis
- Every week, 50,000 people visit our subscription platform
- Detailed vendors report with competitive landscape
- Covid-19 impact and recovery analysis
- Data on revenue-generating market segments
- Details on the market shares of various regions
- Five-force market analysis