Application Security Market Analysis North America, Europe, APAC, South America, Middle East and Africa - US, Canada, China, UK, Germany - Size and Forecast 2023-2027
| Published: Oct 2023 | Pages: 162 | SKU: IRTNTR46693 |
Application Security Market Forecast 2023-2027
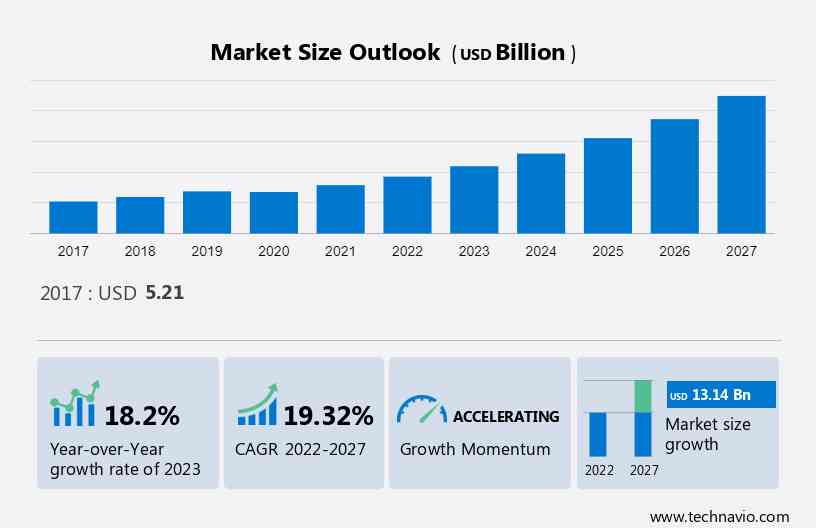
The application security market size is projected to reach a value of USD 13.14 billion with a CAGR of 19.32% between 2022 and 2027. The growth of the application security market depends on several factors, including a growing number of data leaks, an increase in demand for cloud-based application security solutions, and the need to comply with regulatory policies. This market growth and trends report includes an in-depth analysis of drivers, trends, and challenges. Furthermore, the report also includes historic market data from 2017 to 2021.
What will be the Size of the Application Security Market During the Forecast Period?
To learn more about this report, View Report Sample
Market Segmentation
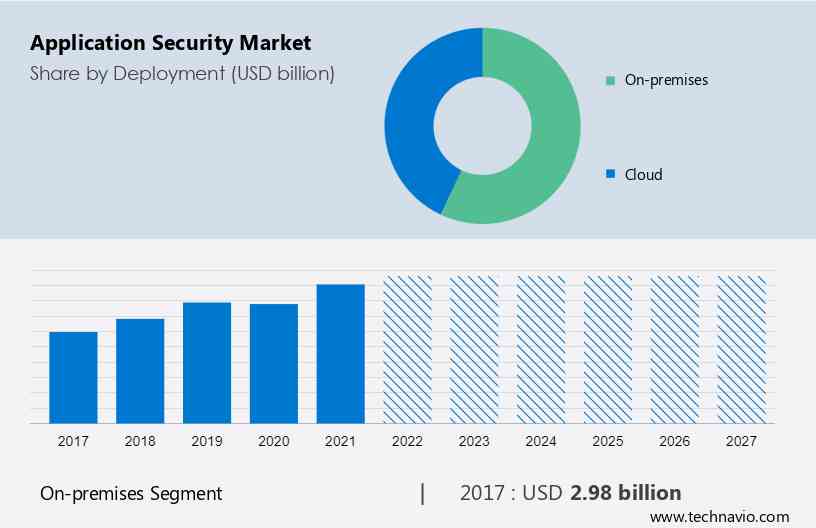
The market share growth by the on-premises segment will be significant during the forecast period. On-premises application security can be defined as the deployment of security solutions within an organization's own physical infrastructure or data centres rather than using cloud-based services. This solution enables organizations to have direct control over their security systems and data, which can be favourable for certain industries or businesses with specific security requirements.
Get a glance at the market contribution of various segments View the PDF Sample
The on-premises segment was valued at USD 2.98 billion in 2017 and continued to grow until 2021. The various services and solutions offered by the global market based on on-premise deployments include protecting applications, both Web application firewall market, and mobile app security, from potential threats and vulnerabilities throughout their lifecycle.
Web application firewall market (WAFs): WAFs provide a protective layer between web applications and external threats, such as malicious attacks or unauthorized access attempts. They inspect incoming and outgoing traffic, filter out malicious requests, and enforce security policies.Web application firewall market identify and mitigate threats such as SQL injection, cross-site scripting (XSS), cross-site request forgery (CSRF), and other web-based attacks targeting vulnerabilities in web application firewall market.
Some common features and functionalities of on-premises application security solutions are web application security, runtime application self-protection (RASP), and Secure code review and testing. Therefore, such benefits are expected to drive the global market growth during the forecast period.
The Cloud Application Security segment within the global market pertains to secure web gateway market solutions and services tailored for safeguarding applications and data in cloud environments. As organizations increasingly transition their data and applications to various cloud platforms—be it public, private, or hybrid—the rise in adoption of cloud computing also introduces novel security challenges and risks that demand attention. The market is driven by the expanding adoption of cloud computing, the surge in cyber threats targeting cloud environments, and the imperative need for regulatory compliance.
Regional Analysis
For more insights on the market share of various regions Download PDF Sample now!
North America is estimated to contribute 39% to the growth of the global market during the forecast period. Technavio’s analysts have elaborately explained the regional trends and drivers that shape the market during the forecast period.
Mobile app security refers to the practice of safeguarding mobile applications from potential threats and vulnerabilities. Factors like the proliferation of mobile devices and the ascent of cloud-based networking, coupled with the presence of major players like IBM, Cisco, Veracode, Contrast Security, Synopsis, and WhiteHat Security, significantly propel the growth of the Mobile App Security market worldwide. Notably, North America's prominent markets, especially in the US, lead due to their technological advancement and pioneering role in technology adoption. The region's increased adoption of cloud-based Mobile App Security services stems from rising security threats, thereby driving the global market's growth trajectory in the region for the forecast period.
Market Overview
The Secure web gateway (SWG) market refers to the realm of cybersecurity solutions designed to protect users and organizations from internet-based threats while enforcing security policies and ensuring compliance with regulatory standards. Secure web gateway act as a security barrier between internal networks and the internet, monitoring and filtering internet traffic to safeguard against various online risks.Secure web gateway regulate and control the use of specific applications and services, preventing unauthorized or risky application usage within the network.
Key Market Driver
One of the key factors driving the global market growth is the rise in demand for cloud-based application security solutions. Several vendors such as IBM and Broadcom offer cloud-based application security solutions due to the growing adoption of these solutions across industries. One of the key reasons for this increasing demand is that cloud-based solutions are less expensive than on-premises solutions and they do not require the actual installation of hardware and software, as they are maintained at the vendor data center, from where they can be accessed by enterprises on a subscription basis.
The main advantage of these solutions is that it is easier and less time-consuming than that of the on-premises application security solution. Also, the return on investment (ROI) is higher in the cloud-based application security solution. Furthermore, all enterprises only need to pay a subscription fee for each device, which comprises the maintenance and system upgrades. Thus, the cloud-based model is adopted across all the SMEs, as it enables them to use these solutions at a low cost. Hence, such benefits and cost factors are expected to drive the global market growth during the forecast period.
Market Trends and Analysis
A key factor shaping the global market growth is the prevalence of shadow IT. Shadow IT is a digital solution that is widely used across enterprises as a communication and collaboration tool to minimize workloads. Some of the prominent shadow IT tools include applications such as Slack, Google Docs, and Evernote.
The prevalence of shadow IT can be a significant threat to enterprises as It can increase the possibility of data loss due to unsecured cloud services, and sensitive data can be easily transmitted to persons outside of the enterprise. Thus, the application security solution can help enterprises to ensure the security of sensitive information by deploying this solution in the enterprise's entire network, thus helping it to comply with the regulations for securing sensitive data. Hence, such benefits are expected to drive the global market growth during the forecast period.
Major Market Challenge
The threat from open-source application security solutions is one of the key challenges hindering the global market growth. One of the key challenges to the market is the open-source application security solutions as they can be downloaded and run on all platforms and also they are becoming increasingly popular in developing economies such as India and China.
There is a growing adoption of open-source application security solutions across small-scale enterprises in these countries that cannot afford to invest in expensive on-premises and cloud-based application security solutions. Also, such applications need capital investment and are very economical for organizations with limited resources and expertise. Hence, such factors are expected to hinder the global market growth during the forecast period.
Customer Landscape
The market report includes the adoption lifecycle of the market, covering from the innovator’s stage to the laggard’s stage. It focuses on adoption rates in different regions based on penetration. Furthermore, the report also includes key purchase criteria and drivers of price sensitivity to help companies evaluate and develop their growth strategies.
Global Application Security Market Customer Landscape
Who are the Major Application Security Market Companies?
Companies are implementing various strategies, such as strategic alliances, partnerships, mergers and acquisitions, geographical expansion, and product/service launches, to enhance their presence in the market.
Rapid7 Inc: The company offers application security services such as DAST, replay attacks and validate fixes.
This market analysis and report also includes detailed analyses of the competitive landscape of the market and information about 20 market vendors, including:
- Broadcom Inc.
- Capgemini Service SAS
- Checkmarx Ltd.
- Contrast Security Inc.
- Dynatrace Inc.
- F5 Networks Inc.
- Fasoo
- Fortinet Inc.
- Hewlett Packard Enterprise Co.
- ImmuniWeb SA
- International Business Machines Corp.
- Invicti Security Ltd.
- NTT Corp.
- PRADEO Security Systems SAS
- Qualys Inc.
- Singapore Telecommunications Ltd.
- Sitelock LLC
- Synopsys Inc.
- Trend Micro Inc.
Qualitative and quantitative analysis of vendors has been conducted to help clients understand the wider business environment as well as the strengths and weaknesses of key market players. Data is qualitatively analyzed to categorize vendors as pure play, category-focused, industry-focused, and diversified; it is quantitatively analyzed to categorize vendors as dominant, leading, strong, tentative, and weak.
Market Analyst Overview
The Application Security Market is witnessing rapid growth driven by increasing concerns over cybersecurity threats and security breaches affecting business applications across various industries such as BFSI, healthcare, and web and mobile applications. Key stakeholders including key lenders and investors are prioritizing customer confidence by investing in software as a service (SaaS) solutions with dynamic application security testing (DAST) capabilities. With the rise of mobile and cloud-based technologies, organizations are leveraging artificial intelligence (AI) and machine learning (ML) algorithms for big data analytics to detect application vulnerabilities and mitigate risks. Bionic Signals and AI-driven methods are deployed by engineering teams to ensure sustainability and efficiency in customizable solutions for both large enterprises and small and medium-sized enterprises.
Segment Overview
This market research and growth report forecasts market growth by revenue at global, regional & country levels and provides an analysis of the latest trends and growth opportunities from 2017 to 2027.
- Deployment Outlook (USD billion, 2017 - 2027)
- On-premises
- Cloud
- End-user Outlook (USD billion, 2017 - 2027)
- Web application security
- Mobile application security
- Geography Outlook (USD billion, 2017 - 2027)
- North America
- The U.S.
- Canada
- Europe
- U.K.
- Germany
- France
- Rest of Europe
- APAC
- China
- India
- South America
- Chile
- Argentina
- Brazil
- Middle East & Africa
- Saudi Arabia
- South Africa
- Rest of the Middle East & Africa
- North America
|
Application Security Market Scope |
|
|
Report Coverage |
Details |
|
Page number |
162 |
|
Base year |
2022 |
|
Historic period |
2017-2021 |
|
Forecast period |
2023-2027 |
|
Growth momentum & CAGR |
Accelerate at a CAGR of 19.32% |
|
Market growth 2023-2027 |
USD 13.14 billion |
|
Market structure |
Fragmented |
|
YoY growth 2022-2023(%) |
18.2 |
|
Regional analysis |
North America, Europe, APAC, South America, and Middle East and Africa |
|
Performing market contribution |
North America at 39% |
|
Key countries |
US, Canada, China, UK, and Germany |
|
Competitive landscape |
Leading Vendors, Market Positioning of Vendors, Competitive Strategies, and Industry Risks |
|
Key companies profiled |
Broadcom Inc., Capgemini Service SAS, Checkmarx Ltd., Contrast Security Inc., Dynatrace Inc., F5 Networks Inc., Fasoo, Fortinet Inc., Hewlett Packard Enterprise Co., ImmuniWeb SA, International Business Machines Corp., Invicti Security Ltd., NTT Corp., PRADEO Security Systems SAS, Qualys Inc., Rapid7 Inc., Singapore Telecommunications Ltd., Sitelock LLC, Synopsys Inc., and Trend Micro Inc. |
|
Market dynamics |
Parent market analysis, Market growth inducers and obstacles, Fast-growing and slow-growing segment analysis, COVID 19 impact and recovery analysis and future consumer dynamics, Market condition analysis for forecast period |
|
Customization purview |
If our market report has not included the data that you are looking for, you can reach out to our analysts and get segments customized. |
What are the Key Data Covered in this Market Research Report?
- CAGR of the market during the forecast period
- Detailed information on factors that will drive the market growth and forecasting between 2023 and 2027
- Precise estimation of the market size and its contribution of the market in focus to the parent market
- Accurate predictions about upcoming trends and changes in consumer behaviour
- Market Growth Analysis across North America, Europe, APAC, South America, and Middle East and Africa
- Thorough analysis of the market’s competitive landscape and detailed information about vendors
- Market forecasting of factors that will challenge the growth of market vendors
We can help! Our analysts can customize this market research report to meet your requirements.
1 Executive Summary
- 1.1 Market overview
- Exhibit 01: Executive Summary – Chart on Market Overview
- Exhibit 02: Executive Summary – Data Table on Market Overview
- Exhibit 03: Executive Summary – Chart on Global Market Characteristics
- Exhibit 04: Executive Summary – Chart on Market by Geography
- Exhibit 05: Executive Summary – Chart on Market Segmentation by Deployment
- Exhibit 06: Executive Summary – Chart on Market Segmentation by End-user
- Exhibit 07: Executive Summary – Chart on Incremental Growth
- Exhibit 08: Executive Summary – Data Table on Incremental Growth
- Exhibit 09: Executive Summary – Chart on Vendor Market Positioning
2 Market Landscape
- 2.1 Market ecosystem
- Exhibit 10: Parent market
- Exhibit 11: Market Characteristics
3 Market Sizing
- 3.1 Market definition
- Exhibit 12: Offerings of vendors included in the market definition
- 3.2 Market segment analysis
- Exhibit 13: Market segments
- 3.3 Market size 2022
- 3.4 Market outlook: Forecast for 2022-2027
- Exhibit 14: Chart on Global - Market size and forecast 2022-2027 ($ million)
- Exhibit 15: Data Table on Global - Market size and forecast 2022-2027 ($ million)
- Exhibit 16: Chart on Global Market: Year-over-year growth 2022-2027 (%)
- Exhibit 17: Data Table on Global Market: Year-over-year growth 2022-2027 (%)
4 Historic Market Size
- 4.1 Global application security market 2017 - 2021
- Exhibit 18: Historic Market Size – Data Table on global application security market 2017 - 2021 ($ million)
- 4.2 Deployment Segment Analysis 2017 - 2021
- Exhibit 19: Historic Market Size – Deployment Segment 2017 - 2021 ($ million)
- 4.3 End-user Segment Analysis 2017 - 2021
- Exhibit 20: Historic Market Size – End-user Segment 2017 - 2021 ($ million)
- 4.4 Geography Segment Analysis 2017 - 2021
- Exhibit 21: Historic Market Size – Geography Segment 2017 - 2021 ($ million)
- 4.5 Country Segment Analysis 2017 - 2021
- Exhibit 22: Historic Market Size – Country Segment 2017 - 2021 ($ million)
5 Five Forces Analysis
- 5.1 Five forces summary
- Exhibit 23: Five forces analysis - Comparison between 2022 and 2027
- 5.2 Bargaining power of buyers
- Exhibit 24: Chart on Bargaining power of buyers – Impact of key factors 2022 and 2027
- 5.3 Bargaining power of suppliers
- Exhibit 25: Bargaining power of suppliers – Impact of key factors in 2022 and 2027
- 5.4 Threat of new entrants
- Exhibit 26: Threat of new entrants – Impact of key factors in 2022 and 2027
- 5.5 Threat of substitutes
- Exhibit 27: Threat of substitutes – Impact of key factors in 2022 and 2027
- 5.6 Threat of rivalry
- Exhibit 28: Threat of rivalry – Impact of key factors in 2022 and 2027
- 5.7 Market condition
- Exhibit 29: Chart on Market condition - Five forces 2022 and 2027
6 Market Segmentation by Deployment
- 6.1 Market segments
- Exhibit 30: Chart on Deployment - Market share 2022-2027 (%)
- Exhibit 31: Data Table on Deployment - Market share 2022-2027 (%)
- 6.2 Comparison by Deployment
- Exhibit 32: Chart on Comparison by Deployment
- Exhibit 33: Data Table on Comparison by Deployment
- 6.3 On-premises - Market size and forecast 2022-2027
- Exhibit 34: Chart on On-premises - Market size and forecast 2022-2027 ($ million)
- Exhibit 35: Data Table on On-premises - Market size and forecast 2022-2027 ($ million)
- Exhibit 36: Chart on On-premises - Year-over-year growth 2022-2027 (%)
- Exhibit 37: Data Table on On-premises - Year-over-year growth 2022-2027 (%)
- 6.4 Cloud - Market size and forecast 2022-2027
- Exhibit 38: Chart on Cloud - Market size and forecast 2022-2027 ($ million)
- Exhibit 39: Data Table on Cloud - Market size and forecast 2022-2027 ($ million)
- Exhibit 40: Chart on Cloud - Year-over-year growth 2022-2027 (%)
- Exhibit 41: Data Table on Cloud - Year-over-year growth 2022-2027 (%)
- 6.5 Market opportunity by Deployment
- Exhibit 42: Market opportunity by Deployment ($ million)
- Exhibit 43: Data Table on Market opportunity by Deployment ($ million)
7 Market Segmentation by End-user
- 7.1 Market segments
- Exhibit 44: Chart on End-user - Market share 2022-2027 (%)
- Exhibit 45: Data Table on End-user - Market share 2022-2027 (%)
- 7.2 Comparison by End-user
- Exhibit 46: Chart on Comparison by End-user
- Exhibit 47: Data Table on Comparison by End-user
- 7.3 Web application security - Market size and forecast 2022-2027
- Exhibit 48: Chart on Web application security - Market size and forecast 2022-2027 ($ million)
- Exhibit 49: Data Table on Web application security - Market size and forecast 2022-2027 ($ million)
- Exhibit 50: Chart on Web application security - Year-over-year growth 2022-2027 (%)
- Exhibit 51: Data Table on Web application security - Year-over-year growth 2022-2027 (%)
- 7.4 Mobile application security - Market size and forecast 2022-2027
- Exhibit 52: Chart on Mobile application security - Market size and forecast 2022-2027 ($ million)
- Exhibit 53: Data Table on Mobile application security - Market size and forecast 2022-2027 ($ million)
- Exhibit 54: Chart on Mobile application security - Year-over-year growth 2022-2027 (%)
- Exhibit 55: Data Table on Mobile application security - Year-over-year growth 2022-2027 (%)
- 7.5 Market opportunity by End-user
- Exhibit 56: Market opportunity by End-user ($ million)
- Exhibit 57: Data Table on Market opportunity by End-user ($ million)
8 Customer Landscape
- 8.1 Customer landscape overview
- Exhibit 58: Analysis of price sensitivity, lifecycle, customer purchase basket, adoption rates, and purchase criteria
9 Geographic Landscape
- 9.1 Geographic segmentation
- Exhibit 59: Chart on Market share by geography 2022-2027 (%)
- Exhibit 60: Data Table on Market share by geography 2022-2027 (%)
- 9.2 Geographic comparison
- Exhibit 61: Chart on Geographic comparison
- Exhibit 62: Data Table on Geographic comparison
- 9.3 North America - Market size and forecast 2022-2027
- Exhibit 63: Chart on North America - Market size and forecast 2022-2027 ($ million)
- Exhibit 64: Data Table on North America - Market size and forecast 2022-2027 ($ million)
- Exhibit 65: Chart on North America - Year-over-year growth 2022-2027 (%)
- Exhibit 66: Data Table on North America - Year-over-year growth 2022-2027 (%)
- 9.4 Europe - Market size and forecast 2022-2027
- Exhibit 67: Chart on Europe - Market size and forecast 2022-2027 ($ million)
- Exhibit 68: Data Table on Europe - Market size and forecast 2022-2027 ($ million)
- Exhibit 69: Chart on Europe - Year-over-year growth 2022-2027 (%)
- Exhibit 70: Data Table on Europe - Year-over-year growth 2022-2027 (%)
- 9.5 APAC - Market size and forecast 2022-2027
- Exhibit 71: Chart on APAC - Market size and forecast 2022-2027 ($ million)
- Exhibit 72: Data Table on APAC - Market size and forecast 2022-2027 ($ million)
- Exhibit 73: Chart on APAC - Year-over-year growth 2022-2027 (%)
- Exhibit 74: Data Table on APAC - Year-over-year growth 2022-2027 (%)
- 9.6 Middle East and Africa - Market size and forecast 2022-2027
- Exhibit 75: Chart on Middle East and Africa - Market size and forecast 2022-2027 ($ million)
- Exhibit 76: Data Table on Middle East and Africa - Market size and forecast 2022-2027 ($ million)
- Exhibit 77: Chart on Middle East and Africa - Year-over-year growth 2022-2027 (%)
- Exhibit 78: Data Table on Middle East and Africa - Year-over-year growth 2022-2027 (%)
- 9.7 South America - Market size and forecast 2022-2027
- Exhibit 79: Chart on South America - Market size and forecast 2022-2027 ($ million)
- Exhibit 80: Data Table on South America - Market size and forecast 2022-2027 ($ million)
- Exhibit 81: Chart on South America - Year-over-year growth 2022-2027 (%)
- Exhibit 82: Data Table on South America - Year-over-year growth 2022-2027 (%)
- 9.8 US - Market size and forecast 2022-2027
- Exhibit 83: Chart on US - Market size and forecast 2022-2027 ($ million)
- Exhibit 84: Data Table on US - Market size and forecast 2022-2027 ($ million)
- Exhibit 85: Chart on US - Year-over-year growth 2022-2027 (%)
- Exhibit 86: Data Table on US - Year-over-year growth 2022-2027 (%)
- 9.9 China - Market size and forecast 2022-2027
- Exhibit 87: Chart on China - Market size and forecast 2022-2027 ($ million)
- Exhibit 88: Data Table on China - Market size and forecast 2022-2027 ($ million)
- Exhibit 89: Chart on China - Year-over-year growth 2022-2027 (%)
- Exhibit 90: Data Table on China - Year-over-year growth 2022-2027 (%)
- 9.10 UK - Market size and forecast 2022-2027
- Exhibit 91: Chart on UK - Market size and forecast 2022-2027 ($ million)
- Exhibit 92: Data Table on UK - Market size and forecast 2022-2027 ($ million)
- Exhibit 93: Chart on UK - Year-over-year growth 2022-2027 (%)
- Exhibit 94: Data Table on UK - Year-over-year growth 2022-2027 (%)
- 9.11 Canada - Market size and forecast 2022-2027
- Exhibit 95: Chart on Canada - Market size and forecast 2022-2027 ($ million)
- Exhibit 96: Data Table on Canada - Market size and forecast 2022-2027 ($ million)
- Exhibit 97: Chart on Canada - Year-over-year growth 2022-2027 (%)
- Exhibit 98: Data Table on Canada - Year-over-year growth 2022-2027 (%)
- 9.12 Germany - Market size and forecast 2022-2027
- Exhibit 99: Chart on Germany - Market size and forecast 2022-2027 ($ million)
- Exhibit 100: Data Table on Germany - Market size and forecast 2022-2027 ($ million)
- Exhibit 101: Chart on Germany - Year-over-year growth 2022-2027 (%)
- Exhibit 102: Data Table on Germany - Year-over-year growth 2022-2027 (%)
- 9.13 Market opportunity by geography
- Exhibit 103: Market opportunity by geography ($ million)
- Exhibit 104: Data Tables on Market opportunity by geography ($ million)
10 Drivers, Challenges, and Trends
- 10.1 Market drivers
- 10.2 Market challenges
- 10.3 Impact of drivers and challenges
- Exhibit 105: Impact of drivers and challenges in 2022 and 2027
- 10.4 Market trends
11 Vendor Landscape
- 11.1 Overview
- 11.2 Vendor landscape
- Exhibit 106: Overview on Criticality of inputs and Factors of differentiation
- 11.3 Landscape disruption
- Exhibit 107: Overview on factors of disruption
- 11.4 Industry risks
- Exhibit 108: Impact of key risks on business
12 Vendor Analysis
- 12.1 Vendors covered
- Exhibit 109: Vendors covered
- 12.2 Market positioning of vendors
- Exhibit 110: Matrix on vendor position and classification
- 12.3 Broadcom Inc.
- Exhibit 111: Broadcom Inc. - Overview
- Exhibit 112: Broadcom Inc. - Business segments
- Exhibit 113: Broadcom Inc. - Key news
- Exhibit 114: Broadcom Inc. - Key offerings
- Exhibit 115: Broadcom Inc. - Segment focus
- 12.4 Capgemini Service SAS
- Exhibit 116: Capgemini Service SAS - Overview
- Exhibit 117: Capgemini Service SAS - Business segments
- Exhibit 118: Capgemini Service SAS - Key news
- Exhibit 119: Capgemini Service SAS - Key offerings
- Exhibit 120: Capgemini Service SAS - Segment focus
- 12.5 Checkmarx Ltd.
- Exhibit 121: Checkmarx Ltd. - Overview
- Exhibit 122: Checkmarx Ltd. - Product / Service
- Exhibit 123: Checkmarx Ltd. - Key news
- Exhibit 124: Checkmarx Ltd. - Key offerings
- 12.6 Contrast Security Inc.
- Exhibit 125: Contrast Security Inc. - Overview
- Exhibit 126: Contrast Security Inc. - Product / Service
- Exhibit 127: Contrast Security Inc. - Key offerings
- 12.7 Dynatrace Inc.
- Exhibit 128: Dynatrace Inc. - Overview
- Exhibit 129: Dynatrace Inc. - Product / Service
- Exhibit 130: Dynatrace Inc. - Key offerings
- 12.8 F5 Networks Inc.
- Exhibit 131: F5 Networks Inc. - Overview
- Exhibit 132: F5 Networks Inc. - Product / Service
- Exhibit 133: F5 Networks Inc. - Key news
- Exhibit 134: F5 Networks Inc. - Key offerings
- 12.9 Fasoo
- Exhibit 135: Fasoo - Overview
- Exhibit 136: Fasoo - Product / Service
- Exhibit 137: Fasoo - Key offerings
- 12.10 Fortinet Inc.
- Exhibit 138: Fortinet Inc. - Overview
- Exhibit 139: Fortinet Inc. - Product / Service
- Exhibit 140: Fortinet Inc. - Key offerings
- 12.11 Hewlett Packard Enterprise Co.
- Exhibit 141: Hewlett Packard Enterprise Co. - Overview
- Exhibit 142: Hewlett Packard Enterprise Co. - Business segments
- Exhibit 143: Hewlett Packard Enterprise Co. - Key news
- Exhibit 144: Hewlett Packard Enterprise Co. - Key offerings
- Exhibit 145: Hewlett Packard Enterprise Co. - Segment focus
- 12.12 ImmuniWeb SA
- Exhibit 146: ImmuniWeb SA - Overview
- Exhibit 147: ImmuniWeb SA - Product / Service
- Exhibit 148: ImmuniWeb SA - Key offerings
- 12.13 International Business Machines Corp.
- Exhibit 149: International Business Machines Corp. - Overview
- Exhibit 150: International Business Machines Corp. - Business segments
- Exhibit 151: International Business Machines Corp. - Key news
- Exhibit 152: International Business Machines Corp. - Key offerings
- Exhibit 153: International Business Machines Corp. - Segment focus
- 12.14 Invicti Security Ltd.
- Exhibit 154: Invicti Security Ltd. - Overview
- Exhibit 155: Invicti Security Ltd. - Product / Service
- Exhibit 156: Invicti Security Ltd. - Key offerings
- 12.15 PRADEO Security Systems SAS
- Exhibit 157: PRADEO Security Systems SAS - Overview
- Exhibit 158: PRADEO Security Systems SAS - Product / Service
- Exhibit 159: PRADEO Security Systems SAS - Key offerings
- 12.16 Qualys Inc.
- Exhibit 160: Qualys Inc. - Overview
- Exhibit 161: Qualys Inc. - Product / Service
- Exhibit 162: Qualys Inc. - Key offerings
- 12.17 Rapid7 Inc.
- Exhibit 163: Rapid7 Inc. - Overview
- Exhibit 164: Rapid7 Inc. - Product / Service
- Exhibit 165: Rapid7 Inc. - Key offerings
13 Appendix
- 13.1 Scope of the report
- 13.2 Inclusions and exclusions checklist
- Exhibit 166: Inclusions checklist
- Exhibit 167: Exclusions checklist
- 13.3 Currency conversion rates for US$
- Exhibit 168: Currency conversion rates for US$
- 13.4 Research methodology
- Exhibit 169: Research methodology
- Exhibit 170: Validation techniques employed for market sizing
- Exhibit 171: Information sources
- 13.5 List of abbreviations
- Exhibit 172: List of abbreviations
Research Framework
Technavio presents a detailed picture of the market by way of study, synthesis, and summation of data from multiple sources. The analysts have presented the various facets of the market with a particular focus on identifying the key industry influencers. The data thus presented is comprehensive, reliable, and the result of extensive research, both primary and secondary.
INFORMATION SOURCES
Primary sources
- Manufacturers and suppliers
- Channel partners
- Industry experts
- Strategic decision makers
Secondary sources
- Industry journals and periodicals
- Government data
- Financial reports of key industry players
- Historical data
- Press releases
DATA ANALYSIS
Data Synthesis
- Collation of data
- Estimation of key figures
- Analysis of derived insights
Data Validation
- Triangulation with data models
- Reference against proprietary databases
- Corroboration with industry experts
REPORT WRITING
Qualitative
- Market drivers
- Market challenges
- Market trends
- Five forces analysis
Quantitative
- Market size and forecast
- Market segmentation
- Geographical insights
- Competitive landscape
PURCHASE FULL REPORT OF
application security market market
Key Questions Answered
- What are the key global market and the regional market share?
- What are the revenue-generating key market segments?
- What are the key factors driving and challenging this market’s growth?
- Who are the key market vendors and their growth strategies?
- What are the latest trends influencing the growth of this market?
- What are the variables influencing the market growth in the primary regions?
- What are the factors influencing the growth of the parent market?
Why should you prefer Technavio's market insights report?
- Off-the-shelf research reports
- Reports can be tailored to meet the customer's needs
- Trusted by more than 100 fortune 500 organizations
- Information about the market's key drivers, trends, and challenges
- Parent market analysis
- Every week, 50,000 people visit our subscription platform
- Detailed vendors report with competitive landscape
- Covid-19 impact and recovery analysis
- Data on revenue-generating market segments
- Details on the market shares of various regions
- Five-force market analysis