Area Rugs Market by Product, Application, Distribution Channel, and Geography - Forecast and Analysis 2023-2027
| Published: Dec 2022 | Pages: 173 | SKU: IRTNTR43091 |
Area Rugs Market Forecast 2023-2027
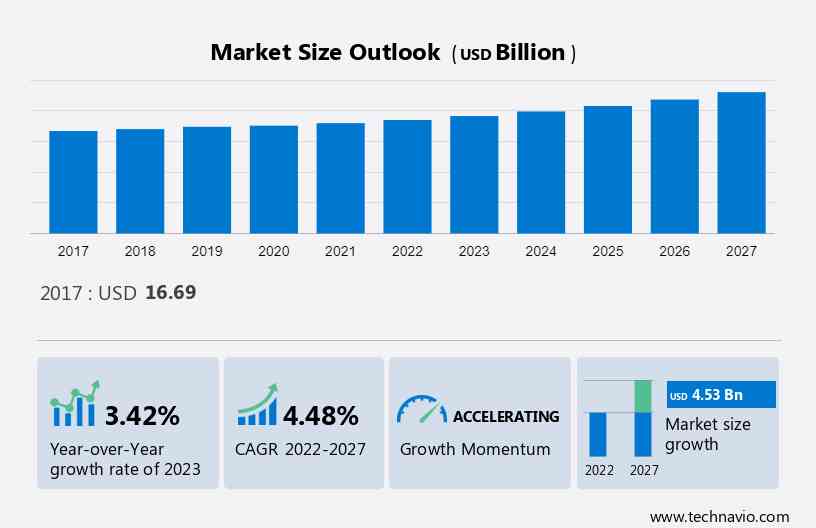
The area rugs market is estimated to increase by USD 4.53 billion and to grow at a CAGR of 4.48% between 2022 and 2027. The growth of the market depends on several factors, including the consumer shift toward interior design, the growing demand for high-end luxury, and the growing popularity of omnichannel retailing.
It also includes an in-depth analysis of drivers, trends, and challenges. Furthermore, the report includes historic market data from 2017 to 2021.
What will be the Size of the Area Rugs Market During the Forecast Period?
To learn more about this report, Download Report Sample
Key Drivers, Trends, Challenges, and Customer Landscape
The consumer shift toward interior design is notably driving the market growth, although factors such as the high cost of raw materials may impede the market growth. Our researchers analyzed the data with 2022 as the base year, along with the key drivers, trends, and challenges. A holistic analysis of drivers will help companies refine their marketing strategies to gain a competitive advantage.
Key Market Driver
The consumer shift toward interior design is notably driving the market. Consumers around the world have become more conscious about interior design and are willing to invest both time and money in the best possible way to decorate their homes. This includes spending on uniquely designed home furnishings such as carpets, curtains, cushions, bedding, and other floor coverings that add to the aesthetic appeal.
A few of the reasons behind the increasing consumer interest in home decoration are rising consumer incomes, changing lifestyles, increased media coverage, and the adoption of different cultures. In addition, the increasing number of working women and their increased participation in making decisions about home decoration also drive market. These factors have led consumers to spend more money on various designed and luxurious carpets, leading to market during the forecast period.
Significant Market Trend
Organized retailing is an emerging trend shaping the market. The high penetration of organized retail in many developing countries is one of the biggest future trends in the market. As a result, the availability of different types of carpets has increased. The rapidly developing global retail industry, especially in developing countries, is witnessing the emergence of many retail stores such as supermarkets, hypermarkets, and specialty stores.
Large organized retail stores have more brands and different types of carpets under one roof, which gives consumers more choices. As consumer brand awareness has grown, so has the importance of organized retailers that carry branded carpets and other home furnishing products. The expansion of organized retail allows consumers to search for information about different brands, and compare prices, quality, and design . Thus, the growth of organized retail will positively influence the market during the forecast period.
Major Market Challenge
The high cost of raw materials is a major challenge impeding the market. The price of raw materials is a key factor in determining the production costs of surface rugs. An increase in the price of high-quality raw materials can increase the total cost of manufacturing carpets. This additional cost is usually passed on to consumers in the form of higher prices for carpets, which can limit purchases.
Recent increases in raw material prices and raw material shortages may have negatively affected the global carpet market. Furthermore, China's expanded carpet production capacity has created a global shortage of raw materials. As a result, the market was hit by repeated and sharp price increases for raw materials, especially flax, wool, silk, jute, and cotton. Thus, the high cost of raw materials poses a major challenge to the global market.
Key Market Customer Landscape
The market report includes the adoption lifecycle of the market, covering from the innovator’s stage to the laggard’s stage. It focuses on adoption rates in different regions based on penetration. Furthermore, the report also includes key purchase criteria and drivers of price sensitivity to help companies evaluate and develop their growth strategies.
Global Market Customer Landscape
Who are the Major Area Rugs Market Companies?
Companies are implementing various strategies, such as strategic alliances, partnerships, mergers and acquisitions, geographical expansion, and product/service launches, to enhance their presence in the market.
Capel Inc. - The key offerings of the company include area rugs.
The report also includes detailed analyses of the competitive landscape of the market and information about 15 market companies, including:
- Balta Group NV
- Berkshire Hathaway Inc.
- Dixie Group Inc
- Harounian Rugs International
- Kalaty Rug Corp.
- Loloi Inc.
- Milliken & Co.
- Mohawk Industries Inc.
- Amara Rugs
- Antep Rugs Inc.
- BRINTONS AGNELLA Ltd.
- Momeni Inc.
- Nourison
- Safavieh LLC
- STEPEVI Group
Qualitative and quantitative analysis of companies has been conducted to help clients understand the wider business environment as well as the strengths and weaknesses of key market players. Data is qualitatively analyzed to categorize companies as pure play, category-focused, industry-focused, and diversified; it is quantitatively analyzed to categorize companies as dominant, leading, strong, tentative, and weak.
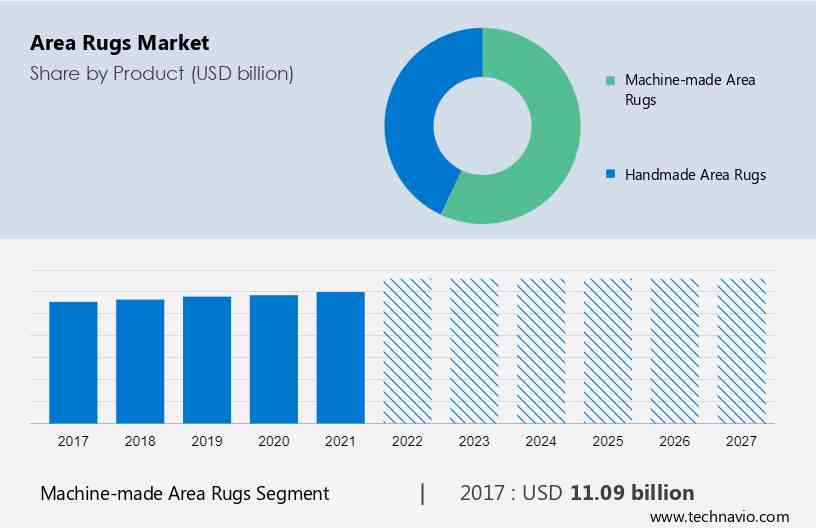
What is the Fastest-Growing Segment in the Market?
The market share growth by the machine-made area rugs segment will be significant during the forecast period. These are made from wool as well as man-made fibers like nylon, polyester, polypropylene, olefin, or other suitable yarns.
Get a glance at the market contribution of various segments Request a PDF Sample
The machine-made area rugs segment USD 11.09 billion in 2017 and continued to grow until 2021. These can be made in less time compared to handmade ones and are available at a lower price than handmade ones. They usually have a shorter life span and lower resale value than handmade. The global market is expected to experience steady year-on-year growth during the forecast period. The main factors contributing to the steady growth are the growing urban population, an increase in the number of nuclear families, and the rapidly growing housing industry with an interest in interior decoration. Therefore, the segment will witness growth during the forecast period.
Which are the Key Regions for the Market?
For more insights on the market share of various regions Request PDF Sample now!
North America is estimated to contribute 37% to the growth of the global market during the forecast period. Technavio’s analysts have elaborately explained the regional trends and drivers that shape the market during the forecast period.
In terms of the sales, North America dominates the global market. The major reasons for the growth of the market in this region are the increase in per capita income, the growing number of residential and commercial construction projects, and the increasing adoption of carpet tiles in commercial spaces.
The construction sector in North America has been growing at a high rate since 2018. The number of offices, educational institutions, healthcare facilities, and public buildings in the region is growing at a steady rate. On the other hand, hotels and retail spaces are also expected to record a high rate during the forecast period. Therefore, the demand will increase during the forecast period.
Segment Overview
The report forecasts market growth by revenue at global, regional & country levels and provides an analysis of the latest trends and growth opportunities from 2017 to 2027.
- Product Outlook (USD Billion, 2017 - 2027)
- Machine-made area rugs
- Handmade area rugs
- Application Outlook (USD Billion, 2017 - 2027)
- Residential
- Commercial
- Distribution Channel Outlook (USD Billion, 2017 - 2027)
- Offline
- Online
- Region Outlook (USD Billion, 2017 - 2027)
- North America
- The U.S.
- Canada
- Europe
- The U.K.
- Germany
- France
- Rest of Europe
- APAC
- China
- India
- Middle East & Africa
- Saudi Arabia
- South Africa
- Rest of the Middle East & Africa
- South America
- Chile
- Brazil
- Argentina
- North America
Market Analyst Overview
The Market offers a wide range of options, including furniture such as sofas, TV stands, and tables, along with various types of rugs such as needlepoint, cut & loop, cut pile, and loop pile rugs. These rugs, including oriental rugs, kilim rugs, and floor cloths, are made from materials like cotton fabrics, offering a variety of textures and designs.
These are delicate, spoilable, and damageable, making them essential in anchoring a room's decor. They serve as a growth driver for the market, catering to various needs from food to medical and lifestyle products. The market's supply chain has faced challenges due to lockdown scenarios, labor shortages, and restrictions, impacting the economy's growth. However, the positioning of brands, customer preferences for luxury and unique looks, and the utilization of smart area rugs offer growth opportunities. Hand-made and machine-made rugs provide a unique aesthetic look, with global brands leading the market through strategic steps and future projections based on analytical depiction, current trends, and future estimations. The market's growth scenario, investment pockets, and competitive intensity are influenced by Porter's five forces analysis, highlighting the potency of buyers and suppliers in driving market trends over the next few years.
|
Area Rugs Market Scope |
|
|
Report Coverage |
Details |
|
Page number |
173 |
|
Base year |
2022 |
|
Historic period |
2017-2021 |
|
Forecast period |
2023-2027 |
|
Growth momentum & CAGR |
Accelerate at a CAGR of 4.48% |
|
Market growth 2023-2027 |
USD 4.53 billion |
|
Market structure |
Fragmented |
|
YoY growth 2022-2023(%) |
3.42 |
|
Regional analysis |
North America, APAC, Europe, South America, and Middle East and Africa |
|
Performing market contribution |
North America at 37% |
|
Key countries |
US, China, India, UK, and Germany |
|
Competitive landscape |
Leading companies, Market Positioning of companies, Competitive Strategies, and Industry Risks |
|
Key companies profiled |
Balta Group NV, Berkshire Hathaway Inc., Capel Inc., Dixie Group Inc, Harounian Rugs International, Kalaty Rug Corp., Loloi Inc., Milliken & Co., Mohawk Industries Inc., Amara Rugs, Antep Rugs Inc., BRINTONS AGNELLA Ltd., Momeni Inc., Nourison, Safavieh LLC, STEPEVI Group, The Natural Carpet Co., United Weavers Inc., and Oriental Weavers Group |
|
Market dynamics |
Parent market analysis, Market Forecasting, Market growth inducers and obstacles, Fast-growing and slow-growing segment analysis, COVID-19 impact and recovery analysis and future consumer dynamics, and Market condition analysis for the forecast period. |
|
Customization purview |
If our market research report has not included the data that you are looking for, you can reach out to our analysts and get segments customized. |
What are the Key Data Covered in this Market Report?
- CAGR of the market during the forecast period
- Detailed information on factors that will drive the market growth and forecasting of the market between 2023 and 2027
- Precise estimation of the size of the market size and its contribution to the parent market
- Accurate predictions about upcoming market trends and analysis and changes in consumer behavior
- Growth of the market industry across Europe, North America, APAC, South America, and Middle East and Africa
- Thorough market growth analysis of the market’s competitive landscape and detailed information about companies
- Comprehensive market analysis and report on the factors that will challenge the market research and growth of market companies
We can help! Our analysts can customize this report to meet your requirements. Get in touch
1 Executive Summary
- 1.1 Market overview
- Exhibit 01: Executive Summary – Chart on Market Overview
- Exhibit 02: Executive Summary – Data Table on Market Overview
- Exhibit 03: Executive Summary – Chart on Global Market Characteristics
- Exhibit 04: Executive Summary – Chart on Market by Geography
- Exhibit 05: Executive Summary – Chart on Market Segmentation by Product
- Exhibit 06: Executive Summary – Chart on Market Segmentation by Application
- Exhibit 07: Executive Summary – Chart on Market Segmentation by Distribution Channel
- Exhibit 08: Executive Summary – Chart on Incremental Growth
- Exhibit 09: Executive Summary – Data Table on Incremental Growth
- Exhibit 10: Executive Summary – Chart on Vendor Market Positioning
2 Market Landscape
- 2.1 Market ecosystem
- Exhibit 11: Parent market
- Exhibit 12: Market Characteristics
3 Market Sizing
- 3.1 Market definition
- Exhibit 13: Offerings of vendors included in the market definition
- 3.2 Market segment analysis
- Exhibit 14: Market segments
- 3.3 Market size 2022
- 3.4 Market outlook: Forecast for 2022-2027
- Exhibit 15: Chart on Global - Market size and forecast 2022-2027 ($ billion)
- Exhibit 16: Data Table on Global - Market size and forecast 2022-2027 ($ billion)
- Exhibit 17: Chart on Global Market: Year-over-year growth 2022-2027 (%)
- Exhibit 18: Data Table on Global Market: Year-over-year growth 2022-2027 (%)
4 Historic Market Size
- 4.1 Global area rugs market 2017 - 2021
- Exhibit 19: Historic Market Size – Data Table on Global area rugs market 2017 - 2021 ($ billion)
- 4.2 Product Segment Analysis 2017 - 2021
- Exhibit 20: Historic Market Size – Product Segment 2017 - 2021 ($ billion)
- 4.3 Application Segment Analysis 2017 - 2021
- Exhibit 21: Historic Market Size – Application Segment 2017 - 2021 ($ billion)
- 4.4 Distribution channel Segment Analysis 2017 - 2021
- Exhibit 22: Historic Market Size – Distribution channel Segment 2017 - 2021 ($ billion)
- 4.5 Geography Segment Analysis 2017 - 2021
- Exhibit 23: Historic Market Size – Geography Segment 2017 - 2021 ($ billion)
- 4.6 Country Segment Analysis 2017 - 2021
- Exhibit 24: Historic Market Size – Country Segment 2017 - 2021 ($ billion)
5 Five Forces Analysis
- 5.1 Five forces summary
- Exhibit 25: Five forces analysis - Comparison between 2022 and 2027
- 5.2 Bargaining power of buyers
- Exhibit 26: Chart on Bargaining power of buyers – Impact of key factors 2022 and 2027
- 5.3 Bargaining power of suppliers
- Exhibit 27: Bargaining power of suppliers – Impact of key factors in 2022 and 2027
- 5.4 Threat of new entrants
- Exhibit 28: Threat of new entrants – Impact of key factors in 2022 and 2027
- 5.5 Threat of substitutes
- Exhibit 29: Threat of substitutes – Impact of key factors in 2022 and 2027
- 5.6 Threat of rivalry
- Exhibit 30: Threat of rivalry – Impact of key factors in 2022 and 2027
- 5.7 Market condition
- Exhibit 31: Chart on Market condition - Five forces 2022 and 2027
6 Market Segmentation by Product
- 6.1 Market segments
- Exhibit 32: Chart on Product - Market share 2022-2027 (%)
- Exhibit 33: Data Table on Product - Market share 2022-2027 (%)
- 6.2 Comparison by Product
- Exhibit 34: Chart on Comparison by Product
- Exhibit 35: Data Table on Comparison by Product
- 6.3 Machine-made area rugs - Market size and forecast 2022-2027
- Exhibit 36: Chart on Machine-made area rugs - Market size and forecast 2022-2027 ($ billion)
- Exhibit 37: Data Table on Machine-made area rugs - Market size and forecast 2022-2027 ($ billion)
- Exhibit 38: Chart on Machine-made area rugs - Year-over-year growth 2022-2027 (%)
- Exhibit 39: Data Table on Machine-made area rugs - Year-over-year growth 2022-2027 (%)
- 6.4 Handmade area rugs - Market size and forecast 2022-2027
- Exhibit 40: Chart on Handmade area rugs - Market size and forecast 2022-2027 ($ billion)
- Exhibit 41: Data Table on Handmade area rugs - Market size and forecast 2022-2027 ($ billion)
- Exhibit 42: Chart on Handmade area rugs - Year-over-year growth 2022-2027 (%)
- Exhibit 43: Data Table on Handmade area rugs - Year-over-year growth 2022-2027 (%)
- 6.5 Market opportunity by Product
- Exhibit 44: Market opportunity by Product ($ billion)
7 Market Segmentation by Application
- 7.1 Market segments
- Exhibit 45: Chart on Application - Market share 2022-2027 (%)
- Exhibit 46: Data Table on Application - Market share 2022-2027 (%)
- 7.2 Comparison by Application
- Exhibit 47: Chart on Comparison by Application
- Exhibit 48: Data Table on Comparison by Application
- 7.3 Residential - Market size and forecast 2022-2027
- Exhibit 49: Chart on Residential - Market size and forecast 2022-2027 ($ billion)
- Exhibit 50: Data Table on Residential - Market size and forecast 2022-2027 ($ billion)
- Exhibit 51: Chart on Residential - Year-over-year growth 2022-2027 (%)
- Exhibit 52: Data Table on Residential - Year-over-year growth 2022-2027 (%)
- 7.4 Commercial - Market size and forecast 2022-2027
- Exhibit 53: Chart on Commercial - Market size and forecast 2022-2027 ($ billion)
- Exhibit 54: Data Table on Commercial - Market size and forecast 2022-2027 ($ billion)
- Exhibit 55: Chart on Commercial - Year-over-year growth 2022-2027 (%)
- Exhibit 56: Data Table on Commercial - Year-over-year growth 2022-2027 (%)
- 7.5 Market opportunity by Application
- Exhibit 57: Market opportunity by Application ($ billion)
8 Market Segmentation by Distribution Channel
- 8.1 Market segments
- Exhibit 58: Chart on Distribution Channel - Market share 2022-2027 (%)
- Exhibit 59: Data Table on Distribution Channel - Market share 2022-2027 (%)
- 8.2 Comparison by Distribution Channel
- Exhibit 60: Chart on Comparison by Distribution Channel
- Exhibit 61: Data Table on Comparison by Distribution Channel
- 8.3 Offline - Market size and forecast 2022-2027
- Exhibit 62: Chart on Offline - Market size and forecast 2022-2027 ($ billion)
- Exhibit 63: Data Table on Offline - Market size and forecast 2022-2027 ($ billion)
- Exhibit 64: Chart on Offline - Year-over-year growth 2022-2027 (%)
- Exhibit 65: Data Table on Offline - Year-over-year growth 2022-2027 (%)
- 8.4 Online - Market size and forecast 2022-2027
- Exhibit 66: Chart on Online - Market size and forecast 2022-2027 ($ billion)
- Exhibit 67: Data Table on Online - Market size and forecast 2022-2027 ($ billion)
- Exhibit 68: Chart on Online - Year-over-year growth 2022-2027 (%)
- Exhibit 69: Data Table on Online - Year-over-year growth 2022-2027 (%)
- 8.5 Market opportunity by Distribution Channel
- Exhibit 70: Market opportunity by Distribution Channel ($ billion)
9 Customer Landscape
- 9.1 Customer landscape overview
- Exhibit 71: Analysis of price sensitivity, lifecycle, customer purchase basket, adoption rates, and purchase criteria
10 Geographic Landscape
- 10.1 Geographic segmentation
- Exhibit 72: Chart on Market share by geography 2022-2027 (%)
- Exhibit 73: Data Table on Market share by geography 2022-2027 (%)
- 10.2 Geographic comparison
- Exhibit 74: Chart on Geographic comparison
- Exhibit 75: Data Table on Geographic comparison
- 10.3 North America - Market size and forecast 2022-2027
- Exhibit 76: Chart on North America - Market size and forecast 2022-2027 ($ billion)
- Exhibit 77: Data Table on North America - Market size and forecast 2022-2027 ($ billion)
- Exhibit 78: Chart on North America - Year-over-year growth 2022-2027 (%)
- Exhibit 79: Data Table on North America - Year-over-year growth 2022-2027 (%)
- 10.4 APAC - Market size and forecast 2022-2027
- Exhibit 80: Chart on APAC - Market size and forecast 2022-2027 ($ billion)
- Exhibit 81: Data Table on APAC - Market size and forecast 2022-2027 ($ billion)
- Exhibit 82: Chart on APAC - Year-over-year growth 2022-2027 (%)
- Exhibit 83: Data Table on APAC - Year-over-year growth 2022-2027 (%)
- 10.5 Europe - Market size and forecast 2022-2027
- Exhibit 84: Chart on Europe - Market size and forecast 2022-2027 ($ billion)
- Exhibit 85: Data Table on Europe - Market size and forecast 2022-2027 ($ billion)
- Exhibit 86: Chart on Europe - Year-over-year growth 2022-2027 (%)
- Exhibit 87: Data Table on Europe - Year-over-year growth 2022-2027 (%)
- 10.6 South America - Market size and forecast 2022-2027
- Exhibit 88: Chart on South America - Market size and forecast 2022-2027 ($ billion)
- Exhibit 89: Data Table on South America - Market size and forecast 2022-2027 ($ billion)
- Exhibit 90: Chart on South America - Year-over-year growth 2022-2027 (%)
- Exhibit 91: Data Table on South America - Year-over-year growth 2022-2027 (%)
- 10.7 Middle East and Africa - Market size and forecast 2022-2027
- Exhibit 92: Chart on Middle East and Africa - Market size and forecast 2022-2027 ($ billion)
- Exhibit 93: Data Table on Middle East and Africa - Market size and forecast 2022-2027 ($ billion)
- Exhibit 94: Chart on Middle East and Africa - Year-over-year growth 2022-2027 (%)
- Exhibit 95: Data Table on Middle East and Africa - Year-over-year growth 2022-2027 (%)
- 10.8 US - Market size and forecast 2022-2027
- Exhibit 96: Chart on US - Market size and forecast 2022-2027 ($ billion)
- Exhibit 97: Data Table on US - Market size and forecast 2022-2027 ($ billion)
- Exhibit 98: Chart on US - Year-over-year growth 2022-2027 (%)
- Exhibit 99: Data Table on US - Year-over-year growth 2022-2027 (%)
- 10.9 China - Market size and forecast 2022-2027
- Exhibit 100: Chart on China - Market size and forecast 2022-2027 ($ billion)
- Exhibit 101: Data Table on China - Market size and forecast 2022-2027 ($ billion)
- Exhibit 102: Chart on China - Year-over-year growth 2022-2027 (%)
- Exhibit 103: Data Table on China - Year-over-year growth 2022-2027 (%)
- 10.10 UK - Market size and forecast 2022-2027
- Exhibit 104: Chart on UK - Market size and forecast 2022-2027 ($ billion)
- Exhibit 105: Data Table on UK - Market size and forecast 2022-2027 ($ billion)
- Exhibit 106: Chart on UK - Year-over-year growth 2022-2027 (%)
- Exhibit 107: Data Table on UK - Year-over-year growth 2022-2027 (%)
- 10.11 Germany - Market size and forecast 2022-2027
- Exhibit 108: Chart on Germany - Market size and forecast 2022-2027 ($ billion)
- Exhibit 109: Data Table on Germany - Market size and forecast 2022-2027 ($ billion)
- Exhibit 110: Chart on Germany - Year-over-year growth 2022-2027 (%)
- Exhibit 111: Data Table on Germany - Year-over-year growth 2022-2027 (%)
- 10.12 India - Market size and forecast 2022-2027
- Exhibit 112: Chart on India - Market size and forecast 2022-2027 ($ billion)
- Exhibit 113: Data Table on India - Market size and forecast 2022-2027 ($ billion)
- Exhibit 114: Chart on India - Year-over-year growth 2022-2027 (%)
- Exhibit 115: Data Table on India - Year-over-year growth 2022-2027 (%)
- 10.13 Market opportunity by geography
- Exhibit 116: Market opportunity by geography ($ billion)
11 Drivers, Challenges, and Trends
- 11.1 Market drivers
- 11.2 Market challenges
- 11.3 Impact of drivers and challenges
- Exhibit 117: Impact of drivers and challenges in 2022 and 2027
- 11.4 Market trends
12 Vendor Landscape
- 12.1 Overview
- 12.2 Vendor landscape
- Exhibit 118: Overview on Criticality of inputs and Factors of differentiation
- 12.3 Landscape disruption
- Exhibit 119: Overview on factors of disruption
- 12.4 Industry risks
- Exhibit 120: Impact of key risks on business
13 Vendor Analysis
- 13.1 Vendors covered
- Exhibit 121: Vendors covered
- 13.2 Market positioning of vendors
- Exhibit 122: Matrix on vendor position and classification
- 13.3 Balta Group NV
- Exhibit 123: Balta Group NV - Overview
- Exhibit 124: Balta Group NV - Business segments
- Exhibit 125: Balta Group NV - Key offerings
- Exhibit 126: Balta Group NV - Segment focus
- 13.4 Berkshire Hathaway Inc.
- Exhibit 127: Berkshire Hathaway Inc. - Overview
- Exhibit 128: Berkshire Hathaway Inc. - Business segments
- Exhibit 129: Berkshire Hathaway Inc. - Key news
- Exhibit 130: Berkshire Hathaway Inc. - Key offerings
- Exhibit 131: Berkshire Hathaway Inc. - Segment focus
- 13.5 BRINTONS AGNELLA Ltd.
- Exhibit 132: BRINTONS AGNELLA Ltd. - Overview
- Exhibit 133: BRINTONS AGNELLA Ltd. - Product / Service
- Exhibit 134: BRINTONS AGNELLA Ltd. - Key offerings
- 13.6 Capel Inc.
- Exhibit 135: Capel Inc. - Overview
- Exhibit 136: Capel Inc. - Product / Service
- Exhibit 137: Capel Inc. - Key offerings
- 13.7 Dixie Group Inc
- Exhibit 138: Dixie Group Inc - Overview
- Exhibit 139: Dixie Group Inc - Product / Service
- Exhibit 140: Dixie Group Inc - Key offerings
- 13.8 Harounian Rugs International
- Exhibit 141: Harounian Rugs International - Overview
- Exhibit 142: Harounian Rugs International - Product / Service
- Exhibit 143: Harounian Rugs International - Key offerings
- 13.9 Kalaty Rug Corp.
- Exhibit 144: Kalaty Rug Corp. - Overview
- Exhibit 145: Kalaty Rug Corp. - Product / Service
- Exhibit 146: Kalaty Rug Corp. - Key offerings
- 13.10 Loloi Inc.
- Exhibit 147: Loloi Inc. - Overview
- Exhibit 148: Loloi Inc. - Product / Service
- Exhibit 149: Loloi Inc. - Key offerings
- 13.11 Milliken and Co.
- Exhibit 150: Milliken and Co. - Overview
- Exhibit 151: Milliken and Co. - Product / Service
- Exhibit 152: Milliken and Co. - Key news
- Exhibit 153: Milliken and Co. - Key offerings
- 13.12 Mohawk Industries Inc.
- Exhibit 154: Mohawk Industries Inc. - Overview
- Exhibit 155: Mohawk Industries Inc. - Business segments
- Exhibit 156: Mohawk Industries Inc. - Key offerings
- Exhibit 157: Mohawk Industries Inc. - Segment focus
- 13.13 Momeni Inc.
- Exhibit 158: Momeni Inc. - Overview
- Exhibit 159: Momeni Inc. - Product / Service
- Exhibit 160: Momeni Inc. - Key offerings
- 13.14 Nourison
- Exhibit 161: Nourison - Overview
- Exhibit 162: Nourison - Product / Service
- Exhibit 163: Nourison - Key offerings
- 13.15 Oriental Weavers Group
- Exhibit 164: Oriental Weavers Group - Overview
- Exhibit 165: Oriental Weavers Group - Business segments
- Exhibit 166: Oriental Weavers Group - Key offerings
- Exhibit 167: Oriental Weavers Group - Segment focus
- 13.16 Safavieh LLC
- Exhibit 168: Safavieh LLC - Overview
- Exhibit 169: Safavieh LLC - Product / Service
- Exhibit 170: Safavieh LLC - Key offerings
- 13.17 STEPEVI Group
- Exhibit 171: STEPEVI Group - Overview
- Exhibit 172: STEPEVI Group - Product / Service
- Exhibit 173: STEPEVI Group - Key offerings
14 Appendix
- 14.1 Scope of the report
- 14.2 Inclusions and exclusions checklist
- Exhibit 174: Inclusions checklist
- Exhibit 175: Exclusions checklist
- 14.3 Currency conversion rates for US$
- Exhibit 176: Currency conversion rates for US$
- 14.4 Research methodology
- Exhibit 177: Research methodology
- Exhibit 178: Validation techniques employed for market sizing
- Exhibit 179: Information sources
- 14.5 List of abbreviations
- Exhibit 180: List of abbreviations
Research Framework
Technavio presents a detailed picture of the market by way of study, synthesis, and summation of data from multiple sources. The analysts have presented the various facets of the market with a particular focus on identifying the key industry influencers. The data thus presented is comprehensive, reliable, and the result of extensive research, both primary and secondary.
INFORMATION SOURCES
Primary sources
- Manufacturers and suppliers
- Channel partners
- Industry experts
- Strategic decision makers
Secondary sources
- Industry journals and periodicals
- Government data
- Financial reports of key industry players
- Historical data
- Press releases
DATA ANALYSIS
Data Synthesis
- Collation of data
- Estimation of key figures
- Analysis of derived insights
Data Validation
- Triangulation with data models
- Reference against proprietary databases
- Corroboration with industry experts
REPORT WRITING
Qualitative
- Market drivers
- Market challenges
- Market trends
- Five forces analysis
Quantitative
- Market size and forecast
- Market segmentation
- Geographical insights
- Competitive landscape
PURCHASE FULL REPORT OF
area rugs market
Key Questions Answered
- What are the key global market and the regional market share?
- What are the revenue-generating key market segments?
- What are the key factors driving and challenging this market’s growth?
- Who are the key market vendors and their growth strategies?
- What are the latest trends influencing the growth of this market?
- What are the variables influencing the market growth in the primary regions?
- What are the factors influencing the growth of the parent market?
Why should you prefer Technavio's market insights report?
- Off-the-shelf research reports
- Reports can be tailored to meet the customer's needs
- Trusted by more than 100 fortune 500 organizations
- Information about the market's key drivers, trends, and challenges
- Parent market analysis
- Every week, 50,000 people visit our subscription platform
- Detailed vendors report with competitive landscape
- Covid-19 impact and recovery analysis
- Data on revenue-generating market segments
- Details on the market shares of various regions
- Five-force market analysis