Automotive Ethernet Market Analysis - APAC, North America, Europe, South America, Middle East and Africa - US, China, Japan, India, Germany - Size and Forecast 2023-2027
| Published: Feb 2023 | Pages: 173 | SKU: IRTNTR72351 |
Automotive Ethernet Market by Application, Vehicle Type, and Geography - Forecast 2023-2027
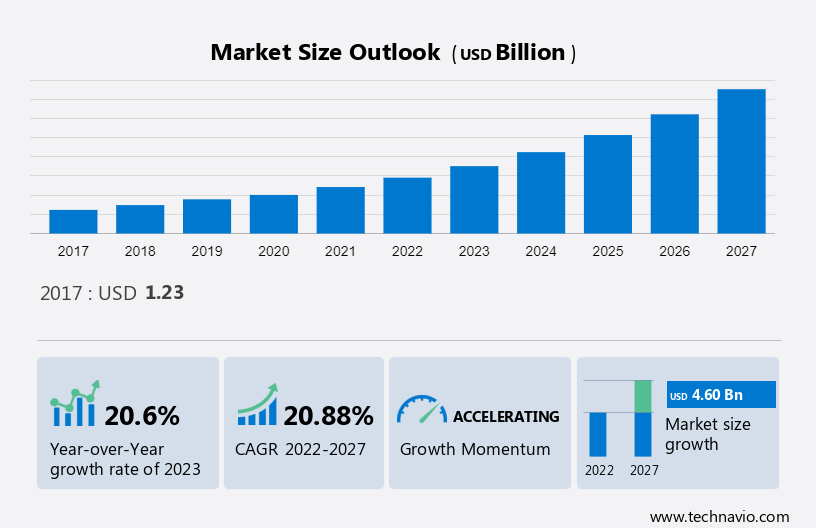
The automotive ethernet market size is forecast to increase by USD 4.60 billion between 2022 and 2027, accelerating at a CAGR of 20.88%. In 2017, China held the largest market share, projecting an annual revenue of USD 0.36 billion. The report offers extensive research analysis on the Automotive Ethernet Market, with a categorization based on Application, including Cameras and ADAS, Infotainment, Diagnostics, and Network backbone. It further segments the market by Vehicle Type, encompassing passenger cars and commercial vehicles. Additionally, the report provides geographical segmentation, covering APAC, North America, Europe, South America, and Middle East and Africa.
What will be the Size of the Automotive Ethernet Market During the Forecast Period?
To learn more about this report, Download Report Sample
Automotive Ethernet Market Analysis
The increasing demand for high bandwidth and lightweight materials is notably driving market growth. Modern-day vehicles have an array of sensors installed in them. This has led to the development of more complex safety systems. All modules and systems are interconnected and communicate with the electronic control unit (ECU). As a result, traditional wiring harnesses and connectors are unable to support the bandwidth requirements owing to high-speed data transmission. To meet the bandwidth requirements, OEMs have been using shielded coaxial cables that provide higher bandwidth than unshielded cables. However, the shielding of cables has increased the cost of the vehicle and has also increased the weight of the vehicle. This has forced OEMs to invest in the development of networking technologies that employ lightweight materials at low costs and higher bandwidth limits.
BroadR-Reach ethernet technology uses a single twisted pair of unshielded copper wires to overcome electromagnetic interference (EMI) issues. This will result in a cost reduction of approximately 80% and a weight reduction of 20% as compared with popular technologies such as LVDS. In addition, once the ethernet industry witnesses widespread adoption, the cost of materials will further reduce owing to increased competition and economies of scale operations during the forecast period.
Automotive Ethernet Market Segment Trends
Passenger Cars is Dominating the Segment
The passenger cars segment was valued at USD 969.60 million in 2017 and continued to grow until 2021. The passenger car segment dominates the global automotive ethernet market. Automakers are focusing on increasing the safety level of passenger cars and are adopting advanced safety functions that need secure communications. Hence, the demand for automotive ethernet is increasing at a rapid rate during the forecast period.
The market share growth of the passenger cars segment will be significant during the forecast period. Passenger vehicles witnessed rapid electrification of mechanical components with the introduction of advanced features in safety, security, propulsion, connectivity, and environment. This resulted in an increased number of electronic control units (ECUs) in passenger vehicles (60-80 ECUs). As a result, automotive ethernet became crucial to handle data communication among ECUs. Thus, the segment is expected to grow in the future simultaneously, and the global automotive ethernet market will grow during the forecast period.
Automotive Ethernet Market - Revenue Share by Vehicle Type Segment, 2017 - 2027.
For more details on other segments, Download Sample Report
APAC Holds a Prominent Position in the Automotive Ethernet Market
APAC is estimated to contribute 44% to the growth of the global market during the forecast period. The automotive ethernet in APAC will be driven by the increasing adoption of advanced driver-assistance systems (ADASs) in vehicles during the forecast period. China will be the frontrunner in the adoption of ADAS systems in APAC during the forecast period.
The rise in penetration of connected technologies and ADAS across all vehicle segments is a positive indication of the country's favorable positioning for the uptake of level 2 and 3 autonomous features in automobiles. Although the US is the first country to deploy fully autonomous vehicles, China leads the deployment of technology in volume. Therefore, though the country's current economic conditions directly impact the revenue of OEMs, China positive expression on the uptake of new technologies makes the region commercially attractive for several large multinationals.
Automotive Ethernet Market Size, By Region, Global, 2017 - 2027.
To understand geographic trends Download Report Sample
Automotive Ethernet Market Companies Overview
The Automotive Ethernet Market is fragmented in nature. Some significant players include ACTIA PCS, Amphenol Communications Solutions, Broadcom Inc., Cadence Design Systems Inc., DASAN Networks Inc.
The research report also includes detailed analyses of the competitive landscape of the market and information about 15 market companies, including:
Infineon Technologies AG, Intrepid Control Systems Inc., Keysight Technologies Inc., Marvell Technology Inc., Microchip Technology Inc., Mouser Electronics Inc., NEXCOM International Co. Ltd., NXP Semiconductors NV, Realtek Semiconductor Corp., Rohde and Schwarz GmbH and Co. KG, Spirent Communications Plc, System on Chip Engineering S.L., TE Connectivity Ltd., Tektronix Inc., and Texas Instruments Inc.
Segment Overview
The automotive ethernet market report forecasts market growth by revenue at global, regional & country levels and provides an analysis of the latest trends and growth opportunities from 2017 - 2027.
- Vehicle Type Outlook
- Passenger cars
- Commercial vehicles
- Application Outlook
- Cameras and ADAS
- Infotainment
- Diagnostics
- Network backbone
- Region Outlook
- APAC
- China
- India
- North America
- The U.S.
- Canada
- Europe
- The U.K.
- Germany
- France
- Rest of Europe
- South America
- Brazil
- Argentina
- Middle East & Africa
- Saudi Arabia
- South Africa
- Rest of the Middle East & Africa
- APAC
|
Automotive Ethernet Market Scope |
|
|
Report Coverage |
Details |
|
Page number |
173 |
|
Base year |
2022 |
|
Historic period |
2017 - 2021 |
|
Forecast period |
2023-2027 |
|
Growth momentum & CAGR |
Accelerate at a CAGR of 20.88% |
|
Market growth 2023-2027 |
USD 4.60 billion |
|
Market structure |
Fragmented |
|
YoY growth 2022-2023(%) |
20.6 |
|
Regional analysis |
APAC, North America, Europe, South America, and Middle East and Africa |
|
Performing market contribution |
APAC at 44% |
|
Key countries |
US, China, Japan, India, and Germany |
|
Competitive landscape |
Leading Companies, Market Positioning of Companies, Competitive Strategies, and Industry Risks |
|
Key companies profiled |
ACTIA PCS, Amphenol Communications Solutions, Broadcom Inc., Cadence Design Systems Inc., DASAN Networks Inc., Infineon Technologies AG, Intrepid Control Systems Inc., Keysight Technologies Inc., Marvell Technology Inc., Microchip Technology Inc., Mouser Electronics Inc., NEXCOM International Co. Ltd., NXP Semiconductors NV, Realtek Semiconductor Corp., Rohde and Schwarz GmbH and Co. KG, Spirent Communications Plc, System on Chip Engineering S.L., TE Connectivity Ltd., Tektronix Inc., and Texas Instruments Inc. |
|
Market dynamics |
Parent market analysis, Market growth inducers and obstacles, Fast-growing and slow-growing segment analysis, COVID 19 impact and recovery analysis and future consumer dynamics, Market condition analysis for forecast period |
|
Customization purview |
If our report has not included the data that you are looking for, you can reach out to our analysts and get segments customized. |
What are the Key Data Covered in this Automotive Ethernet Market Research Report?
- CAGR of the market during the forecast period
- Detailed information on factors that will drive the growth of the market between 2023 and 2027
- Precise estimation of the size of the market size and its contribution of the market in focus to the parent market
- Accurate predictions about upcoming trends and changes in consumer behaviour
- Growth of the market industry across APAC, North America, Europe, South America, and Middle East and Africa
- Thorough analysis of the market’s competitive landscape and detailed information about companies
- Comprehensive analysis of factors that will challenge the growth of market companies
We can help! Our analysts can customize this market research report to meet your requirements.
1 Executive Summary
- 1.1 Market overview
- Exhibit 01: Executive Summary – Chart on Market Overview
- Exhibit 02: Executive Summary – Data Table on Market Overview
- Exhibit 03: Executive Summary – Chart on Global Market Characteristics
- Exhibit 04: Executive Summary – Chart on Market by Geography
- Exhibit 05: Executive Summary – Chart on Market Segmentation by Vehicle Type
- Exhibit 06: Executive Summary – Chart on Market Segmentation by Application
- Exhibit 07: Executive Summary – Chart on Incremental Growth
- Exhibit 08: Executive Summary – Data Table on Incremental Growth
- Exhibit 09: Executive Summary – Chart on Vendor Market Positioning
2 Market Landscape
- 2.1 Market ecosystem
- Exhibit 10: Parent market
- Exhibit 11: Market Characteristics
3 Market Sizing
- 3.1 Market definition
- Exhibit 12: Offerings of vendors included in the market definition
- 3.2 Market segment analysis
- Exhibit 13: Market segments
- 3.3 Market size 2022
- 3.4 Market outlook: Forecast for 2022-2027
- Exhibit 14: Chart on Global - Market size and forecast 2022-2027 ($ million)
- Exhibit 15: Data Table on Global - Market size and forecast 2022-2027 ($ million)
- Exhibit 16: Chart on Global Market: Year-over-year growth 2022-2027 (%)
- Exhibit 17: Data Table on Global Market: Year-over-year growth 2022-2027 (%)
4 Historic Market Size
- 4.1 Global automotive ethernet market 2017 - 2021
- Exhibit 18: Historic Market Size – Data Table on Global automotive ethernet market 2017 - 2021 ($ million)
- 4.2 Vehicle Type Segment Analysis 2017 - 2021
- Exhibit 19: Historic Market Size – Vehicle Type Segment 2017 - 2021 ($ million)
- 4.3 Application Segment Analysis 2017 - 2021
- Exhibit 20: Historic Market Size – Application Segment 2017 - 2021 ($ million)
- 4.4 Geography Segment Analysis 2017 - 2021
- Exhibit 21: Historic Market Size – Geography Segment 2017 - 2021 ($ million)
- 4.5 Country Segment Analysis 2017 - 2021
- Exhibit 22: Historic Market Size – Country Segment 2017 - 2021 ($ million)
5 Five Forces Analysis
- 5.1 Five forces summary
- Exhibit 23: Five forces analysis - Comparison between 2022 and 2027
- 5.2 Bargaining power of buyers
- Exhibit 24: Chart on Bargaining power of buyers – Impact of key factors 2022 and 2027
- 5.3 Bargaining power of suppliers
- Exhibit 25: Bargaining power of suppliers – Impact of key factors in 2022 and 2027
- 5.4 Threat of new entrants
- Exhibit 26: Threat of new entrants – Impact of key factors in 2022 and 2027
- 5.5 Threat of substitutes
- Exhibit 27: Threat of substitutes – Impact of key factors in 2022 and 2027
- 5.6 Threat of rivalry
- Exhibit 28: Threat of rivalry – Impact of key factors in 2022 and 2027
- 5.7 Market condition
- Exhibit 29: Chart on Market condition - Five forces 2022 and 2027
6 Market Segmentation by Vehicle Type
- 6.1 Market segments
- Exhibit 30: Chart on Vehicle Type - Market share 2022-2027 (%)
- Exhibit 31: Data Table on Vehicle Type - Market share 2022-2027 (%)
- 6.2 Comparison by Vehicle Type
- Exhibit 32: Chart on Comparison by Vehicle Type
- Exhibit 33: Data Table on Comparison by Vehicle Type
- 6.3 Passenger cars - Market size and forecast 2022-2027
- Exhibit 34: Chart on Passenger cars - Market size and forecast 2022-2027 ($ million)
- Exhibit 35: Data Table on Passenger cars - Market size and forecast 2022-2027 ($ million)
- Exhibit 36: Chart on Passenger cars - Year-over-year growth 2022-2027 (%)
- Exhibit 37: Data Table on Passenger cars - Year-over-year growth 2022-2027 (%)
- 6.4 Commercial vehicles - Market size and forecast 2022-2027
- Exhibit 38: Chart on Commercial vehicles - Market size and forecast 2022-2027 ($ million)
- Exhibit 39: Data Table on Commercial vehicles - Market size and forecast 2022-2027 ($ million)
- Exhibit 40: Chart on Commercial vehicles - Year-over-year growth 2022-2027 (%)
- Exhibit 41: Data Table on Commercial vehicles - Year-over-year growth 2022-2027 (%)
- 6.5 Market opportunity by Vehicle Type
- Exhibit 42: Market opportunity by Vehicle Type ($ million)
7 Market Segmentation by Application
- 7.1 Market segments
- Exhibit 43: Chart on Application - Market share 2022-2027 (%)
- Exhibit 44: Data Table on Application - Market share 2022-2027 (%)
- 7.2 Comparison by Application
- Exhibit 45: Chart on Comparison by Application
- Exhibit 46: Data Table on Comparison by Application
- 7.3 Cameras and ADAS - Market size and forecast 2022-2027
- Exhibit 47: Chart on Cameras and ADAS - Market size and forecast 2022-2027 ($ million)
- Exhibit 48: Data Table on Cameras and ADAS - Market size and forecast 2022-2027 ($ million)
- Exhibit 49: Chart on Cameras and ADAS - Year-over-year growth 2022-2027 (%)
- Exhibit 50: Data Table on Cameras and ADAS - Year-over-year growth 2022-2027 (%)
- 7.4 Infotainment - Market size and forecast 2022-2027
- Exhibit 51: Chart on Infotainment - Market size and forecast 2022-2027 ($ million)
- Exhibit 52: Data Table on Infotainment - Market size and forecast 2022-2027 ($ million)
- Exhibit 53: Chart on Infotainment - Year-over-year growth 2022-2027 (%)
- Exhibit 54: Data Table on Infotainment - Year-over-year growth 2022-2027 (%)
- 7.5 Diagnostics - Market size and forecast 2022-2027
- Exhibit 55: Chart on Diagnostics - Market size and forecast 2022-2027 ($ million)
- Exhibit 56: Data Table on Diagnostics - Market size and forecast 2022-2027 ($ million)
- Exhibit 57: Chart on Diagnostics - Year-over-year growth 2022-2027 (%)
- Exhibit 58: Data Table on Diagnostics - Year-over-year growth 2022-2027 (%)
- 7.6 Network backbone - Market size and forecast 2022-2027
- Exhibit 59: Chart on Network backbone - Market size and forecast 2022-2027 ($ million)
- Exhibit 60: Data Table on Network backbone - Market size and forecast 2022-2027 ($ million)
- Exhibit 61: Chart on Network backbone - Year-over-year growth 2022-2027 (%)
- Exhibit 62: Data Table on Network backbone - Year-over-year growth 2022-2027 (%)
- 7.7 Market opportunity by Application
- Exhibit 63: Market opportunity by Application ($ million)
8 Customer Landscape
- 8.1 Customer landscape overview
- Exhibit 64: Analysis of price sensitivity, lifecycle, customer purchase basket, adoption rates, and purchase criteria
9 Geographic Landscape
- 9.1 Geographic segmentation
- Exhibit 65: Chart on Market share by geography 2022-2027 (%)
- Exhibit 66: Data Table on Market share by geography 2022-2027 (%)
- 9.2 Geographic comparison
- Exhibit 67: Chart on Geographic comparison
- Exhibit 68: Data Table on Geographic comparison
- 9.3 APAC - Market size and forecast 2022-2027
- Exhibit 69: Chart on APAC - Market size and forecast 2022-2027 ($ million)
- Exhibit 70: Data Table on APAC - Market size and forecast 2022-2027 ($ million)
- Exhibit 71: Chart on APAC - Year-over-year growth 2022-2027 (%)
- Exhibit 72: Data Table on APAC - Year-over-year growth 2022-2027 (%)
- 9.4 North America - Market size and forecast 2022-2027
- Exhibit 73: Chart on North America - Market size and forecast 2022-2027 ($ million)
- Exhibit 74: Data Table on North America - Market size and forecast 2022-2027 ($ million)
- Exhibit 75: Chart on North America - Year-over-year growth 2022-2027 (%)
- Exhibit 76: Data Table on North America - Year-over-year growth 2022-2027 (%)
- 9.5 Europe - Market size and forecast 2022-2027
- Exhibit 77: Chart on Europe - Market size and forecast 2022-2027 ($ million)
- Exhibit 78: Data Table on Europe - Market size and forecast 2022-2027 ($ million)
- Exhibit 79: Chart on Europe - Year-over-year growth 2022-2027 (%)
- Exhibit 80: Data Table on Europe - Year-over-year growth 2022-2027 (%)
- 9.6 South America - Market size and forecast 2022-2027
- Exhibit 81: Chart on South America - Market size and forecast 2022-2027 ($ million)
- Exhibit 82: Data Table on South America - Market size and forecast 2022-2027 ($ million)
- Exhibit 83: Chart on South America - Year-over-year growth 2022-2027 (%)
- Exhibit 84: Data Table on South America - Year-over-year growth 2022-2027 (%)
- 9.7 Middle East and Africa - Market size and forecast 2022-2027
- Exhibit 85: Chart on Middle East and Africa - Market size and forecast 2022-2027 ($ million)
- Exhibit 86: Data Table on Middle East and Africa - Market size and forecast 2022-2027 ($ million)
- Exhibit 87: Chart on Middle East and Africa - Year-over-year growth 2022-2027 (%)
- Exhibit 88: Data Table on Middle East and Africa - Year-over-year growth 2022-2027 (%)
- 9.8 China - Market size and forecast 2022-2027
- Exhibit 89: Chart on China - Market size and forecast 2022-2027 ($ million)
- Exhibit 90: Data Table on China - Market size and forecast 2022-2027 ($ million)
- Exhibit 91: Chart on China - Year-over-year growth 2022-2027 (%)
- Exhibit 92: Data Table on China - Year-over-year growth 2022-2027 (%)
- 9.9 US - Market size and forecast 2022-2027
- Exhibit 93: Chart on US - Market size and forecast 2022-2027 ($ million)
- Exhibit 94: Data Table on US - Market size and forecast 2022-2027 ($ million)
- Exhibit 95: Chart on US - Year-over-year growth 2022-2027 (%)
- Exhibit 96: Data Table on US - Year-over-year growth 2022-2027 (%)
- 9.10 Japan - Market size and forecast 2022-2027
- Exhibit 97: Chart on Japan - Market size and forecast 2022-2027 ($ million)
- Exhibit 98: Data Table on Japan - Market size and forecast 2022-2027 ($ million)
- Exhibit 99: Chart on Japan - Year-over-year growth 2022-2027 (%)
- Exhibit 100: Data Table on Japan - Year-over-year growth 2022-2027 (%)
- 9.11 Germany - Market size and forecast 2022-2027
- Exhibit 101: Chart on Germany - Market size and forecast 2022-2027 ($ million)
- Exhibit 102: Data Table on Germany - Market size and forecast 2022-2027 ($ million)
- Exhibit 103: Chart on Germany - Year-over-year growth 2022-2027 (%)
- Exhibit 104: Data Table on Germany - Year-over-year growth 2022-2027 (%)
- 9.12 India - Market size and forecast 2022-2027
- Exhibit 105: Chart on India - Market size and forecast 2022-2027 ($ million)
- Exhibit 106: Data Table on India - Market size and forecast 2022-2027 ($ million)
- Exhibit 107: Chart on India - Year-over-year growth 2022-2027 (%)
- Exhibit 108: Data Table on India - Year-over-year growth 2022-2027 (%)
- 9.13 Market opportunity by geography
- Exhibit 109: Market opportunity by geography ($ million)
10 Drivers, Challenges, and Trends
- 10.1 Market drivers
- 10.2 Market challenges
- 10.3 Impact of drivers and challenges
- Exhibit 110: Impact of drivers and challenges in 2022 and 2027
- 10.4 Market trends
11 Vendor Landscape
- 11.1 Overview
- 11.2 Vendor landscape
- Exhibit 111: Overview on Criticality of inputs and Factors of differentiation
- 11.3 Landscape disruption
- Exhibit 112: Overview on factors of disruption
- 11.4 Industry risks
- Exhibit 113: Impact of key risks on business
12 Vendor Analysis
- 12.1 Vendors covered
- Exhibit 114: Vendors covered
- 12.2 Market positioning of vendors
- Exhibit 115: Matrix on vendor position and classification
- 12.3 ACTIA PCS
- Exhibit 116: ACTIA PCS - Overview
- Exhibit 117: ACTIA PCS - Product / Service
- Exhibit 118: ACTIA PCS - Key offerings
- 12.4 Broadcom Inc.
- Exhibit 119: Broadcom Inc. - Overview
- Exhibit 120: Broadcom Inc. - Business segments
- Exhibit 121: Broadcom Inc. - Key news
- Exhibit 122: Broadcom Inc. - Key offerings
- Exhibit 123: Broadcom Inc. - Segment focus
- 12.5 Cadence Design Systems Inc.
- Exhibit 124: Cadence Design Systems Inc. - Overview
- Exhibit 125: Cadence Design Systems Inc. - Business segments
- Exhibit 126: Cadence Design Systems Inc. - Key offerings
- Exhibit 127: Cadence Design Systems Inc. - Segment focus
- 12.6 Infineon Technologies AG
- Exhibit 128: Infineon Technologies AG - Overview
- Exhibit 129: Infineon Technologies AG - Business segments
- Exhibit 130: Infineon Technologies AG - Key news
- Exhibit 131: Infineon Technologies AG - Key offerings
- Exhibit 132: Infineon Technologies AG - Segment focus
- 12.7 Intrepid Control Systems Inc.
- Exhibit 133: Intrepid Control Systems Inc. - Overview
- Exhibit 134: Intrepid Control Systems Inc. - Product / Service
- Exhibit 135: Intrepid Control Systems Inc. - Key offerings
- 12.8 Keysight Technologies Inc.
- Exhibit 136: Keysight Technologies Inc. - Overview
- Exhibit 137: Keysight Technologies Inc. - Business segments
- Exhibit 138: Keysight Technologies Inc. - Key news
- Exhibit 139: Keysight Technologies Inc. - Key offerings
- Exhibit 140: Keysight Technologies Inc. - Segment focus
- 12.9 Marvell Technology Inc.
- Exhibit 141: Marvell Technology Inc. - Overview
- Exhibit 142: Marvell Technology Inc. - Product / Service
- Exhibit 143: Marvell Technology Inc. - Key offerings
- 12.10 Microchip Technology Inc.
- Exhibit 144: Microchip Technology Inc. - Overview
- Exhibit 145: Microchip Technology Inc. - Business segments
- Exhibit 146: Microchip Technology Inc. - Key offerings
- Exhibit 147: Microchip Technology Inc. - Segment focus
- 12.11 NEXCOM International Co. Ltd.
- Exhibit 148: NEXCOM International Co. Ltd. - Overview
- Exhibit 149: NEXCOM International Co. Ltd. - Product / Service
- Exhibit 150: NEXCOM International Co. Ltd. - Key offerings
- 12.12 NXP Semiconductors NV
- Exhibit 151: NXP Semiconductors NV - Overview
- Exhibit 152: NXP Semiconductors NV - Product / Service
- Exhibit 153: NXP Semiconductors NV - Key news
- Exhibit 154: NXP Semiconductors NV - Key offerings
- 12.13 Realtek Semiconductor Corp.
- Exhibit 155: Realtek Semiconductor Corp. - Overview
- Exhibit 156: Realtek Semiconductor Corp. - Product / Service
- Exhibit 157: Realtek Semiconductor Corp. - Key offerings
- 12.14 Rohde and Schwarz GmbH and Co. KG
- Exhibit 158: Rohde and Schwarz GmbH and Co. KG - Overview
- Exhibit 159: Rohde and Schwarz GmbH and Co. KG - Product / Service
- Exhibit 160: Rohde and Schwarz GmbH and Co. KG - Key offerings
- 12.15 Spirent Communications Plc
- Exhibit 161: Spirent Communications Plc - Overview
- Exhibit 162: Spirent Communications Plc - Business segments
- Exhibit 163: Spirent Communications Plc - Key news
- Exhibit 164: Spirent Communications Plc - Key offerings
- Exhibit 165: Spirent Communications Plc - Segment focus
- 12.16 System on Chip Engineering S.L.
- Exhibit 166: System on Chip Engineering S.L. - Overview
- Exhibit 167: System on Chip Engineering S.L. - Product / Service
- Exhibit 168: System on Chip Engineering S.L. - Key offerings
- 12.17 TE Connectivity Ltd.
- Exhibit 169: TE Connectivity Ltd. - Overview
- Exhibit 170: TE Connectivity Ltd. - Business segments
- Exhibit 171: TE Connectivity Ltd. - Key offerings
- Exhibit 172: TE Connectivity Ltd. - Segment focus
13 Appendix
- 13.1 Scope of the report
- 13.2 Inclusions and exclusions checklist
- Exhibit 173: Inclusions checklist
- Exhibit 174: Exclusions checklist
- 13.3 Currency conversion rates for US$
- Exhibit 175: Currency conversion rates for US$
- 13.4 Research methodology
- Exhibit 176: Research methodology
- Exhibit 177: Validation techniques employed for market sizing
- Exhibit 178: Information sources
- 13.5 List of abbreviations
- Exhibit 179: List of abbreviations
Research Framework
Technavio presents a detailed picture of the market by way of study, synthesis, and summation of data from multiple sources. The analysts have presented the various facets of the market with a particular focus on identifying the key industry influencers. The data thus presented is comprehensive, reliable, and the result of extensive research, both primary and secondary.
INFORMATION SOURCES
Primary sources
- Manufacturers and suppliers
- Channel partners
- Industry experts
- Strategic decision makers
Secondary sources
- Industry journals and periodicals
- Government data
- Financial reports of key industry players
- Historical data
- Press releases
DATA ANALYSIS
Data Synthesis
- Collation of data
- Estimation of key figures
- Analysis of derived insights
Data Validation
- Triangulation with data models
- Reference against proprietary databases
- Corroboration with industry experts
REPORT WRITING
Qualitative
- Market drivers
- Market challenges
- Market trends
- Five forces analysis
Quantitative
- Market size and forecast
- Market segmentation
- Geographical insights
- Competitive landscape
PURCHASE FULL REPORT OF
automotive ethernet market market
Key Questions Answered
- What are the key global market and the regional market share?
- What are the revenue-generating key market segments?
- What are the key factors driving and challenging this market’s growth?
- Who are the key market vendors and their growth strategies?
- What are the latest trends influencing the growth of this market?
- What are the variables influencing the market growth in the primary regions?
- What are the factors influencing the growth of the parent market?
Why should you prefer Technavio's market insights report?
- Off-the-shelf research reports
- Reports can be tailored to meet the customer's needs
- Trusted by more than 100 fortune 500 organizations
- Information about the market's key drivers, trends, and challenges
- Parent market analysis
- Every week, 50,000 people visit our subscription platform
- Detailed vendors report with competitive landscape
- Covid-19 impact and recovery analysis
- Data on revenue-generating market segments
- Details on the market shares of various regions
- Five-force market analysis