Aviation Fuel Market Analysis North America, APAC, Europe, South America, Middle East and Africa - US, Canada, China, India, Germany - Size and Forecast 2023-2027
| Published: Oct 2023 | Pages: 170 | SKU: IRTNTR40657 |
Aviation Fuel Market Analysis Report 2023-2027:
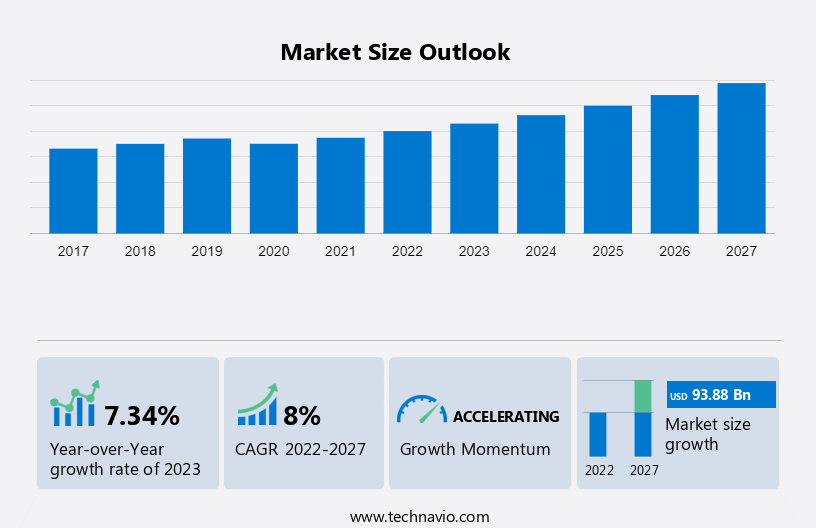
The aviation fuel market size is forecast to increase by USD 93.88 billion at a CAGR of 8% between 2022 and 2027. The growth of the market depends on several factors, including an increasing focus on clean aviation fuel, the increase in demand for air travel, and the increasing use of military UAVs. It also includes an in-depth analysis of drivers, market trends and analysis, and challenges. Furthermore, the report includes historic market data from 2017 to 2021.
What will be the Size of the Aviation Fuel Market During the Forecast Period?
To learn more about this report, View Report Sample
Key Drivers, Trends, Challenges, and Customer Landscape
Our researchers analyzed the data with 2022 as the base year, along with the key drivers, trends, and challenges. A holistic analysis of drivers will help companies refine their marketing strategies to gain a competitive advantage.
Market Driver
Increasing focus on clean aviation fuel will drive the growth of the market. Global fuel price uncertainty, energy security needs, and ever-increasing emissions are driving a global interest in alternative fuels in the aviation industry. The depletion of fossil fuel reserves has also increased the demand for aviation biofuels. Through research and development efforts around the world, aviation biofuels and biofuel suppliers are slowly making their way toward large-scale commercialization. In addition, exhaust gas regulations are being strengthened in various countries. Euro VI emission standards are currently being implemented in European countries and are the basis for emission standards in other countries such as India.
Such emission standards are therefore forcing countries around the world to increase the use of renewable fuels such as ethanol and biodiesel in the aviation sector. In addition, the provider is focused on developing clean fuels in the aviation sector. For example, in March 2022 Rolls-Royce signed an agreement with Air bp for sustainable aviation fuel for engine testing. Such developments will propel the growth of the market we are focusing on during the forecast period.
Market Trend
The launch of new aviation fuel technology is the primary trend in the market growth. Vendors operating in key markets have announced new fuel technologies for sustainable aviation fuel market. For instance, in March 2023, Honeywell announced the launch of its new UOP eFining technology, a solution for producing low-carbon sustainable aviation fuel (SAF). eFuels, also known as electro fuels, are a class of synthetic fuels that can replace conventionally produced fossil fuels.
Similarly, in October 2022, Honeywell announced the launch of a new, innovative ethanol-to-jet fuel (ETJ) processing technology that drive the conversion of corn-based, cellulosic, or sugar-based ethanol into SAF. The introduction of such new aviation fuel technologies will drive the growth of the focus market during the forecast period.
Market Challenge
Fluctuations in oil and gas prices is a major challenge to the growth of the market. The aviation sector is linked to oil prices, and its success depends on oil prices. Crude oil prices have remained low for a long period of time. Prices are steadily falling due to the imbalance between supply and demand. Earnings for upstream oil and gas companies are declining, directly impacting cash flow. Fluctuations in oil prices pose a significant risk to airlines. Rising oil prices will increase downstream input costs, which in turn will increase the cost of jet fuel.
However, in a period of falling oil prices, operating costs for the airline industry may be reduced. Lower jet fuel prices have increased airline profits and lowered airfares. This increased the demand for air travel, forcing airlines to increase capacity. More routes and more fleets by airlines could hurt profitability if oil prices recover. Falling oil prices have dampened the focus on investing in alternative aviation fuels. Airlines must balance low jet fuel costs with increased supply capacity to take advantage of oil price volatility. Such factors may hinder market growth during the forecast period.
Market Customer Landscape
The Market forecasting report includes the adoption lifecycle of the market, covering from the innovator’s stage to the laggard’s stage. It focuses on adoption rates in different regions based on penetration. Furthermore, the report also includes key purchase criteria and drivers of price sensitivity to help companies evaluate and develop their market growth and forecasting strategies.
Global Aviation Fuel Market Customer Landscape
Who are the Major Aviation Fuel Market Vendors?
Vendors are implementing various strategies, such as strategic alliances, market growth and trends, partnerships, mergers and acquisitions, geographical expansion, and product/service launches, to enhance their presence in the market.
BP Plc: The company offers portable fire extinguishers such as Cosmic extinguishers, Galaxy extinguishers, and Mercury extinguishers.
The market growth analysis report also includes detailed analyses of the competitive landscape of the market and information about 15 market vendors, including:
- Chevron Corp.
- Exxon Mobil Corp.
- Gazprom International Ltd.
- Gevo Inc.
- Honeywell International Inc.
- LanzaTech Global Inc.
- Marathon Petroleum Corp.
- MOL Group
- Neste Corp.
- Oil and Natural Gas Corp. Ltd.
- Petroleo Brasileiro SA
- PJSC LUKOIL
- Shell plc
- SkyNRG BV
- Swedish Biofuels AB
- Targray Technology International Inc.
- TotalEnergies SE
- Valero Energy Corp.
- Vitol Netherlands Cooperatief UA
Qualitative and quantitative analysis of vendors has been conducted to help clients understand the wider business environment as well as the strengths and weaknesses of key market players. Data is qualitatively analyzed to categorize vendors as pure play, category-focused, industry-focused, and diversified; it is quantitatively analyzed to categorize vendors as dominant, leading, strong, tentative, and weak.
Market Dynamic
The aviation fuel industry faces significant challenges and opportunities, especially in developing countries where low-cost carriers are prevalent. The market address environmental concerns, the industry is turning to advanced aviation biofuels, fuel type and navigating stringent environmental regulations to reduce CO2 emissions and reliance on fossil jet fuel. Additionally contributes to greenhouse gases in the atmosphere and GHG emissions from conventional jet fuel is major concern. Biomass and other biological resources are being explored as alternatives, aiming to minimize sulfur dioxide and particulate matter emissions. Furthermore, the rise of hybrid and electric vehicles alongside existing aircraft highlights the push for sustainable jet fuel. Market players, including airports, fuel suppliers, and technology providers, collaborate to streamline the demand and supply chain while adhering to supportive policies aimed at decarbonizing aviation emissions and ensuring environmental sustainability
Innovations in aircraft engines and the value chain aim to reduce GHG emissions while accommodating increasing air passenger traffic. Efforts to decarbonize aviation emissions focus on utilizing energy-dense biofuels from non-biological resources, aiming to lower GHG concentration and foster sustainability in the aviation industry.
Market Segmentation
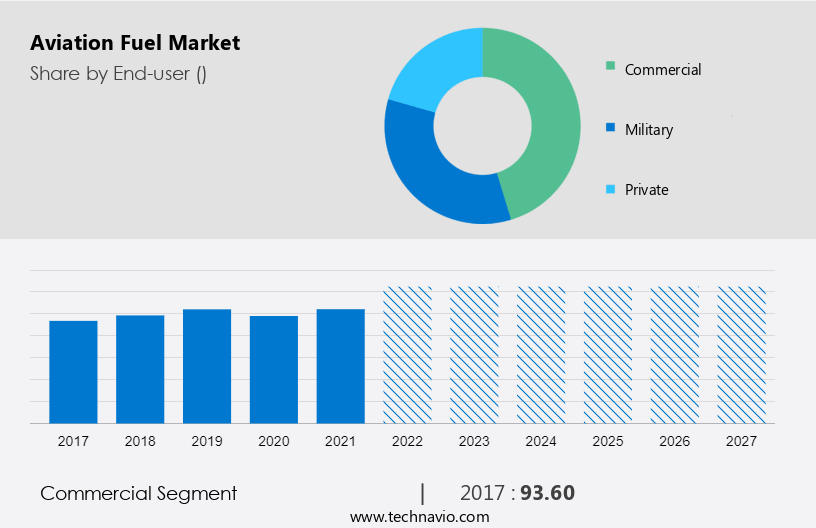
The commercial segment will be significant during the forecast period. The commercial aircraft industry is rapidly growing due to several factors, such as increasing air passengers and increasing disposable income, which, in turn, are driving the growth of the market.
Get a glance at the market contribution of various segments View the PDF Sample
The commercial segment was valued at USD 93.60 Billion in 2017 and continued to grow by 2021. The commercial aircraft segment has been experiencing significant growth since 2021, owing to the post-pandemic recovery of the aviation industry. This is mainly because of the increasing number of air passengers since 2021. Hence, major aircraft OEMs have initiated the revamping of their existing production facilities to ensure scheduled deliveries. Most LCCs are trying to modernize the existing fleet to exploit new market opportunities for the vendors in the market. The increasing number of air passengers has resulted in tremendous pressure on airline and airport authorities to effectively manage the aircraft. This led to an increase in the demand for commercial aircraft and, in turn, aviation fuel which will drive the growth of the market in focus during the forecast period.
Key Regional Analysis
For more insights on the market share of various regions Download PDF Sample now!
APAC is estimated to contribute 39% to the growth of the global market during the forecast period. Technavio’s analysts have elaborately explained the regional trends and drivers that shape the market during the forecast period. The North American aviation market is maturing due to the strong aviation base of the North American countries, especially the United States. The rapidly growing global demand for new aircraft has increased the need to invest in efficient aircraft systems. Therefore, significant investments have been made in manufacturing commercial aircraft systems, which has driven the growth of the market.
Segment Overview
The market report forecasts market growth by revenue at global, regional & country levels and provides an analysis of the latest trends and growth opportunities from 2017 to 2027.
- End-user Outlook (USD Billion, 2017 - 2027)
- Commercial
- Military
- Private
- Product Outlook (USD Billion, 2017 - 2027)
- ATF
- Aviation biofuel
- Geography Outlook (USD Billion, 2017 - 2027)
- North America
- The U.S.
- Canada
- Europe
- U.K.
- Germany
- France
- Rest of Europe
- APAC
- China
- India
- South America
- Chile
- Argentina
- Brazi
- Middle East & Africa
- Saudi Arabia
- South Africa
- Rest of the Middle East & Africa
- North America
|
Aviation Fuel Market Scope |
|
|
Report Coverage |
Details |
|
Page number |
170 |
|
Base year |
2022 |
|
Historic period |
2017-2021 |
|
Forecast period |
2023-2027 |
|
Growth momentum & CAGR |
Accelerate at a CAGR of 8% |
|
Market growth 2023-2027 |
USD 93.88 billion |
|
Market structure |
Fragmented |
|
YoY growth 2022-2023(%) |
7.34 |
|
Regional analysis |
North America, APAC, Europe, South America, and Middle East and Africa |
|
Performing market contribution |
APAC at 39% |
|
Key countries |
US, Canada, China, India, and Germany |
|
Competitive landscape |
Leading Vendors, Market Positioning of Vendors, Competitive Strategies, and Industry Risks |
|
Key companies profiled |
BP Plc, Chevron Corp., Exxon Mobil Corp., Gazprom International Ltd., Gevo Inc., Honeywell International Inc., LanzaTech Global Inc., Marathon Petroleum Corp., MOL Group, Neste Corp., Oil and Natural Gas Corp. Ltd., Petroleo Brasileiro SA, PJSC LUKOIL, Shell plc, SkyNRG BV, Swedish Biofuels AB, Targray Technology International Inc., TotalEnergies SE, Valero Energy Corp., and Vitol Netherlands Cooperatief UA |
|
Market dynamics |
Parent market analysis, Market growth inducers and obstacles, Fast-growing and slow-growing segment analysis, COVID 19 impact and recovery analysis and future consumer dynamics, Market condition analysis for forecast period |
|
Customization purview |
If our report has not included the data that you are looking for, you can reach out to our analysts and get segments customized. |
What are the Key Data Covered in this Market Research Report?
- CAGR of the market during the forecast period
- Detailed information on factors that will drive the growth of the market between 2023 and 2027
- Precise estimation of the size of the market size and its contribution of the market in focus to the parent market
- Accurate predictions about upcoming trends and changes in consumer behaviour
- Growth of the market industry across North America, APAC, Europe, South America, and Middle East and Africa
- Thorough analysis of the market’s competitive landscape and detailed information about vendors
- Comprehensive analysis of factors that will challenge the growth of market vendors
We can help! Our analysts can customize this market research report to meet your requirements.
1 Executive Summary
- 1.1 Market overview
- Exhibit 01: Executive Summary – Chart on Market Overview
- Exhibit 02: Executive Summary – Data Table on Market Overview
- Exhibit 03: Executive Summary – Chart on Global Market Characteristics
- Exhibit 04: Executive Summary – Chart on Market by Geography
- Exhibit 05: Executive Summary – Chart on Market Segmentation by End-user
- Exhibit 06: Executive Summary – Chart on Market Segmentation by Product
- Exhibit 07: Executive Summary – Chart on Incremental Growth
- Exhibit 08: Executive Summary – Data Table on Incremental Growth
- Exhibit 09: Executive Summary – Chart on Vendor Market Positioning
2 Market Landscape
- 2.1 Market ecosystem
- Exhibit 10: Parent market
- Exhibit 11: Market Characteristics
3 Market Sizing
- 3.1 Market definition
- Exhibit 12: Offerings of vendors included in the market definition
- 3.2 Market segment analysis
- Exhibit 13: Market segments
- 3.3 Market size 2022
- 3.4 Market outlook: Forecast for 2022-2027
- Exhibit 14: Chart on Global - Market size and forecast 2022-2027 ($ billion)
- Exhibit 15: Data Table on Global - Market size and forecast 2022-2027 ($ billion)
- Exhibit 16: Chart on Global Market: Year-over-year growth 2022-2027 (%)
- Exhibit 17: Data Table on Global Market: Year-over-year growth 2022-2027 (%)
4 Historic Market Size
- 4.1 Global aviation fuel market 2017 - 2021
- Exhibit 18: Historic Market Size – Data Table on global aviation fuel market 2017 - 2021 ($ billion)
- 4.2 End-user Segment Analysis 2017 - 2021
- Exhibit 19: Historic Market Size – End-user Segment 2017 - 2021 ($ billion)
- 4.3 Product Segment Analysis 2017 - 2021
- Exhibit 20: Historic Market Size – Product Segment 2017 - 2021 ($ billion)
- 4.4 Geography Segment Analysis 2017 - 2021
- Exhibit 21: Historic Market Size – Geography Segment 2017 - 2021 ($ billion)
- 4.5 Country Segment Analysis 2017 - 2021
- Exhibit 22: Historic Market Size – Country Segment 2017 - 2021 ($ billion)
5 Five Forces Analysis
- 5.1 Five forces summary
- Exhibit 23: Five forces analysis - Comparison between 2022 and 2027
- 5.2 Bargaining power of buyers
- Exhibit 24: Chart on Bargaining power of buyers – Impact of key factors 2022 and 2027
- 5.3 Bargaining power of suppliers
- Exhibit 25: Bargaining power of suppliers – Impact of key factors in 2022 and 2027
- 5.4 Threat of new entrants
- Exhibit 26: Threat of new entrants – Impact of key factors in 2022 and 2027
- 5.5 Threat of substitutes
- Exhibit 27: Threat of substitutes – Impact of key factors in 2022 and 2027
- 5.6 Threat of rivalry
- Exhibit 28: Threat of rivalry – Impact of key factors in 2022 and 2027
- 5.7 Market condition
- Exhibit 29: Chart on Market condition - Five forces 2022 and 2027
6 Market Segmentation by End-user
- 6.1 Market segments
- Exhibit 30: Chart on End-user - Market share 2022-2027 (%)
- Exhibit 31: Data Table on End-user - Market share 2022-2027 (%)
- 6.2 Comparison by End-user
- Exhibit 32: Chart on Comparison by End-user
- Exhibit 33: Data Table on Comparison by End-user
- 6.3 Commercial - Market size and forecast 2022-2027
- Exhibit 34: Chart on Commercial - Market size and forecast 2022-2027 ($ billion)
- Exhibit 35: Data Table on Commercial - Market size and forecast 2022-2027 ($ billion)
- Exhibit 36: Chart on Commercial - Year-over-year growth 2022-2027 (%)
- Exhibit 37: Data Table on Commercial - Year-over-year growth 2022-2027 (%)
- 6.4 Military - Market size and forecast 2022-2027
- Exhibit 38: Chart on Military - Market size and forecast 2022-2027 ($ billion)
- Exhibit 39: Data Table on Military - Market size and forecast 2022-2027 ($ billion)
- Exhibit 40: Chart on Military - Year-over-year growth 2022-2027 (%)
- Exhibit 41: Data Table on Military - Year-over-year growth 2022-2027 (%)
- 6.5 Private - Market size and forecast 2022-2027
- Exhibit 42: Chart on Private - Market size and forecast 2022-2027 ($ billion)
- Exhibit 43: Data Table on Private - Market size and forecast 2022-2027 ($ billion)
- Exhibit 44: Chart on Private - Year-over-year growth 2022-2027 (%)
- Exhibit 45: Data Table on Private - Year-over-year growth 2022-2027 (%)
- 6.6 Market opportunity by End-user
- Exhibit 46: Market opportunity by End-user ($ billion)
- Exhibit 47: Data Table on Market opportunity by End-user ($ billion)
7 Market Segmentation by Product
- 7.1 Market segments
- Exhibit 48: Chart on Product - Market share 2022-2027 (%)
- Exhibit 49: Data Table on Product - Market share 2022-2027 (%)
- 7.2 Comparison by Product
- Exhibit 50: Chart on Comparison by Product
- Exhibit 51: Data Table on Comparison by Product
- 7.3 ATF - Market size and forecast 2022-2027
- Exhibit 52: Chart on ATF - Market size and forecast 2022-2027 ($ billion)
- Exhibit 53: Data Table on ATF - Market size and forecast 2022-2027 ($ billion)
- Exhibit 54: Chart on ATF - Year-over-year growth 2022-2027 (%)
- Exhibit 55: Data Table on ATF - Year-over-year growth 2022-2027 (%)
- 7.4 Aviation biofuel - Market size and forecast 2022-2027
- Exhibit 56: Chart on Aviation biofuel - Market size and forecast 2022-2027 ($ billion)
- Exhibit 57: Data Table on Aviation biofuel - Market size and forecast 2022-2027 ($ billion)
- Exhibit 58: Chart on Aviation biofuel - Year-over-year growth 2022-2027 (%)
- Exhibit 59: Data Table on Aviation biofuel - Year-over-year growth 2022-2027 (%)
- 7.5 Market opportunity by Product
- Exhibit 60: Market opportunity by Product ($ billion)
- Exhibit 61: Data Table on Market opportunity by Product ($ billion)
8 Customer Landscape
- 8.1 Customer landscape overview
- Exhibit 62: Analysis of price sensitivity, lifecycle, customer purchase basket, adoption rates, and purchase criteria
9 Geographic Landscape
- 9.1 Geographic segmentation
- Exhibit 63: Chart on Market share by geography 2022-2027 (%)
- Exhibit 64: Data Table on Market share by geography 2022-2027 (%)
- 9.2 Geographic comparison
- Exhibit 65: Chart on Geographic comparison
- Exhibit 66: Data Table on Geographic comparison
- 9.3 North America - Market size and forecast 2022-2027
- Exhibit 67: Chart on North America - Market size and forecast 2022-2027 ($ billion)
- Exhibit 68: Data Table on North America - Market size and forecast 2022-2027 ($ billion)
- Exhibit 69: Chart on North America - Year-over-year growth 2022-2027 (%)
- Exhibit 70: Data Table on North America - Year-over-year growth 2022-2027 (%)
- 9.4 APAC - Market size and forecast 2022-2027
- Exhibit 71: Chart on APAC - Market size and forecast 2022-2027 ($ billion)
- Exhibit 72: Data Table on APAC - Market size and forecast 2022-2027 ($ billion)
- Exhibit 73: Chart on APAC - Year-over-year growth 2022-2027 (%)
- Exhibit 74: Data Table on APAC - Year-over-year growth 2022-2027 (%)
- 9.5 Europe - Market size and forecast 2022-2027
- Exhibit 75: Chart on Europe - Market size and forecast 2022-2027 ($ billion)
- Exhibit 76: Data Table on Europe - Market size and forecast 2022-2027 ($ billion)
- Exhibit 77: Chart on Europe - Year-over-year growth 2022-2027 (%)
- Exhibit 78: Data Table on Europe - Year-over-year growth 2022-2027 (%)
- 9.6 South America - Market size and forecast 2022-2027
- Exhibit 79: Chart on South America - Market size and forecast 2022-2027 ($ billion)
- Exhibit 80: Data Table on South America - Market size and forecast 2022-2027 ($ billion)
- Exhibit 81: Chart on South America - Year-over-year growth 2022-2027 (%)
- Exhibit 82: Data Table on South America - Year-over-year growth 2022-2027 (%)
- 9.7 Middle East and Africa - Market size and forecast 2022-2027
- Exhibit 83: Chart on Middle East and Africa - Market size and forecast 2022-2027 ($ billion)
- Exhibit 84: Data Table on Middle East and Africa - Market size and forecast 2022-2027 ($ billion)
- Exhibit 85: Chart on Middle East and Africa - Year-over-year growth 2022-2027 (%)
- Exhibit 86: Data Table on Middle East and Africa - Year-over-year growth 2022-2027 (%)
- 9.8 US - Market size and forecast 2022-2027
- Exhibit 87: Chart on US - Market size and forecast 2022-2027 ($ billion)
- Exhibit 88: Data Table on US - Market size and forecast 2022-2027 ($ billion)
- Exhibit 89: Chart on US - Year-over-year growth 2022-2027 (%)
- Exhibit 90: Data Table on US - Year-over-year growth 2022-2027 (%)
- 9.9 China - Market size and forecast 2022-2027
- Exhibit 91: Chart on China - Market size and forecast 2022-2027 ($ billion)
- Exhibit 92: Data Table on China - Market size and forecast 2022-2027 ($ billion)
- Exhibit 93: Chart on China - Year-over-year growth 2022-2027 (%)
- Exhibit 94: Data Table on China - Year-over-year growth 2022-2027 (%)
- 9.10 Germany - Market size and forecast 2022-2027
- Exhibit 95: Chart on Germany - Market size and forecast 2022-2027 ($ billion)
- Exhibit 96: Data Table on Germany - Market size and forecast 2022-2027 ($ billion)
- Exhibit 97: Chart on Germany - Year-over-year growth 2022-2027 (%)
- Exhibit 98: Data Table on Germany - Year-over-year growth 2022-2027 (%)
- 9.11 India - Market size and forecast 2022-2027
- Exhibit 99: Chart on India - Market size and forecast 2022-2027 ($ billion)
- Exhibit 100: Data Table on India - Market size and forecast 2022-2027 ($ billion)
- Exhibit 101: Chart on India - Year-over-year growth 2022-2027 (%)
- Exhibit 102: Data Table on India - Year-over-year growth 2022-2027 (%)
- 9.12 Canada - Market size and forecast 2022-2027
- Exhibit 103: Chart on Canada - Market size and forecast 2022-2027 ($ billion)
- Exhibit 104: Data Table on Canada - Market size and forecast 2022-2027 ($ billion)
- Exhibit 105: Chart on Canada - Year-over-year growth 2022-2027 (%)
- Exhibit 106: Data Table on Canada - Year-over-year growth 2022-2027 (%)
- 9.13 Market opportunity by geography
- Exhibit 107: Market opportunity by geography ($ billion)
- Exhibit 108: Data Tables on Market opportunity by geography ($ billion)
10 Drivers, Challenges, and Trends
- 10.1 Market drivers
- 10.2 Market challenges
- 10.3 Impact of drivers and challenges
- Exhibit 109: Impact of drivers and challenges in 2022 and 2027
- 10.4 Market trends
11 Vendor Landscape
- 11.1 Overview
- 11.2 Vendor landscape
- Exhibit 110: Overview on Criticality of inputs and Factors of differentiation
- 11.3 Landscape disruption
- Exhibit 111: Overview on factors of disruption
- 11.4 Industry risks
- Exhibit 112: Impact of key risks on business
12 Vendor Analysis
- 12.1 Vendors covered
- Exhibit 113: Vendors covered
- 12.2 Market positioning of vendors
- Exhibit 114: Matrix on vendor position and classification
- 12.3 BP Plc
- Exhibit 115: BP Plc - Overview
- Exhibit 116: BP Plc - Business segments
- Exhibit 117: BP Plc - Key news
- Exhibit 118: BP Plc - Key offerings
- Exhibit 119: BP Plc - Segment focus
- 12.4 Chevron Corp.
- Exhibit 120: Chevron Corp. - Overview
- Exhibit 121: Chevron Corp. - Business segments
- Exhibit 122: Chevron Corp. - Key news
- Exhibit 123: Chevron Corp. - Key offerings
- Exhibit 124: Chevron Corp. - Segment focus
- 12.5 Exxon Mobil Corp.
- Exhibit 125: Exxon Mobil Corp. - Overview
- Exhibit 126: Exxon Mobil Corp. - Business segments
- Exhibit 127: Exxon Mobil Corp. - Key offerings
- Exhibit 128: Exxon Mobil Corp. - Segment focus
- 12.6 Gazprom International Ltd.
- Exhibit 129: Gazprom International Ltd. - Overview
- Exhibit 130: Gazprom International Ltd. - Product / Service
- Exhibit 131: Gazprom International Ltd. - Key offerings
- 12.7 Gevo Inc.
- Exhibit 132: Gevo Inc. - Overview
- Exhibit 133: Gevo Inc. - Business segments
- Exhibit 134: Gevo Inc. - Key offerings
- Exhibit 135: Gevo Inc. - Segment focus
- 12.8 Honeywell International Inc.
- Exhibit 136: Honeywell International Inc. - Overview
- Exhibit 137: Honeywell International Inc. - Business segments
- Exhibit 138: Honeywell International Inc. - Key news
- Exhibit 139: Honeywell International Inc. - Key offerings
- Exhibit 140: Honeywell International Inc. - Segment focus
- 12.9 LanzaTech Global Inc.
- Exhibit 141: LanzaTech Global Inc. - Overview
- Exhibit 142: LanzaTech Global Inc. - Product / Service
- Exhibit 143: LanzaTech Global Inc. - Key offerings
- 12.10 Marathon Petroleum Corp.
- Exhibit 144: Marathon Petroleum Corp. - Overview
- Exhibit 145: Marathon Petroleum Corp. - Business segments
- Exhibit 146: Marathon Petroleum Corp. - Key offerings
- Exhibit 147: Marathon Petroleum Corp. - Segment focus
- 12.11 MOL Group
- Exhibit 148: MOL Group - Overview
- Exhibit 149: MOL Group - Business segments
- Exhibit 150: MOL Group - Key offerings
- Exhibit 151: MOL Group - Segment focus
- 12.12 Neste Corp.
- Exhibit 152: Neste Corp. - Overview
- Exhibit 153: Neste Corp. - Business segments
- Exhibit 154: Neste Corp. - Key news
- Exhibit 155: Neste Corp. - Key offerings
- Exhibit 156: Neste Corp. - Segment focus
- 12.13 Oil and Natural Gas Corp. Ltd.
- Exhibit 157: Oil and Natural Gas Corp. Ltd. - Overview
- Exhibit 158: Oil and Natural Gas Corp. Ltd. - Business segments
- Exhibit 159: Oil and Natural Gas Corp. Ltd. - Key offerings
- Exhibit 160: Oil and Natural Gas Corp. Ltd. - Segment focus
- 12.14 PJSC LUKOIL
- Exhibit 161: PJSC LUKOIL - Overview
- Exhibit 162: PJSC LUKOIL - Business segments
- Exhibit 163: PJSC LUKOIL - Key news
- Exhibit 164: PJSC LUKOIL - Key offerings
- Exhibit 165: PJSC LUKOIL - Segment focus
- 12.15 Shell plc
- Exhibit 166: Shell plc - Overview
- Exhibit 167: Shell plc - Business segments
- Exhibit 168: Shell plc - Key offerings
- Exhibit 169: Shell plc - Segment focus
- 12.16 TotalEnergies SE
- Exhibit 170: TotalEnergies SE - Overview
- Exhibit 171: TotalEnergies SE - Business segments
- Exhibit 172: TotalEnergies SE - Key news
- Exhibit 173: TotalEnergies SE - Key offerings
- Exhibit 174: TotalEnergies SE - Segment focus
- 12.17 Valero Energy Corp.
- Exhibit 175: Valero Energy Corp. - Overview
- Exhibit 176: Valero Energy Corp. - Business segments
- Exhibit 177: Valero Energy Corp. - Key offerings
- Exhibit 178: Valero Energy Corp. - Segment focus
13 Appendix
- 13.1 Scope of the report
- 13.2 Inclusions and exclusions checklist
- Exhibit 179: Inclusions checklist
- Exhibit 180: Exclusions checklist
- 13.3 Currency conversion rates for US$
- Exhibit 181: Currency conversion rates for US$
- 13.4 Research methodology
- Exhibit 182: Research methodology
- Exhibit 183: Validation techniques employed for market sizing
- Exhibit 184: Information sources
- 13.5 List of abbreviations
- Exhibit 185: List of abbreviations
Research Framework
Technavio presents a detailed picture of the market by way of study, synthesis, and summation of data from multiple sources. The analysts have presented the various facets of the market with a particular focus on identifying the key industry influencers. The data thus presented is comprehensive, reliable, and the result of extensive research, both primary and secondary.
INFORMATION SOURCES
Primary sources
- Manufacturers and suppliers
- Channel partners
- Industry experts
- Strategic decision makers
Secondary sources
- Industry journals and periodicals
- Government data
- Financial reports of key industry players
- Historical data
- Press releases
DATA ANALYSIS
Data Synthesis
- Collation of data
- Estimation of key figures
- Analysis of derived insights
Data Validation
- Triangulation with data models
- Reference against proprietary databases
- Corroboration with industry experts
REPORT WRITING
Qualitative
- Market drivers
- Market challenges
- Market trends
- Five forces analysis
Quantitative
- Market size and forecast
- Market segmentation
- Geographical insights
- Competitive landscape
PURCHASE FULL REPORT OF
aviation fuel market market
Key Questions Answered
- What are the key global market and the regional market share?
- What are the revenue-generating key market segments?
- What are the key factors driving and challenging this market’s growth?
- Who are the key market vendors and their growth strategies?
- What are the latest trends influencing the growth of this market?
- What are the variables influencing the market growth in the primary regions?
- What are the factors influencing the growth of the parent market?
Why should you prefer Technavio's market insights report?
- Off-the-shelf research reports
- Reports can be tailored to meet the customer's needs
- Trusted by more than 100 fortune 500 organizations
- Information about the market's key drivers, trends, and challenges
- Parent market analysis
- Every week, 50,000 people visit our subscription platform
- Detailed vendors report with competitive landscape
- Covid-19 impact and recovery analysis
- Data on revenue-generating market segments
- Details on the market shares of various regions
- Five-force market analysis