Commercial Drones Market Analysis North America,Europe,APAC,Middle East and Africa,South America - US,China,Japan,UK,France - Size and Forecast 2023-2027
| Published: Oct 2023 | Pages: 170 | SKU: IRTNTR40635 |
Commercial Drones Market 2023-2027
The commercial drones market size is forecast to increase by USD 44.85 billion between 2022 and 2027, accelerating at a CAGR of 38.97%. In 2017, the US held the largest market share, projecting an annual revenue of USD 0.87 billion. The market size, historical market size (2017-2021), and forecasts are provided on the basis of value (USD billion) for all the above segments.
What will be the Size of the Commercial Drones Market During the Forecast Period?
To learn more about this report, Download Report Sample
Market Analysis
The rising applications of drones are a key factor driving the market growth. Historically, drones were primarily utilized by the defense and military sectors. However, technological advancements have diversified their applications, including agriculture, construction, mapping, logistics, and surveillance. The logistics industry, in particular, is increasingly adopting drones for various applications, with companies like Zipline partnering with Walmart for commercial drone deliveries in the US. Unlike traditional rotorcraft, Zipline employs fixed-wing drones, offering larger payload capacity and longer range, albeit with more complex operations.
Drones enable faster deliveries compared to road transport, especially in areas affected by traffic congestion and limited maneuverability. With companies like DHL and Amazon planning drone delivery services, the global demand is poised for significant growth. The ongoing development in drone technology is expected to drive the global market in the forecast period.
Market Segment Trends
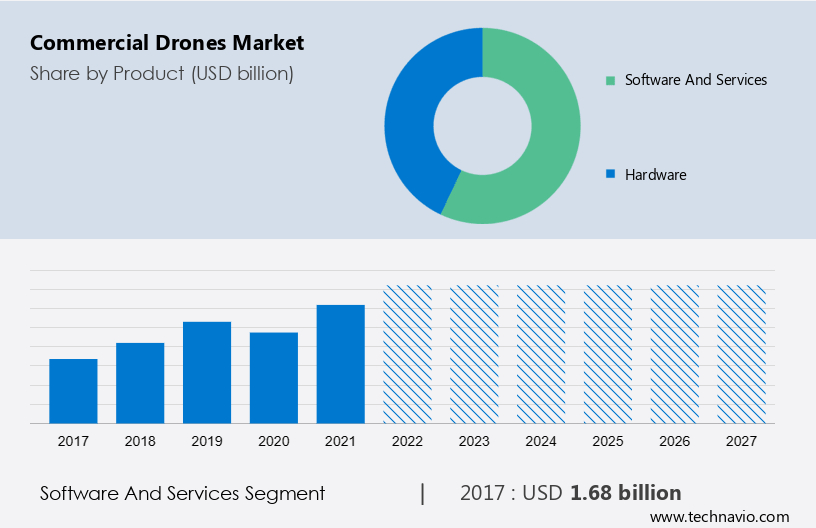
Software and Service is the Leading Segment to Dominate the Market
This software and services segment holds the largest commercial drone market is expected to dominate the market during the forecast period. The growth of this segment is attributed to factors such as the increasing demand for software in drones. Software solutions help companies validate and analyze drone data. The high cost associated with manufacturing drones, along with the competitive advantages and economic scales of established vendors such as DJI and Parrot, have forced many other vendors to stop manufacturing drones and shift to offering technical platforms and software solutions that are compatible with the drones available in the market. 3DR offers various drone software that can be used by end-users in the construction, mining, engineering, and other sectors to enable companies to capture data quickly and use it in estimating, designing, and tracking various processes. Such factors will increase segment growth during the forecast period.
Market - Revenue Share by XXX Segment, 2017-2027
For more details on other segments, Download Sample Report
North America Holds a Prominent Position in the Market
North America is estimated to contribute 44% to the growth of the global market during the forecast period.In North America, the US DoD and the National Aeronautics and Space Administration (NASA) are investing strongly in the R&D of advanced electronics and sensors for military UAVs, which will replace the existing avionics systems. Moreover, the government of the nation is increasingly focusing on empowering the defense forces of the nation. Drones are widely used by the DoD for surveillance, security, and spying. For instance, in May 2021, the US Army awarded a contract of USD 15.4 million to FLIR for its FLIR Black Hornet 3 personal reconnaissance systems. Black Hornet 3 is a palm-sized drone used for surveillance, spying, and guiding small military units and platoons. The success of drone strikes has increased the reliability of governing bodies over drones, which is likely to propel their demand and subsequently fuel the growth of the regional market during the forecast period
Market Size, By Region, Global, 2017-2027
To understand geographic trends Download Report Sample
Commercial Drones Companies Overview
The Market is fragmented in nature. Some significant players includeAeronavics and Autel Robotics Co. Ltd
The research report also includes detailed analyses of the competitive landscape of the market and information about 15 market companies, including:
Anadrone Systems Pvt. Ltd., Arc Sky LLC, Autel Robotics Co. Ltd., DELAIR SAS, Denel SOC Ltd., Draganfly Inc., Field Group AS, Geotech Environmental Equipment Inc., Guangzhou EHang Intelligent Technology Co. Ltd , iFlight Innovation Technology Ltd., Intel Corp., Parrot Drones SAS, Red Cat Holdings Inc., Skydio Inc., Teledyne Technologies Inc., The Boeing Co., and Yuneec International Co. Ltd.
Market Analyst Overview
The Commercial Drones Market is witnessing rapid growth, driven by diverse applications such as aerial photography, video recording, and surveying. Industries like construction, energy, and telecommunications utilize drones for monitoring, inspection, and surveying, enhancing efficiency and safety while reducing labor and time. However, challenges such as technological constraints, endurance limitations, and regulatory hurdles persist. Companies like Percepto and Air Mobile offer innovative "drone-in-a-box" solutions to address these challenges. Real-time data and aerial shots provide valuable insights for engineers, surveyors, and site managers, facilitating better decision-making in high-risk areas and dynamic environments.
Segment Overview
The market report forecasts market growth by revenue at global, regional & country levels and provides an analysis of the latest trends and growth opportunities from 2017 - 2021.
- Product Outlook (USD Million, 2017 - 2027)
- Software and services
- Hardware
- End-user Outlook (USD Million, 2017 - 2027)
- Infrastructure
- Media and entertainment
- Public safety
- Agriculture
- Others
- Region Outlook (USD Million, 2017 - 2027)
- North America
- The U.S.
- Canada
- Europe
- The U.K.
- Germany
- France
- Rest of Europe
- APAC
- China
- India
- Middle East & Africa
- Saudi Arabia
- South Africa
- Rest of the Middle East & Africa
- South America
- Argentina
- Brazil
- Chile
- North America
|
Market Scope |
|
|
Report Coverage |
Details |
|
Page number |
170 |
|
Base year |
2022 |
|
Historic period |
2017 - 2021 |
|
Forecast period |
2023-2027 |
|
Growth momentum & CAGR |
Accelerate at a CAGR of 38.97% |
|
Market growth 2023-2027 |
USD 44.85 billion |
|
Market structure |
Fragmented |
|
YoY growth 2022-2023(%) |
35.0 |
|
Regional analysis |
North America, Europe, APAC, Middle East and Africa, and South America |
|
Performing market contribution |
North America at 44% |
|
Key countries |
US, China, Japan, UK, and France |
|
Competitive landscape |
Leading Companies, Market Positioning of Companies, Competitive Strategies, and Industry Risks |
|
Key companies profiled |
Aeronavics, AeroTargets International LLC, AeroVironment Inc., Anadrone Systems Pvt. Ltd., Arc Sky LLC, Autel Robotics Co. Ltd., DELAIR SAS, Denel SOC Ltd., Draganfly Inc., Field Group AS, Geotech Environmental Equipment Inc., Guangzhou EHang Intelligent Technology Co. Ltd , iFlight Innovation Technology Ltd., Intel Corp., Parrot Drones SAS, Red Cat Holdings Inc., Skydio Inc., Teledyne Technologies Inc., The Boeing Co., and Yuneec International Co. Ltd. |
|
Market dynamics |
Parent market analysis, Market forecasting, Market growth inducers and obstacles, Fast-growing and slow-growing segment analysis, COVID-19 impact and recovery analysis and future consumer dynamics, Market condition analysis for the forecast period. |
|
Customization purview |
If our market growth and trends report has not included the data that you are looking for, you can reach out to our analysts and get segments customized. |
What are the Key Data Covered in this Market Research Report?
- CAGR of the market during the forecast period
- Detailed information on factors that will drive the market growth and forecasting of the market between 2023 and 2027
- Precise estimation of the size of the market size and its contribution to the parent market
- Accurate predictions about upcoming market trends and analysis and changes in consumer behavior
- Growth of the market industry across Europe, North America, APAC, South America, and Middle East and Africa
- Thorough market growth analysis of the market’s competitive landscape and detailed information about vendors
- Comprehensive market analysis and report on the factors that will challenge the market research and growth of market vendors
We can help! Our analysts can customize this market research report to meet your requirements.
1 Executive Summary
- 1.1 Market overview
- Exhibit 01: Executive Summary – Chart on Market Overview
- Exhibit 02: Executive Summary – Data Table on Market Overview
- Exhibit 03: Executive Summary – Chart on Global Market Characteristics
- Exhibit 04: Executive Summary – Chart on Market by Geography
- Exhibit 05: Executive Summary – Chart on Market Segmentation by Product
- Exhibit 06: Executive Summary – Chart on Market Segmentation by End-user
- Exhibit 07: Executive Summary – Chart on Incremental Growth
- Exhibit 08: Executive Summary – Data Table on Incremental Growth
- Exhibit 09: Executive Summary – Chart on Vendor Market Positioning
2 Market Landscape
- 2.1 Market ecosystem
- Exhibit 10: Parent market
- Exhibit 11: Market Characteristics
3 Market Sizing
- 3.1 Market definition
- Exhibit 12: Offerings of vendors included in the market definition
- 3.2 Market segment analysis
- Exhibit 13: Market segments
- 3.3 Market size 2022
- 3.4 Market outlook: Forecast for 2022-2027
- Exhibit 14: Chart on Global - Market size and forecast 2022-2027 ($ billion)
- Exhibit 15: Data Table on Global - Market size and forecast 2022-2027 ($ billion)
- Exhibit 16: Chart on Global Market: Year-over-year growth 2022-2027 (%)
- Exhibit 17: Data Table on Global Market: Year-over-year growth 2022-2027 (%)
4 Historic Market Size
- 4.1 Global commercial drones market 2017 - 2021
- Exhibit 18: Historic Market Size – Data Table on global commercial drones market 2017 - 2021 ($ billion)
- 4.2 Product Segment Analysis 2017 - 2021
- Exhibit 19: Historic Market Size – Product Segment 2017 - 2021 ($ billion)
- 4.3 End-user Segment Analysis 2017 - 2021
- Exhibit 20: Historic Market Size – End-user Segment 2017 - 2021 ($ billion)
- 4.4 Geography Segment Analysis 2017 - 2021
- Exhibit 21: Historic Market Size – Geography Segment 2017 - 2021 ($ billion)
- 4.5 Country Segment Analysis 2017 - 2021
- Exhibit 22: Historic Market Size – Country Segment 2017 - 2021 ($ billion)
5 Five Forces Analysis
- 5.1 Five forces summary
- Exhibit 23: Five forces analysis - Comparison between 2022 and 2027
- 5.2 Bargaining power of buyers
- Exhibit 24: Chart on Bargaining power of buyers – Impact of key factors 2022 and 2027
- 5.3 Bargaining power of suppliers
- Exhibit 25: Bargaining power of suppliers – Impact of key factors in 2022 and 2027
- 5.4 Threat of new entrants
- Exhibit 26: Threat of new entrants – Impact of key factors in 2022 and 2027
- 5.5 Threat of substitutes
- Exhibit 27: Threat of substitutes – Impact of key factors in 2022 and 2027
- 5.6 Threat of rivalry
- Exhibit 28: Threat of rivalry – Impact of key factors in 2022 and 2027
- 5.7 Market condition
- Exhibit 29: Chart on Market condition - Five forces 2022 and 2027
6 Market Segmentation by Product
- 6.1 Market segments
- Exhibit 30: Chart on Product - Market share 2022-2027 (%)
- Exhibit 31: Data Table on Product - Market share 2022-2027 (%)
- 6.2 Comparison by Product
- Exhibit 32: Chart on Comparison by Product
- Exhibit 33: Data Table on Comparison by Product
- 6.3 Software and services - Market size and forecast 2022-2027
- Exhibit 34: Chart on Software and services - Market size and forecast 2022-2027 ($ billion)
- Exhibit 35: Data Table on Software and services - Market size and forecast 2022-2027 ($ billion)
- Exhibit 36: Chart on Software and services - Year-over-year growth 2022-2027 (%)
- Exhibit 37: Data Table on Software and services - Year-over-year growth 2022-2027 (%)
- 6.4 Hardware - Market size and forecast 2022-2027
- Exhibit 38: Chart on Hardware - Market size and forecast 2022-2027 ($ billion)
- Exhibit 39: Data Table on Hardware - Market size and forecast 2022-2027 ($ billion)
- Exhibit 40: Chart on Hardware - Year-over-year growth 2022-2027 (%)
- Exhibit 41: Data Table on Hardware - Year-over-year growth 2022-2027 (%)
- 6.5 Market opportunity by Product
- Exhibit 42: Market opportunity by Product ($ billion)
- Exhibit 43: Data Table on Market opportunity by Product ($ billion)
7 Market Segmentation by End-user
- 7.1 Market segments
- Exhibit 44: Chart on End-user - Market share 2022-2027 (%)
- Exhibit 45: Data Table on End-user - Market share 2022-2027 (%)
- 7.2 Comparison by End-user
- Exhibit 46: Chart on Comparison by End-user
- Exhibit 47: Data Table on Comparison by End-user
- 7.3 Infrastructure - Market size and forecast 2022-2027
- Exhibit 48: Chart on Infrastructure - Market size and forecast 2022-2027 ($ billion)
- Exhibit 49: Data Table on Infrastructure - Market size and forecast 2022-2027 ($ billion)
- Exhibit 50: Chart on Infrastructure - Year-over-year growth 2022-2027 (%)
- Exhibit 51: Data Table on Infrastructure - Year-over-year growth 2022-2027 (%)
- 7.4 Media and entertainment - Market size and forecast 2022-2027
- Exhibit 52: Chart on Media and entertainment - Market size and forecast 2022-2027 ($ billion)
- Exhibit 53: Data Table on Media and entertainment - Market size and forecast 2022-2027 ($ billion)
- Exhibit 54: Chart on Media and entertainment - Year-over-year growth 2022-2027 (%)
- Exhibit 55: Data Table on Media and entertainment - Year-over-year growth 2022-2027 (%)
- 7.5 Public safety - Market size and forecast 2022-2027
- Exhibit 56: Chart on Public safety - Market size and forecast 2022-2027 ($ billion)
- Exhibit 57: Data Table on Public safety - Market size and forecast 2022-2027 ($ billion)
- Exhibit 58: Chart on Public safety - Year-over-year growth 2022-2027 (%)
- Exhibit 59: Data Table on Public safety - Year-over-year growth 2022-2027 (%)
- 7.6 Agriculture - Market size and forecast 2022-2027
- Exhibit 60: Chart on Agriculture - Market size and forecast 2022-2027 ($ billion)
- Exhibit 61: Data Table on Agriculture - Market size and forecast 2022-2027 ($ billion)
- Exhibit 62: Chart on Agriculture - Year-over-year growth 2022-2027 (%)
- Exhibit 63: Data Table on Agriculture - Year-over-year growth 2022-2027 (%)
- 7.7 Others - Market size and forecast 2022-2027
- Exhibit 64: Chart on Others - Market size and forecast 2022-2027 ($ billion)
- Exhibit 65: Data Table on Others - Market size and forecast 2022-2027 ($ billion)
- Exhibit 66: Chart on Others - Year-over-year growth 2022-2027 (%)
- Exhibit 67: Data Table on Others - Year-over-year growth 2022-2027 (%)
- 7.8 Market opportunity by End-user
- Exhibit 68: Market opportunity by End-user ($ billion)
- Exhibit 69: Data Table on Market opportunity by End-user ($ billion)
8 Customer Landscape
- 8.1 Customer landscape overview
- Exhibit 70: Analysis of price sensitivity, lifecycle, customer purchase basket, adoption rates, and purchase criteria
9 Geographic Landscape
- 9.1 Geographic segmentation
- Exhibit 71: Chart on Market share by geography 2022-2027 (%)
- Exhibit 72: Data Table on Market share by geography 2022-2027 (%)
- 9.2 Geographic comparison
- Exhibit 73: Chart on Geographic comparison
- Exhibit 74: Data Table on Geographic comparison
- 9.3 North America - Market size and forecast 2022-2027
- Exhibit 75: Chart on North America - Market size and forecast 2022-2027 ($ billion)
- Exhibit 76: Data Table on North America - Market size and forecast 2022-2027 ($ billion)
- Exhibit 77: Chart on North America - Year-over-year growth 2022-2027 (%)
- Exhibit 78: Data Table on North America - Year-over-year growth 2022-2027 (%)
- 9.4 Europe - Market size and forecast 2022-2027
- Exhibit 79: Chart on Europe - Market size and forecast 2022-2027 ($ billion)
- Exhibit 80: Data Table on Europe - Market size and forecast 2022-2027 ($ billion)
- Exhibit 81: Chart on Europe - Year-over-year growth 2022-2027 (%)
- Exhibit 82: Data Table on Europe - Year-over-year growth 2022-2027 (%)
- 9.5 APAC - Market size and forecast 2022-2027
- Exhibit 83: Chart on APAC - Market size and forecast 2022-2027 ($ billion)
- Exhibit 84: Data Table on APAC - Market size and forecast 2022-2027 ($ billion)
- Exhibit 85: Chart on APAC - Year-over-year growth 2022-2027 (%)
- Exhibit 86: Data Table on APAC - Year-over-year growth 2022-2027 (%)
- 9.6 Middle East and Africa - Market size and forecast 2022-2027
- Exhibit 87: Chart on Middle East and Africa - Market size and forecast 2022-2027 ($ billion)
- Exhibit 88: Data Table on Middle East and Africa - Market size and forecast 2022-2027 ($ billion)
- Exhibit 89: Chart on Middle East and Africa - Year-over-year growth 2022-2027 (%)
- Exhibit 90: Data Table on Middle East and Africa - Year-over-year growth 2022-2027 (%)
- 9.7 South America - Market size and forecast 2022-2027
- Exhibit 91: Chart on South America - Market size and forecast 2022-2027 ($ billion)
- Exhibit 92: Data Table on South America - Market size and forecast 2022-2027 ($ billion)
- Exhibit 93: Chart on South America - Year-over-year growth 2022-2027 (%)
- Exhibit 94: Data Table on South America - Year-over-year growth 2022-2027 (%)
- 9.8 US - Market size and forecast 2022-2027
- Exhibit 95: Chart on US - Market size and forecast 2022-2027 ($ billion)
- Exhibit 96: Data Table on US - Market size and forecast 2022-2027 ($ billion)
- Exhibit 97: Chart on US - Year-over-year growth 2022-2027 (%)
- Exhibit 98: Data Table on US - Year-over-year growth 2022-2027 (%)
- 9.9 China - Market size and forecast 2022-2027
- Exhibit 99: Chart on China - Market size and forecast 2022-2027 ($ billion)
- Exhibit 100: Data Table on China - Market size and forecast 2022-2027 ($ billion)
- Exhibit 101: Chart on China - Year-over-year growth 2022-2027 (%)
- Exhibit 102: Data Table on China - Year-over-year growth 2022-2027 (%)
- 9.10 France - Market size and forecast 2022-2027
- Exhibit 103: Chart on France - Market size and forecast 2022-2027 ($ billion)
- Exhibit 104: Data Table on France - Market size and forecast 2022-2027 ($ billion)
- Exhibit 105: Chart on France - Year-over-year growth 2022-2027 (%)
- Exhibit 106: Data Table on France - Year-over-year growth 2022-2027 (%)
- 9.11 UK - Market size and forecast 2022-2027
- Exhibit 107: Chart on UK - Market size and forecast 2022-2027 ($ billion)
- Exhibit 108: Data Table on UK - Market size and forecast 2022-2027 ($ billion)
- Exhibit 109: Chart on UK - Year-over-year growth 2022-2027 (%)
- Exhibit 110: Data Table on UK - Year-over-year growth 2022-2027 (%)
- 9.12 Japan - Market size and forecast 2022-2027
- Exhibit 111: Chart on Japan - Market size and forecast 2022-2027 ($ billion)
- Exhibit 112: Data Table on Japan - Market size and forecast 2022-2027 ($ billion)
- Exhibit 113: Chart on Japan - Year-over-year growth 2022-2027 (%)
- Exhibit 114: Data Table on Japan - Year-over-year growth 2022-2027 (%)
- 9.13 Market opportunity by geography
- Exhibit 115: Market opportunity by geography ($ billion)
- Exhibit 116: Data Tables on Market opportunity by geography ($ billion)
10 Drivers, Challenges, and Trends
- 10.1 Market drivers
- 10.2 Market challenges
- 10.3 Impact of drivers and challenges
- Exhibit 117: Impact of drivers and challenges in 2022 and 2027
- 10.4 Market trends
11 Vendor Landscape
- 11.1 Overview
- 11.2 Vendor landscape
- Exhibit 118: Overview on Criticality of inputs and Factors of differentiation
- 11.3 Landscape disruption
- Exhibit 119: Overview on factors of disruption
- 11.4 Industry risks
- Exhibit 120: Impact of key risks on business
12 Vendor Analysis
- 12.1 Vendors covered
- Exhibit 121: Vendors covered
- 12.2 Market positioning of vendors
- Exhibit 122: Matrix on vendor position and classification
- 12.3 Aeronavics
- Exhibit 123: Aeronavics - Overview
- Exhibit 124: Aeronavics - Product / Service
- Exhibit 125: Aeronavics - Key offerings
- 12.4 AeroVironment Inc.
- Exhibit 126: AeroVironment Inc. - Overview
- Exhibit 127: AeroVironment Inc. - Business segments
- Exhibit 128: AeroVironment Inc. - Key news
- Exhibit 129: AeroVironment Inc. - Key offerings
- Exhibit 130: AeroVironment Inc. - Segment focus
- 12.5 Arc Sky LLC
- Exhibit 131: Arc Sky LLC - Overview
- Exhibit 132: Arc Sky LLC - Product / Service
- Exhibit 133: Arc Sky LLC - Key offerings
- 12.6 Autel Robotics Co. Ltd.
- Exhibit 134: Autel Robotics Co. Ltd. - Overview
- Exhibit 135: Autel Robotics Co. Ltd. - Product / Service
- Exhibit 136: Autel Robotics Co. Ltd. - Key offerings
- 12.7 DELAIR SAS
- Exhibit 137: DELAIR SAS - Overview
- Exhibit 138: DELAIR SAS - Product / Service
- Exhibit 139: DELAIR SAS - Key offerings
- 12.8 Draganfly Inc.
- Exhibit 140: Draganfly Inc. - Overview
- Exhibit 141: Draganfly Inc. - Business segments
- Exhibit 142: Draganfly Inc. - Key offerings
- Exhibit 143: Draganfly Inc. - Segment focus
- 12.9 Field Group AS
- Exhibit 144: Field Group AS - Overview
- Exhibit 145: Field Group AS - Product / Service
- Exhibit 146: Field Group AS - Key offerings
- 12.10 Geotech Environmental Equipment Inc.
- Exhibit 147: Geotech Environmental Equipment Inc. - Overview
- Exhibit 148: Geotech Environmental Equipment Inc. - Product / Service
- Exhibit 149: Geotech Environmental Equipment Inc. - Key offerings
- 12.11 Guangzhou EHang Intelligent Technology Co. Ltd
- Exhibit 150: Guangzhou EHang Intelligent Technology Co. Ltd - Overview
- Exhibit 151: Guangzhou EHang Intelligent Technology Co. Ltd - Product / Service
- Exhibit 152: Guangzhou EHang Intelligent Technology Co. Ltd - Key news
- Exhibit 153: Guangzhou EHang Intelligent Technology Co. Ltd - Key offerings
- 12.12 iFlight Innovation Technology Ltd.
- Exhibit 154: iFlight Innovation Technology Ltd. - Overview
- Exhibit 155: iFlight Innovation Technology Ltd. - Product / Service
- Exhibit 156: iFlight Innovation Technology Ltd. - Key offerings
- 12.13 Parrot Drones SAS
- Exhibit 157: Parrot Drones SAS - Overview
- Exhibit 158: Parrot Drones SAS - Product / Service
- Exhibit 159: Parrot Drones SAS - Key offerings
- 12.14 Skydio Inc.
- Exhibit 160: Skydio Inc. - Overview
- Exhibit 161: Skydio Inc. - Product / Service
- Exhibit 162: Skydio Inc. - Key offerings
- 12.15 Teledyne Technologies Inc.
- Exhibit 163: Teledyne Technologies Inc. - Overview
- Exhibit 164: Teledyne Technologies Inc. - Business segments
- Exhibit 165: Teledyne Technologies Inc. - Key news
- Exhibit 166: Teledyne Technologies Inc. - Key offerings
- Exhibit 167: Teledyne Technologies Inc. - Segment focus
- 12.16 The Boeing Co.
- Exhibit 168: The Boeing Co. - Overview
- Exhibit 169: The Boeing Co. - Business segments
- Exhibit 170: The Boeing Co. - Key offerings
- Exhibit 171: The Boeing Co. - Segment focus
- 12.17 Yuneec International Co. Ltd.
- Exhibit 172: Yuneec International Co. Ltd. - Overview
- Exhibit 173: Yuneec International Co. Ltd. - Product / Service
- Exhibit 174: Yuneec International Co. Ltd. - Key news
- Exhibit 175: Yuneec International Co. Ltd. - Key offerings
13 Appendix
- 13.1 Scope of the report
- 13.2 Inclusions and exclusions checklist
- Exhibit 176: Inclusions checklist
- Exhibit 177: Exclusions checklist
- 13.3 Currency conversion rates for US$
- Exhibit 178: Currency conversion rates for US$
- 13.4 Research methodology
- Exhibit 179: Research methodology
- Exhibit 180: Validation techniques employed for market sizing
- Exhibit 181: Information sources
- 13.5 List of abbreviations
- Exhibit 182: List of abbreviations
Research Framework
Technavio presents a detailed picture of the market by way of study, synthesis, and summation of data from multiple sources. The analysts have presented the various facets of the market with a particular focus on identifying the key industry influencers. The data thus presented is comprehensive, reliable, and the result of extensive research, both primary and secondary.
INFORMATION SOURCES
Primary sources
- Manufacturers and suppliers
- Channel partners
- Industry experts
- Strategic decision makers
Secondary sources
- Industry journals and periodicals
- Government data
- Financial reports of key industry players
- Historical data
- Press releases
DATA ANALYSIS
Data Synthesis
- Collation of data
- Estimation of key figures
- Analysis of derived insights
Data Validation
- Triangulation with data models
- Reference against proprietary databases
- Corroboration with industry experts
REPORT WRITING
Qualitative
- Market drivers
- Market challenges
- Market trends
- Five forces analysis
Quantitative
- Market size and forecast
- Market segmentation
- Geographical insights
- Competitive landscape
PURCHASE FULL REPORT OF
commercial drones market market
Key Questions Answered
- What are the key global market and the regional market share?
- What are the revenue-generating key market segments?
- What are the key factors driving and challenging this market’s growth?
- Who are the key market vendors and their growth strategies?
- What are the latest trends influencing the growth of this market?
- What are the variables influencing the market growth in the primary regions?
- What are the factors influencing the growth of the parent market?
Why should you prefer Technavio's market insights report?
- Off-the-shelf research reports
- Reports can be tailored to meet the customer's needs
- Trusted by more than 100 fortune 500 organizations
- Information about the market's key drivers, trends, and challenges
- Parent market analysis
- Every week, 50,000 people visit our subscription platform
- Detailed vendors report with competitive landscape
- Covid-19 impact and recovery analysis
- Data on revenue-generating market segments
- Details on the market shares of various regions
- Five-force market analysis