Content Protection Market Analysis North America, Europe, APAC, South America, Middle East and Africa - US, Canada, China, UK, France - Size and Forecast 2024-2028
| Published: Nov 2023 | Pages: 164 | SKU: IRTNTR76749 |
Content Protection Market 2024-2028
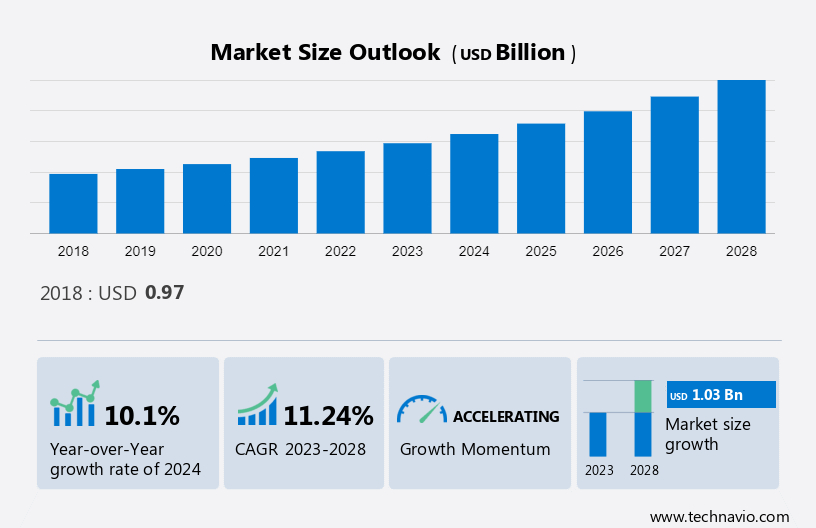
The content protection market size is estimated to grow at a CAGR of 11.24% between 2023 and 2028. The market size is forecast to increase by USD 1.03 billion.The market is categorized based on End-user, Type, and Geography. Within the End-User Segment, the Large Enterprise sub-category represented the largest value, amounting to USD 585.78 million in 2018. Large enterprises are increasingly seeking enhanced flexibility and scalability within their content protection solutions. As businesses generate ever-growing amounts of content, opting for content protection provides a versatile and adaptable choice. This enables enterprises to swiftly adjust their content protection solutions to match evolving needs, whether scaling up or down as required.These factors are set to grow of Content protection market for large enterprise segment. The market size, historical data (2018-2022), and future forecasts are presented in terms of value USD million for all these mentioned segments.
What will be the Size of the Content Protection Market During the Forecast Period?
For More Highlights About this Report, Download Free Sample in a Minute
Content Protection Market: Key Drivers, Trends and Challenges
Market Driver
An increase in the adoption of content among various industries is notably driving market growth. Content protection solutions have become a crucial aspect of modern businesses. The adoption of content protection solutions is gaining traction among various industries, such as IT and BFSI, for all the right reasons. The industry is witnessing heightened demand for content protection solutions as businesses recognize the need to safeguard their sensitive data from cyber threats and breaches. One of the main reasons for the increase in the adoption of content protection as a service is the growing number of cyber threats. With the increasing sophistication of cyber-attacks and the rise of content breaches, businesses need to invest in advanced security measures to protect their content from potential threats. The adoption of content protection as a service allows businesses to leverage expertise and resources from third-party providers, who are specialists in content protection solutions.
Moreover, the adoption of data protection as a service can help businesses scale according to their needs. As businesses grow, they generate more content, and the complexity of content protection increases. Third-party service providers offer various solutions, such as managed backup and recovery, to ensure that businesses can protect their content reliably. These solutions are flexible and can be customized as per the needs of individual companies, making the service an attractive proposition for businesses looking to scale their IT infrastructure. Thus, the abovementioned factors are expected to increase the demand for data protection solutions, which will propel the growth of the global content protection market during the forecast period.
Market Trends
The rise in the number of cyber threats is an emerging trend shaping the market growth. In today's digital era, advances in technology have changed the way cyberattacks are carried out. This makes enterprises more vulnerable to cybercrimes. Cyberattacks can significantly affect business operations as companies have become highly reliant on technology to maintain a competitive advantage and manage costs. Enterprises, whether large or small, can become a target of cyberattacks. Thus, it is imperative for businesses to take preventative measures and adopt an approach to cybersecurity, which helps in minimizing risks. Hence, backing up their business data can help enterprises recover if they lose some data in a cyberattack.
In addition, content protection solutions are expected to help enterprises minimize the damage in the event of a full-blown cyberattack. Moreover, backing up data using a content protection solution is generally easy and very cost-effective. Thus, the abovementioned factors are expected to fuel the growth of the global content protection market during the forecast period.
Market Challenge
The possibility of failure during implementation is a significant challenge hindering the market growth. One of the main growth inhibitors in the global content protection market is the chance of failure during the implementation phase. This makes prospective clients sceptical about content protection solutions, and they may favour traditional backup solutions, such as hard disks. Implementation is not a one-way process; it takes a considerable amount of time to perform various processes, such as project management, vulnerability management, compliance, content management, event monitoring, access management, and managing huge servers and databases. These processes are complex and require flawless execution.
In addition, during the planning phase, service providers need to finalize the devices needed, their locations in the clients' architecture, and their proper configuration. This process is cumbersome, especially in the case of large enterprises with widespread operations and exponentially expanding data. The complexity of implementing content protection solutions increases the chances of failure, which is expected to direct end-users toward traditional backup solutions. Thus, the abovementioned factors are expected to hinder the growth of the global content protection market during the forecast period.
Content Protection Market Customer Landscape
The market research analysis report includes the adoption lifecycle of the market, covering from the innovator’s stage to the laggard’s stage. It focuses on adoption rates in different regions based on penetration. Furthermore, the report also includes key purchase criteria and drivers of price sensitivity to help companies evaluate and develop their growth strategies.
Global Content Protection Market Customer Landscape
Who are the Major Content Protection Market Companies?
Companies are implementing various strategies, such as strategic alliances, partnerships, mergers and acquisitions, geographical expansion, and product/service launches, to enhance their presence in the market.
Adobe Inc. - The company offers content protection solution through Adobe Media Server.
The research report also includes detailed analyses of the competitive landscape of the market and information about 20 market companies, including:
- Alphabet Inc.
- Axinom GmbH
- Cisco Systems Inc.
- CommScope Holding Co. Inc.
- Digimarc Corp.
- EZDRM Inc.
- Friend MTS Ltd.
- Intel Corp.
- Intertrust Technologies Corp.
- Kudelski SA
- Locklizard Ltd.
- Microsoft Corp.
- NASPERS Ltd.
- RGB Spectrum
- Sony Group Corp.
- STMicroelectronics International N.V.
- Verance Corp.
- Verimatrix Inc.
- Wellav Technologies Ltd.
Qualitative and quantitative analysis of companies has been conducted to help clients understand the wider business environment as well as the strengths and weaknesses of key market players. Data is qualitatively analyzed to categorize companies as pure play, category-focused, industry-focused, and diversified; it is quantitatively analyzed to categorize companies as dominant, leading, strong, tentative, and weak.
What are the Largest-Growing Segments in the Content Protection Market?
The large enterprise segment is estimated to witness significant growth during the forecast period.
Get a glance at the market contribution of various segments Download the PDF Sample
The growing adoption of content protection among large enterprises is the need for better security. Data breaches and cyber-attacks are becoming increasingly common, and large enterprises are acutely aware of the potential damage that can be done if their critical data or content falls into the wrong hands. In addition, large enterprises are also turning to content protection to reduce costs. Traditional data protection solutions can be expensive, requiring significant investments in hardware, software, and personnel. Content protection, on the other hand, offers a more cost-effective alternative with a predictable subscription-based pricing structure that allows businesses to better manage their budgets. Thus, the abovementioned factors are expected to drive the growth of the large enterprise segment in the global content protection market during the forecast period.
Which are the Key Regions for the Content Protection Market?
For more insights on the market share of various regions Download PDF Sample now!
North America is estimated to contribute 38% to the growth of the global market during the forecast period. Technavio’s analysts have elaborately explained the regional trends and drivers that shape the market during the forecast period. North America holds a significant share in the global content protection market. The increasing adoption of cloud-based technologies and virtualization in North America has encouraged businesses to adopt content protection solutions. Companies are increasingly relying on cloud-based services to store and process data or content. This has resulted in a need for cloud-based content protection solutions that can safeguard the content stored in virtualized environments. The regional TV broadcasting services in the region are transforming digitally due to factors such as the rising number of offerings from various UHD TV vendors in this region. The UHD TV models are increasingly captivating consumer attention, thereby accelerating the demand for pay-TV services, which, in turn, drive the demand for conditional access systems in the region.
Moreover, the rising number of cyberattacks will gradually increase the adoption of security measures such as data encryption management solutions by enterprises, which will focus on not compromising their business continuity. The need for adherence to stringent regulations will also increase the demand for encryption management solutions in North America, in turn, propelling the growth of the content protection market in the region during the forecast period.
The outbreak of COVID-19 in 2020 positively impacted the growth of the global content protection market. Moreover, the rapid vaccination drives that were conducted by the government across the region in the first half of 2021 resulted in the removal of the lockdown. The resumption of business operations in all industries, such as manufacturing, banking and finance, energy and power, retail, and consumer goods, raised the growth momentum of the global content protection market, and this trend will continue to positively impact market growth during the forecast period.
Segment Overview
The content protection market report forecasts market growth by revenue at global, regional & country levels and provides an analysis of the latest trends and growth opportunities from 2018 to 2028.
- End-user Outlook
- Large enterprise
- Small
- Medium enterprise
- Type Outlook
- Conditional access systems
- Digital rights management
- Digital watermarking
- Others
- Region Outlook
- North America
- The U.S.
- Canada
- South America
- Chile
- Brazil
- Argentina
- Europe
- U.K.
- Germany
- France
- Rest of Europe
- APAC
- China
- India
- Middle East & Africa
- Saudi Arabia
- South Africa
- Rest of the Middle East & Africa
- North America
|
Content Protection Market Scope |
|
|
Report Coverage |
Details |
|
Page number |
164 |
|
Base year |
2023 |
|
Historic period |
2018-2022 |
|
Forecast period |
2024-2028 |
|
Growth momentum & CAGR |
Accelerate at a CAGR of 11.24% |
|
Market Growth 2024-2028 |
USD 1.03 billion |
|
Market structure |
Fragmented |
|
YoY growth 2023-2024(%) |
10.1 |
|
Regional analysis |
North America, Europe, APAC, South America, and Middle East and Africa |
|
Performing market contribution |
North America at 38% |
|
Key countries |
US, Canada, China, UK, and France |
|
Competitive landscape |
Leading Companies, Market Positioning of Companies, Competitive Strategies, and Industry Risks |
|
Key companies profiled |
Adobe Inc., Alphabet Inc., Axinom GmbH, Cisco Systems Inc., CommScope Holding Co. Inc., Digimarc Corp., EZDRM Inc., Friend MTS Ltd., Intel Corp., Intertrust Technologies Corp., Kudelski SA, Locklizard Ltd., Microsoft Corp., NASPERS Ltd., RGB Spectrum, Sony Group Corp., STMicroelectronics International N.V., Verance Corp., Verimatrix Inc., and Wellav Technologies Ltd. |
|
Market dynamics |
Parent market analysis, Market growth inducers and obstacles, Fast-growing and slow-growing segment analysis, COVID-19 impact and recovery analysis and future consumer dynamics, Market condition analysis for the forecast period |
|
Customization purview |
If our report has not included the data that you are looking for, you can reach out to our analysts and get segments customized. |
What are the Key Data Covered in this Content Protection Market Research Report?
- CAGR of the market during the forecast period
- Detailed information on factors that will drive the growth of the market between 2024 and 2028
- Precise estimation of the market size and its contribution to the market in focus on the parent market
- Accurate predictions about upcoming trends and changes in consumer behaviour
- Growth of the market across North America, Europe, APAC, South America, and Middle East and Africa
- A thorough analysis of the market’s competitive landscape and detailed information about companies
- Comprehensive analysis of factors that will challenge the growth of market companies
We can help! Our analysts can customize this market research report to meet your requirements.
1 Executive Summary
- 1.1 Market overview
- Exhibit 01: Executive Summary – Chart on Market Overview
- Exhibit 02: Executive Summary – Data Table on Market Overview
- Exhibit 03: Executive Summary – Chart on Global Market Characteristics
- Exhibit 04: Executive Summary – Chart on Market by Geography
- Exhibit 05: Executive Summary – Chart on Market Segmentation by End-user
- Exhibit 06: Executive Summary – Chart on Market Segmentation by Type
- Exhibit 07: Executive Summary – Chart on Incremental Growth
- Exhibit 08: Executive Summary – Data Table on Incremental Growth
- Exhibit 09: Executive Summary – Chart on Vendor Market Positioning
2 Market Landscape
- 2.1 Market ecosystem
- Exhibit 10: Parent market
- Exhibit 11: Market Characteristics
3 Market Sizing
- 3.1 Market definition
- Exhibit 12: Offerings of vendors included in the market definition
- 3.2 Market segment analysis
- Exhibit 13: Market segments
- 3.3 Market size 2023
- 3.4 Market outlook: Forecast for 2023-2028
- Exhibit 14: Chart on Global - Market size and forecast 2023-2028 ($ billion)
- Exhibit 15: Data Table on Global - Market size and forecast 2023-2028 ($ billion)
- Exhibit 16: Chart on Global Market: Year-over-year growth 2023-2028 (%)
- Exhibit 17: Data Table on Global Market: Year-over-year growth 2023-2028 (%)
4 Historic Market Size
- 4.1 Global content protection market 2018 - 2022
- Exhibit 18: Historic Market Size – Data Table on global content protection market 2018 - 2022 ($ billion)
- 4.2 End-user Segment Analysis 2018 - 2022
- Exhibit 19: Historic Market Size – End-user Segment 2018 - 2022 ($ billion)
- 4.3 Type Segment Analysis 2018 - 2022
- Exhibit 20: Historic Market Size – Type Segment 2018 - 2022 ($ billion)
- 4.4 Geography Segment Analysis 2018 - 2022
- Exhibit 21: Historic Market Size – Geography Segment 2018 - 2022 ($ billion)
- 4.5 Country Segment Analysis 2018 - 2022
- Exhibit 22: Historic Market Size – Country Segment 2018 - 2022 ($ billion)
5 Five Forces Analysis
- 5.1 Five forces summary
- Exhibit 23: Five forces analysis - Comparison between 2023 and 2028
- 5.2 Bargaining power of buyers
- Exhibit 24: Chart on Bargaining power of buyers – Impact of key factors 2023 and 2028
- 5.3 Bargaining power of suppliers
- Exhibit 25: Bargaining power of suppliers – Impact of key factors in 2023 and 2028
- 5.4 Threat of new entrants
- Exhibit 26: Threat of new entrants – Impact of key factors in 2023 and 2028
- 5.5 Threat of substitutes
- Exhibit 27: Threat of substitutes – Impact of key factors in 2023 and 2028
- 5.6 Threat of rivalry
- Exhibit 28: Threat of rivalry – Impact of key factors in 2023 and 2028
- 5.7 Market condition
- Exhibit 29: Chart on Market condition - Five forces 2023 and 2028
6 Market Segmentation by End-user
- 6.1 Market segments
- Exhibit 30: Chart on End-user - Market share 2023-2028 (%)
- Exhibit 31: Data Table on End-user - Market share 2023-2028 (%)
- 6.2 Comparison by End-user
- Exhibit 32: Chart on Comparison by End-user
- Exhibit 33: Data Table on Comparison by End-user
- 6.3 Large enterprise - Market size and forecast 2023-2028
- Exhibit 34: Chart on Large enterprise - Market size and forecast 2023-2028 ($ billion)
- Exhibit 35: Data Table on Large enterprise - Market size and forecast 2023-2028 ($ billion)
- Exhibit 36: Chart on Large enterprise - Year-over-year growth 2023-2028 (%)
- Exhibit 37: Data Table on Large enterprise - Year-over-year growth 2023-2028 (%)
- 6.4 Small and medium enterprise - Market size and forecast 2023-2028
- Exhibit 38: Chart on Small and medium enterprise - Market size and forecast 2023-2028 ($ billion)
- Exhibit 39: Data Table on Small and medium enterprise - Market size and forecast 2023-2028 ($ billion)
- Exhibit 40: Chart on Small and medium enterprise - Year-over-year growth 2023-2028 (%)
- Exhibit 41: Data Table on Small and medium enterprise - Year-over-year growth 2023-2028 (%)
- 6.5 Market opportunity by End-user
- Exhibit 42: Market opportunity by End-user ($ billion)
- Exhibit 43: Data Table on Market opportunity by End-user ($ billion)
7 Market Segmentation by Type
- 7.1 Market segments
- Exhibit 44: Chart on Type - Market share 2023-2028 (%)
- Exhibit 45: Data Table on Type - Market share 2023-2028 (%)
- 7.2 Comparison by Type
- Exhibit 46: Chart on Comparison by Type
- Exhibit 47: Data Table on Comparison by Type
- 7.3 Conditional access systems - Market size and forecast 2023-2028
- Exhibit 48: Chart on Conditional access systems - Market size and forecast 2023-2028 ($ billion)
- Exhibit 49: Data Table on Conditional access systems - Market size and forecast 2023-2028 ($ billion)
- Exhibit 50: Chart on Conditional access systems - Year-over-year growth 2023-2028 (%)
- Exhibit 51: Data Table on Conditional access systems - Year-over-year growth 2023-2028 (%)
- 7.4 Digital rights management - Market size and forecast 2023-2028
- Exhibit 52: Chart on Digital rights management - Market size and forecast 2023-2028 ($ billion)
- Exhibit 53: Data Table on Digital rights management - Market size and forecast 2023-2028 ($ billion)
- Exhibit 54: Chart on Digital rights management - Year-over-year growth 2023-2028 (%)
- Exhibit 55: Data Table on Digital rights management - Year-over-year growth 2023-2028 (%)
- 7.5 Digital watermarking - Market size and forecast 2023-2028
- Exhibit 56: Chart on Digital watermarking - Market size and forecast 2023-2028 ($ billion)
- Exhibit 57: Data Table on Digital watermarking - Market size and forecast 2023-2028 ($ billion)
- Exhibit 58: Chart on Digital watermarking - Year-over-year growth 2023-2028 (%)
- Exhibit 59: Data Table on Digital watermarking - Year-over-year growth 2023-2028 (%)
- 7.6 Others - Market size and forecast 2023-2028
- Exhibit 60: Chart on Others - Market size and forecast 2023-2028 ($ billion)
- Exhibit 61: Data Table on Others - Market size and forecast 2023-2028 ($ billion)
- Exhibit 62: Chart on Others - Year-over-year growth 2023-2028 (%)
- Exhibit 63: Data Table on Others - Year-over-year growth 2023-2028 (%)
- 7.7 Market opportunity by Type
- Exhibit 64: Market opportunity by Type ($ billion)
- Exhibit 65: Data Table on Market opportunity by Type ($ billion)
8 Customer Landscape
- 8.1 Customer landscape overview
- Exhibit 66: Analysis of price sensitivity, lifecycle, customer purchase basket, adoption rates, and purchase criteria
9 Geographic Landscape
- 9.1 Geographic segmentation
- Exhibit 67: Chart on Market share by geography 2023-2028 (%)
- Exhibit 68: Data Table on Market share by geography 2023-2028 (%)
- 9.2 Geographic comparison
- Exhibit 69: Chart on Geographic comparison
- Exhibit 70: Data Table on Geographic comparison
- 9.3 North America - Market size and forecast 2023-2028
- Exhibit 71: Chart on North America - Market size and forecast 2023-2028 ($ billion)
- Exhibit 72: Data Table on North America - Market size and forecast 2023-2028 ($ billion)
- Exhibit 73: Chart on North America - Year-over-year growth 2023-2028 (%)
- Exhibit 74: Data Table on North America - Year-over-year growth 2023-2028 (%)
- 9.4 Europe - Market size and forecast 2023-2028
- Exhibit 75: Chart on Europe - Market size and forecast 2023-2028 ($ billion)
- Exhibit 76: Data Table on Europe - Market size and forecast 2023-2028 ($ billion)
- Exhibit 77: Chart on Europe - Year-over-year growth 2023-2028 (%)
- Exhibit 78: Data Table on Europe - Year-over-year growth 2023-2028 (%)
- 9.5 APAC - Market size and forecast 2023-2028
- Exhibit 79: Chart on APAC - Market size and forecast 2023-2028 ($ billion)
- Exhibit 80: Data Table on APAC - Market size and forecast 2023-2028 ($ billion)
- Exhibit 81: Chart on APAC - Year-over-year growth 2023-2028 (%)
- Exhibit 82: Data Table on APAC - Year-over-year growth 2023-2028 (%)
- 9.6 South America - Market size and forecast 2023-2028
- Exhibit 83: Chart on South America - Market size and forecast 2023-2028 ($ billion)
- Exhibit 84: Data Table on South America - Market size and forecast 2023-2028 ($ billion)
- Exhibit 85: Chart on South America - Year-over-year growth 2023-2028 (%)
- Exhibit 86: Data Table on South America - Year-over-year growth 2023-2028 (%)
- 9.7 Middle East and Africa - Market size and forecast 2023-2028
- Exhibit 87: Chart on Middle East and Africa - Market size and forecast 2023-2028 ($ billion)
- Exhibit 88: Data Table on Middle East and Africa - Market size and forecast 2023-2028 ($ billion)
- Exhibit 89: Chart on Middle East and Africa - Year-over-year growth 2023-2028 (%)
- Exhibit 90: Data Table on Middle East and Africa - Year-over-year growth 2023-2028 (%)
- 9.8 US - Market size and forecast 2023-2028
- Exhibit 91: Chart on US - Market size and forecast 2023-2028 ($ billion)
- Exhibit 92: Data Table on US - Market size and forecast 2023-2028 ($ billion)
- Exhibit 93: Chart on US - Year-over-year growth 2023-2028 (%)
- Exhibit 94: Data Table on US - Year-over-year growth 2023-2028 (%)
- 9.9 China - Market size and forecast 2023-2028
- Exhibit 95: Chart on China - Market size and forecast 2023-2028 ($ billion)
- Exhibit 96: Data Table on China - Market size and forecast 2023-2028 ($ billion)
- Exhibit 97: Chart on China - Year-over-year growth 2023-2028 (%)
- Exhibit 98: Data Table on China - Year-over-year growth 2023-2028 (%)
- 9.10 UK - Market size and forecast 2023-2028
- Exhibit 99: Chart on UK - Market size and forecast 2023-2028 ($ billion)
- Exhibit 100: Data Table on UK - Market size and forecast 2023-2028 ($ billion)
- Exhibit 101: Chart on UK - Year-over-year growth 2023-2028 (%)
- Exhibit 102: Data Table on UK - Year-over-year growth 2023-2028 (%)
- 9.11 France - Market size and forecast 2023-2028
- Exhibit 103: Chart on France - Market size and forecast 2023-2028 ($ billion)
- Exhibit 104: Data Table on France - Market size and forecast 2023-2028 ($ billion)
- Exhibit 105: Chart on France - Year-over-year growth 2023-2028 (%)
- Exhibit 106: Data Table on France - Year-over-year growth 2023-2028 (%)
- 9.12 Canada - Market size and forecast 2023-2028
- Exhibit 107: Chart on Canada - Market size and forecast 2023-2028 ($ billion)
- Exhibit 108: Data Table on Canada - Market size and forecast 2023-2028 ($ billion)
- Exhibit 109: Chart on Canada - Year-over-year growth 2023-2028 (%)
- Exhibit 110: Data Table on Canada - Year-over-year growth 2023-2028 (%)
- 9.13 Market opportunity by geography
- Exhibit 111: Market opportunity by geography ($ billion)
- Exhibit 112: Data Tables on Market opportunity by geography ($ billion)
10 Drivers, Challenges, and Trends
- 10.1 Market drivers
- 10.2 Market challenges
- 10.3 Impact of drivers and challenges
- Exhibit 113: Impact of drivers and challenges in 2023 and 2028
- 10.4 Market trends
11 Vendor Landscape
- 11.1 Overview
- 11.2 Vendor landscape
- Exhibit 114: Overview on Criticality of inputs and Factors of differentiation
- 11.3 Landscape disruption
- Exhibit 115: Overview on factors of disruption
- 11.4 Industry risks
- Exhibit 116: Impact of key risks on business
12 Vendor Analysis
- 12.1 Vendors covered
- Exhibit 117: Vendors covered
- 12.2 Market positioning of vendors
- Exhibit 118: Matrix on vendor position and classification
- 12.3 Adobe Inc.
- Exhibit 119: Adobe Inc. - Overview
- Exhibit 120: Adobe Inc. - Business segments
- Exhibit 121: Adobe Inc. - Key offerings
- Exhibit 122: Adobe Inc. - Segment focus
- 12.4 Alphabet Inc.
- Exhibit 123: Alphabet Inc. - Overview
- Exhibit 124: Alphabet Inc. - Business segments
- Exhibit 125: Alphabet Inc. - Key news
- Exhibit 126: Alphabet Inc. - Key offerings
- Exhibit 127: Alphabet Inc. - Segment focus
- 12.5 Cisco Systems Inc.
- Exhibit 128: Cisco Systems Inc. - Overview
- Exhibit 129: Cisco Systems Inc. - Business segments
- Exhibit 130: Cisco Systems Inc. - Key news
- Exhibit 131: Cisco Systems Inc. - Key offerings
- Exhibit 132: Cisco Systems Inc. - Segment focus
- 12.6 CommScope Holding Co. Inc.
- Exhibit 133: CommScope Holding Co. Inc. - Overview
- Exhibit 134: CommScope Holding Co. Inc. - Business segments
- Exhibit 135: CommScope Holding Co. Inc. - Key news
- Exhibit 136: CommScope Holding Co. Inc. - Key offerings
- Exhibit 137: CommScope Holding Co. Inc. - Segment focus
- 12.7 Digimarc Corp.
- Exhibit 138: Digimarc Corp. - Overview
- Exhibit 139: Digimarc Corp. - Product / Service
- Exhibit 140: Digimarc Corp. - Key offerings
- 12.8 Intel Corp.
- Exhibit 141: Intel Corp. - Overview
- Exhibit 142: Intel Corp. - Business segments
- Exhibit 143: Intel Corp. - Key news
- Exhibit 144: Intel Corp. - Key offerings
- Exhibit 145: Intel Corp. - Segment focus
- 12.9 Intertrust Technologies Corp.
- Exhibit 146: Intertrust Technologies Corp. - Overview
- Exhibit 147: Intertrust Technologies Corp. - Product / Service
- Exhibit 148: Intertrust Technologies Corp. - Key offerings
- 12.10 Kudelski SA
- Exhibit 149: Kudelski SA - Overview
- Exhibit 150: Kudelski SA - Business segments
- Exhibit 151: Kudelski SA - Key offerings
- Exhibit 152: Kudelski SA - Segment focus
- 12.11 Microsoft Corp.
- Exhibit 153: Microsoft Corp. - Overview
- Exhibit 154: Microsoft Corp. - Business segments
- Exhibit 155: Microsoft Corp. - Key news
- Exhibit 156: Microsoft Corp. - Key offerings
- Exhibit 157: Microsoft Corp. - Segment focus
- 12.12 NASPERS Ltd.
- Exhibit 158: NASPERS Ltd. - Overview
- Exhibit 159: NASPERS Ltd. - Business segments
- Exhibit 160: NASPERS Ltd. - Key offerings
- Exhibit 161: NASPERS Ltd. - Segment focus
- 12.13 Sony Group Corp.
- Exhibit 162: Sony Group Corp. - Overview
- Exhibit 163: Sony Group Corp. - Business segments
- Exhibit 164: Sony Group Corp. - Key news
- Exhibit 165: Sony Group Corp. - Key offerings
- Exhibit 166: Sony Group Corp. - Segment focus
- 12.14 STMicroelectronics International N.V.
- Exhibit 167: STMicroelectronics International N.V. - Overview
- Exhibit 168: STMicroelectronics International N.V. - Business segments
- Exhibit 169: STMicroelectronics International N.V. - Key news
- Exhibit 170: STMicroelectronics International N.V. - Key offerings
- Exhibit 171: STMicroelectronics International N.V. - Segment focus
- 12.15 Verance Corp.
- Exhibit 172: Verance Corp. - Overview
- Exhibit 173: Verance Corp. - Product / Service
- Exhibit 174: Verance Corp. - Key offerings
- 12.16 Verimatrix Inc.
- Exhibit 175: Verimatrix Inc. - Overview
- Exhibit 176: Verimatrix Inc. - Product / Service
- Exhibit 177: Verimatrix Inc. - Key offerings
- 12.17 Wellav Technologies Ltd.
- Exhibit 178: Wellav Technologies Ltd. - Overview
- Exhibit 179: Wellav Technologies Ltd. - Product / Service
- Exhibit 180: Wellav Technologies Ltd. - Key offerings
13 Appendix
- 13.1 Scope of the report
- 13.2 Inclusions and exclusions checklist
- Exhibit 181: Inclusions checklist
- Exhibit 182: Exclusions checklist
- 13.3 Currency conversion rates for US$
- Exhibit 183: Currency conversion rates for US$
- 13.4 Research methodology
- Exhibit 184: Research methodology
- Exhibit 185: Validation techniques employed for market sizing
- Exhibit 186: Information sources
- 13.5 List of abbreviations
- Exhibit 187: List of abbreviations
Research Framework
Technavio presents a detailed picture of the market by way of study, synthesis, and summation of data from multiple sources. The analysts have presented the various facets of the market with a particular focus on identifying the key industry influencers. The data thus presented is comprehensive, reliable, and the result of extensive research, both primary and secondary.
INFORMATION SOURCES
Primary sources
- Manufacturers and suppliers
- Channel partners
- Industry experts
- Strategic decision makers
Secondary sources
- Industry journals and periodicals
- Government data
- Financial reports of key industry players
- Historical data
- Press releases
DATA ANALYSIS
Data Synthesis
- Collation of data
- Estimation of key figures
- Analysis of derived insights
Data Validation
- Triangulation with data models
- Reference against proprietary databases
- Corroboration with industry experts
REPORT WRITING
Qualitative
- Market drivers
- Market challenges
- Market trends
- Five forces analysis
Quantitative
- Market size and forecast
- Market segmentation
- Geographical insights
- Competitive landscape
PURCHASE FULL REPORT OF
content protection market market
Key Questions Answered
- What are the key global market and the regional market share?
- What are the revenue-generating key market segments?
- What are the key factors driving and challenging this market’s growth?
- Who are the key market vendors and their growth strategies?
- What are the latest trends influencing the growth of this market?
- What are the variables influencing the market growth in the primary regions?
- What are the factors influencing the growth of the parent market?
Why should you prefer Technavio's market insights report?
- Off-the-shelf research reports
- Reports can be tailored to meet the customer's needs
- Trusted by more than 100 fortune 500 organizations
- Information about the market's key drivers, trends, and challenges
- Parent market analysis
- Every week, 50,000 people visit our subscription platform
- Detailed vendors report with competitive landscape
- Covid-19 impact and recovery analysis
- Data on revenue-generating market segments
- Details on the market shares of various regions
- Five-force market analysis