Cyber Insurance Market Analysis North America, Europe, APAC, South America, Middle East and Africa - US, Canada, China, Germany, UK - Size and Forecast 2023-2027
| Published: Feb 2023 | Pages: 160 | SKU: IRTNTR74988 |
Cyber Insurance Market Forecast 2023-2027
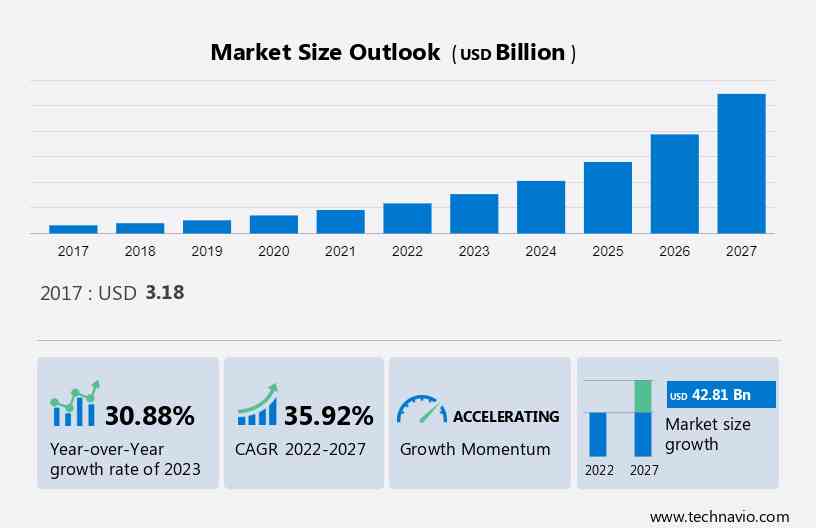
The Global Cyber Insurance Market size is estimated to grow by USD 42.81 billion, growing at a CAGR of 35.92% between 2022 and 2027. The growth of the market depends on several factors, including the adoption of technology, the growing awareness among businesses and individuals, and the government's initiatives to promote cyber insurance.
Rising cyber-attack threats have spiked demand. With more digital reliance, the need to shield against financial and reputational hits from cybercrime has surged. Businesses and individuals seek coverage to cope with increasing risks. In addition to the financial benefits, many businesses and individuals are recognizing the reputational benefits of having coverage. This trend fuels market growth by addressing the attack aftermath and offering financial protection.
Companies are implementing various strategies, such as strategic alliances, partnerships, mergers and acquisitions, geographical expansion, and product/service launches, to enhance their presence in the market. American International Group Inc the company offers solutions for cyber insurance that helps to minimize risk exposure and effectively determine and mitigate silent cyber exposure by systemically reducing accumulation risks.
Cyber Insurance Market Growth and Analysis
To learn more about this report, Download Report Sample
Market Overview :
The adoption of technology is notably driving the market growth, although factors such as lack of standardization may impede the market growth. Our researchers analyzed the data with 2022 as the base year, along with the key drivers, trends, and challenges. A holistic analysis of drivers will help companies refine their marketing strategies to gain a competitive advantage.
Key Driver
The widespread adoption of technology has significantly impacted the growth of the global market share. The increasing use of digital services and the Internet has created new opportunities for cybercriminals, increasing the frequency and severity of cyber-attacks. This has led to increased demand as individuals are looking to protect themselves against the potential financial impact of cybercrime. With the growing number of connected devices, cloud-based services, and mobile applications, the exposure to cyber risks is increasing. The increased use of technology has also led to the growth of the digital economy, with businesses and individuals relying on the Internet to conduct transactions, store and process data, and manage their finances.
Moreover, the adoption of technology has also made it more challenging for businesses and individuals to secure their systems and data, leading to a greater need. Cyber insurance policies typically provide coverage for a range of events, such as data breaches, network interruption, and cyber extortion, and can help to reduce the financial impact of cybercrime. Thus, the increasing reliance on digital services and the Internet is expected to drive the demand during the forecast period.
Major Challenge
The lack of standardization is a major challenge to the growth of the global market. One of the major challenges faced by the global market is the lack of standardization in the coverage offered by different policies. This makes it difficult for businesses and individuals to compare and choose the best policy for their needs and can lead to confusion about what is covered and what is not. The coverage offered by cyber insurance policies can vary greatly, and many policies have exclusions and limitations that are not always clearly stated. This can result in gaps in coverage, which can leave businesses and individuals vulnerable to financial losses in the event of a cyber-attack.
The lack of standardization can make it challenging for insurance companies to accurately assess the risk associated with a particular policy and determine the appropriate coverage level. This can lead to difficulties in underwriting policies and can result in some insurance companies declining to offer coverage. In conclusion, the lack of standardization in the coverage is a major challenge facing the market. This makes it difficult for businesses and individuals to compare policies and can result in confusion, gaps in coverage, and difficulties in underwriting. Thus, the lack of standardization in the coverage offered by different policies will challenge the market during the forecast period.
Key Market Customer Landscape
The market report includes the adoption lifecycle of the market, covering from the innovator’s stage to the laggard’s stage. It focuses on adoption rates in different regions based on penetration. Furthermore, the report also includes key purchase criteria and drivers of price sensitivity to help companies evaluate and develop their growth strategies.
Global Market Customer Landscape
What is the Fastest-Growing Segment in the Market?
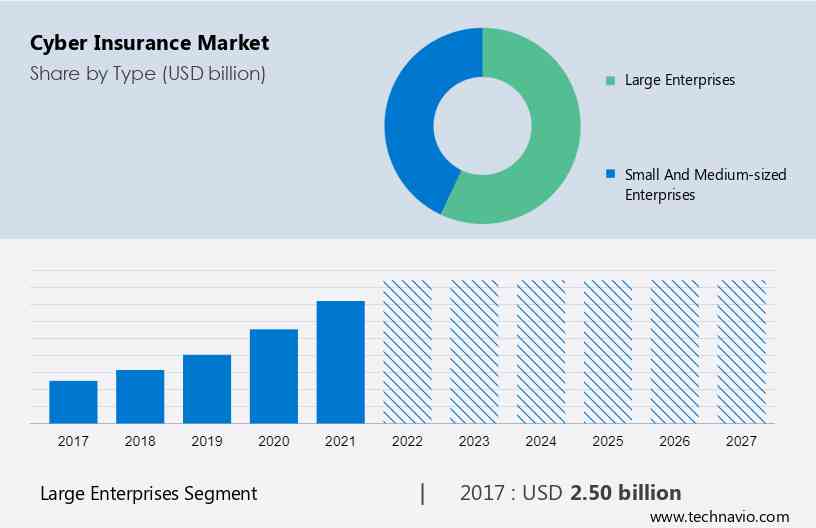
The market share growth by the large enterprise segment will be significant during the forecast period. Large enterprises typically face a higher risk of cyber-attacks due to their size, complexity, and large amount of valuable data they hold. As a result, many large enterprises choose to purchase cyber insurance as a way to mitigate the financial impact of a breach.
Get a glance at the market contribution of various segments Request a PDF Sample
The large enterprises segment was valued at USD 2.50 billion in 2017 and continue to grow by 2021. Large enterprises often require more comprehensive cyber insurance coverage and specialized services to manage the financial impact of a breach. Cyber insurance providers offer tailored packages to meet the needs of large enterprises, including higher coverage limits, comprehensive coverage, specialized services, and global coverage. By purchasing cyber insurance, large enterprises can help to mitigate the financial impact of a cyber-attack and ensure that they have the resources they need to respond effectively. Such factors will drive the growth of the market during the forecast period.
Who are the Major Cyber Insurance Market Companies?
The cyber insurance statistics market report also includes detailed analyses of the competitive landscape of the market and information about 15 market players, including:
- Aon plc
- Apple Inc.
- At Bay Inc.
- AXA Group
- Axis Capital Holdings Ltd.
- BCS Financial Corp.
- Beazley Plc
- BitSight Technologies Inc.
- Cisco Systems Inc.
- CNA Financial Corp.
- Guy Carpenter and Company LLC
- Lloyds Banking Group Plc
- Lockton Companies
- SecurityScorecard Inc.
- Tata Consultancy Services Ltd.
Qualitative and quantitative analysis of companies has been conducted to help clients understand the wider business environment as well as the strengths and weaknesses of key market players. Data is qualitatively analyzed to categorize companies as pure play, category-focused, industry-focused, and diversified; it is quantitatively analyzed to categorize companies as dominant, leading, strong, tentative, and weak.
Which are the Key Regions for the Market?
For more insights on the market share of various regions Request PDF Sample now!
North America is estimated to contribute 57% to the growth of the global market during the forecast period. Technavio’s analysts have elaborately explained the regional trends and drivers that shape the market during the forecast period. In North America, the policies are offered by various insurance companies, with coverage varying depending on the policy and the insurer. The policies typically provide coverage for a range of events, such as data breaches, network interruption, and cyber extortion. There is a growing awareness among businesses and individuals in North America of the importance of the insurance as the frequency and sophistication of cyber-attacks continue to increase. Considering these factors, the regional market is expected to grow during the forecast period.
Market Analyst Overview
The Market responds to the growing digital transformation and adoption of emerging technologies, addressing rising cyber threats. Assumptions regarding cybersecurity solutions and expenditures drive the demand for cybersecurity insurance policies. The market ecosystem encompasses various cybersecurity insurance solutions and services, including investigation expense coverage. Additionally, there's a focus on developing cybersecurity insurance analytics platforms to assess and mitigate risks effectively. This market evolution reflects the need for comprehensive protection against cyber risks amidst increasing reliance on digital technologies.
Segment Overview
The report forecasts market growth by revenue at global, regional & country levels and provides an analysis of the latest trends and growth opportunities from 2017 to 2027.
- Type Outlook (USD billion, 2017 - 2027)
- Large enterprises
- Small and medium-sized enterprises
- Solution Outlook (USD billion, 2017 - 2027)
- Standalone
- Packaged
- Region Outlook (USD billion, 2017 - 2027)
- North America
- The U.S.
- Canada
- Europe
- The U.K.
- Germany
- France
- Rest of Europe
- APAC
- China
- India
- South America
- Chile
- Argentina
- Brazil
- Middle East & Africa
- Saudi Arabia
- South Africa
- Rest of the Middle East & Africa
- North America
|
Market Scope |
|
|
Report Coverage |
Details |
|
Page number |
160 |
|
Base year |
2022 |
|
Historic period |
2017-2021 |
|
Forecast period |
2023-2027 |
|
Growth momentum & CAGR |
Accelerate at a CAGR of 35.92% |
|
Market growth 2023-2027 |
USD 42.81 billion |
|
Market structure |
Fragmented |
|
YoY growth 2022-2023(%) |
30.88 |
|
Regional analysis |
North America, Europe, APAC, South America, and Middle East and Africa |
|
Performing market contribution |
North America at 57% |
|
Key countries |
US, Canada, China, Germany, and UK |
|
Competitive landscape |
Leading Vendors, Market Positioning of Vendors, Competitive Strategies, and Industry Risks |
|
Key companies profiled |
American International Group Inc., Aon plc, Apple Inc., At Bay Inc., AXA Group, Axis Capital Holdings Ltd., BCS Financial Corp., Beazley Plc, BitSight Technologies Inc., Cisco Systems Inc., CNA Financial Corp., Guy Carpenter and Company LLC, Lloyds Banking Group Plc, Lockton Companies, SecurityScorecard Inc., Tata Consultancy Services Ltd., The Hanover Insurance Group Inc., The Travelers Co. Inc., Zurich Insurance Co. Ltd., and Chubb Ltd. |
|
Market dynamics |
Parent market analysis, Market forecasting, Market growth inducers and obstacles, Fast-growing and slow-growing segment analysis, COVID-19 impact and recovery analysis and future consumer dynamics, Market condition analysis for forecast period. |
|
Customization purview |
If our market growth and trends report has not included the data that you are looking for, you can reach out to our analysts and get segments customized. |
What are the Key Data Covered in this Market Research Report?
- CAGR of the market during the forecast period
- Detailed information on factors that will drive the market growth and forecasting of the market between 2023 and 2027
- Precise estimation of the size of the market size and its contribution to the parent market
- Accurate predictions about upcoming market trends and analysis and changes in consumer behavior
- Growth of the market industry across Europe, North America, APAC, South America, and Middle East and Africa
- Thorough market growth analysis of the market’s competitive landscape and detailed information about vendors
- Comprehensive market analysis and report on the factors that will challenge the market research and growth of market vendors
We can help! Our analysts can customize this market research report to meet your requirements. Get in touch
1 Executive Summary
- 1.1 Market overview
- Exhibit 01: Executive Summary – Chart on Market Overview
- Exhibit 02: Executive Summary – Data Table on Market Overview
- Exhibit 03: Executive Summary – Chart on Global Market Characteristics
- Exhibit 04: Executive Summary – Chart on Market by Geography
- Exhibit 05: Executive Summary – Chart on Market Segmentation by Type
- Exhibit 06: Executive Summary – Chart on Market Segmentation by Solution
- Exhibit 07: Executive Summary – Chart on Incremental Growth
- Exhibit 08: Executive Summary – Data Table on Incremental Growth
- Exhibit 09: Executive Summary – Chart on Vendor Market Positioning
2 Market Landscape
- 2.1 Market ecosystem
- Exhibit 10: Parent market
- Exhibit 11: Market Characteristics
3 Market Sizing
- 3.1 Market definition
- Exhibit 12: Offerings of vendors included in the market definition
- 3.2 Market segment analysis
- Exhibit 13: Market segments
- 3.3 Market size 2022
- 3.4 Market outlook: Forecast for 2022-2027
- Exhibit 14: Chart on Global - Market size and forecast 2022-2027 ($ billion)
- Exhibit 15: Data Table on Global - Market size and forecast 2022-2027 ($ billion)
- Exhibit 16: Chart on Global Market: Year-over-year growth 2022-2027 (%)
- Exhibit 17: Data Table on Global Market: Year-over-year growth 2022-2027 (%)
4 Historic Market Size
- 4.1 Global cyber insurance market 2017 - 2021
- Exhibit 18: Historic Market Size – Data Table on Global cyber insurance market 2017 - 2021 ($ billion)
- 4.2 Type Segment Analysis 2017 - 2021
- Exhibit 19: Historic Market Size – Type Segment 2017 - 2021 ($ billion)
- 4.3 Solution Segment Analysis 2017 - 2021
- Exhibit 20: Historic Market Size – Solution Segment 2017 - 2021 ($ billion)
- 4.4 Geography Segment Analysis 2017 - 2021
- Exhibit 21: Historic Market Size – Geography Segment 2017 - 2021 ($ billion)
- 4.5 Country Segment Analysis 2017 - 2021
- Exhibit 22: Historic Market Size – Country Segment 2017 - 2021 ($ billion)
5 Five Forces Analysis
- 5.1 Five forces summary
- Exhibit 23: Five forces analysis - Comparison between 2022 and 2027
- 5.2 Bargaining power of buyers
- Exhibit 24: Chart on Bargaining power of buyers – Impact of key factors 2022 and 2027
- 5.3 Bargaining power of suppliers
- Exhibit 25: Bargaining power of suppliers – Impact of key factors in 2022 and 2027
- 5.4 Threat of new entrants
- Exhibit 26: Threat of new entrants – Impact of key factors in 2022 and 2027
- 5.5 Threat of substitutes
- Exhibit 27: Threat of substitutes – Impact of key factors in 2022 and 2027
- 5.6 Threat of rivalry
- Exhibit 28: Threat of rivalry – Impact of key factors in 2022 and 2027
- 5.7 Market condition
- Exhibit 29: Chart on Market condition - Five forces 2022 and 2027
6 Market Segmentation by Type
- 6.1 Market segments
- Exhibit 30: Chart on Type - Market share 2022-2027 (%)
- Exhibit 31: Data Table on Type - Market share 2022-2027 (%)
- 6.2 Comparison by Type
- Exhibit 32: Chart on Comparison by Type
- Exhibit 33: Data Table on Comparison by Type
- 6.3 Large enterprises - Market size and forecast 2022-2027
- Exhibit 34: Chart on Large enterprises - Market size and forecast 2022-2027 ($ billion)
- Exhibit 35: Data Table on Large enterprises - Market size and forecast 2022-2027 ($ billion)
- Exhibit 36: Chart on Large enterprises - Year-over-year growth 2022-2027 (%)
- Exhibit 37: Data Table on Large enterprises - Year-over-year growth 2022-2027 (%)
- 6.4 Small and medium-sized enterprises - Market size and forecast 2022-2027
- Exhibit 38: Chart on Small and medium-sized enterprises - Market size and forecast 2022-2027 ($ billion)
- Exhibit 39: Data Table on Small and medium-sized enterprises - Market size and forecast 2022-2027 ($ billion)
- Exhibit 40: Chart on Small and medium-sized enterprises - Year-over-year growth 2022-2027 (%)
- Exhibit 41: Data Table on Small and medium-sized enterprises - Year-over-year growth 2022-2027 (%)
- 6.5 Market opportunity by Type
- Exhibit 42: Market opportunity by Type ($ billion)
7 Market Segmentation by Solution
- 7.1 Market segments
- Exhibit 43: Chart on Solution - Market share 2022-2027 (%)
- Exhibit 44: Data Table on Solution - Market share 2022-2027 (%)
- 7.2 Comparison by Solution
- Exhibit 45: Chart on Comparison by Solution
- Exhibit 46: Data Table on Comparison by Solution
- 7.3 Standalone - Market size and forecast 2022-2027
- Exhibit 47: Chart on Standalone - Market size and forecast 2022-2027 ($ billion)
- Exhibit 48: Data Table on Standalone - Market size and forecast 2022-2027 ($ billion)
- Exhibit 49: Chart on Standalone - Year-over-year growth 2022-2027 (%)
- Exhibit 50: Data Table on Standalone - Year-over-year growth 2022-2027 (%)
- 7.4 Packaged - Market size and forecast 2022-2027
- Exhibit 51: Chart on Packaged - Market size and forecast 2022-2027 ($ billion)
- Exhibit 52: Data Table on Packaged - Market size and forecast 2022-2027 ($ billion)
- Exhibit 53: Chart on Packaged - Year-over-year growth 2022-2027 (%)
- Exhibit 54: Data Table on Packaged - Year-over-year growth 2022-2027 (%)
- 7.5 Market opportunity by Solution
- Exhibit 55: Market opportunity by Solution ($ billion)
8 Customer Landscape
- 8.1 Customer landscape overview
- Exhibit 56: Analysis of price sensitivity, lifecycle, customer purchase basket, adoption rates, and purchase criteria
9 Geographic Landscape
- 9.1 Geographic segmentation
- Exhibit 57: Chart on Market share by geography 2022-2027 (%)
- Exhibit 58: Data Table on Market share by geography 2022-2027 (%)
- 9.2 Geographic comparison
- Exhibit 59: Chart on Geographic comparison
- Exhibit 60: Data Table on Geographic comparison
- 9.3 North America - Market size and forecast 2022-2027
- Exhibit 61: Chart on North America - Market size and forecast 2022-2027 ($ billion)
- Exhibit 62: Data Table on North America - Market size and forecast 2022-2027 ($ billion)
- Exhibit 63: Chart on North America - Year-over-year growth 2022-2027 (%)
- Exhibit 64: Data Table on North America - Year-over-year growth 2022-2027 (%)
- 9.4 Europe - Market size and forecast 2022-2027
- Exhibit 65: Chart on Europe - Market size and forecast 2022-2027 ($ billion)
- Exhibit 66: Data Table on Europe - Market size and forecast 2022-2027 ($ billion)
- Exhibit 67: Chart on Europe - Year-over-year growth 2022-2027 (%)
- Exhibit 68: Data Table on Europe - Year-over-year growth 2022-2027 (%)
- 9.5 APAC - Market size and forecast 2022-2027
- Exhibit 69: Chart on APAC - Market size and forecast 2022-2027 ($ billion)
- Exhibit 70: Data Table on APAC - Market size and forecast 2022-2027 ($ billion)
- Exhibit 71: Chart on APAC - Year-over-year growth 2022-2027 (%)
- Exhibit 72: Data Table on APAC - Year-over-year growth 2022-2027 (%)
- 9.6 South America - Market size and forecast 2022-2027
- Exhibit 73: Chart on South America - Market size and forecast 2022-2027 ($ billion)
- Exhibit 74: Data Table on South America - Market size and forecast 2022-2027 ($ billion)
- Exhibit 75: Chart on South America - Year-over-year growth 2022-2027 (%)
- Exhibit 76: Data Table on South America - Year-over-year growth 2022-2027 (%)
- 9.7 Middle East and Africa - Market size and forecast 2022-2027
- Exhibit 77: Chart on Middle East and Africa - Market size and forecast 2022-2027 ($ billion)
- Exhibit 78: Data Table on Middle East and Africa - Market size and forecast 2022-2027 ($ billion)
- Exhibit 79: Chart on Middle East and Africa - Year-over-year growth 2022-2027 (%)
- Exhibit 80: Data Table on Middle East and Africa - Year-over-year growth 2022-2027 (%)
- 9.8 US - Market size and forecast 2022-2027
- Exhibit 81: Chart on US - Market size and forecast 2022-2027 ($ billion)
- Exhibit 82: Data Table on US - Market size and forecast 2022-2027 ($ billion)
- Exhibit 83: Chart on US - Year-over-year growth 2022-2027 (%)
- Exhibit 84: Data Table on US - Year-over-year growth 2022-2027 (%)
- 9.9 Germany - Market size and forecast 2022-2027
- Exhibit 85: Chart on Germany - Market size and forecast 2022-2027 ($ billion)
- Exhibit 86: Data Table on Germany - Market size and forecast 2022-2027 ($ billion)
- Exhibit 87: Chart on Germany - Year-over-year growth 2022-2027 (%)
- Exhibit 88: Data Table on Germany - Year-over-year growth 2022-2027 (%)
- 9.10 UK - Market size and forecast 2022-2027
- Exhibit 89: Chart on UK - Market size and forecast 2022-2027 ($ billion)
- Exhibit 90: Data Table on UK - Market size and forecast 2022-2027 ($ billion)
- Exhibit 91: Chart on UK - Year-over-year growth 2022-2027 (%)
- Exhibit 92: Data Table on UK - Year-over-year growth 2022-2027 (%)
- 9.11 China - Market size and forecast 2022-2027
- Exhibit 93: Chart on China - Market size and forecast 2022-2027 ($ billion)
- Exhibit 94: Data Table on China - Market size and forecast 2022-2027 ($ billion)
- Exhibit 95: Chart on China - Year-over-year growth 2022-2027 (%)
- Exhibit 96: Data Table on China - Year-over-year growth 2022-2027 (%)
- 9.12 Canada - Market size and forecast 2022-2027
- Exhibit 97: Chart on Canada - Market size and forecast 2022-2027 ($ billion)
- Exhibit 98: Data Table on Canada - Market size and forecast 2022-2027 ($ billion)
- Exhibit 99: Chart on Canada - Year-over-year growth 2022-2027 (%)
- Exhibit 100: Data Table on Canada - Year-over-year growth 2022-2027 (%)
- 9.13 Market opportunity by geography
- Exhibit 101: Market opportunity by geography ($ billion)
10 Drivers, Challenges, and Trends
- 10.1 Market drivers
- 10.2 Market challenges
- 10.3 Impact of drivers and challenges
- Exhibit 102: Impact of drivers and challenges in 2022 and 2027
- 10.4 Market trends
11 Vendor Landscape
- 11.1 Overview
- 11.2 Vendor landscape
- Exhibit 103: Overview on Criticality of inputs and Factors of differentiation
- 11.3 Landscape disruption
- Exhibit 104: Overview on factors of disruption
- 11.4 Industry risks
- Exhibit 105: Impact of key risks on business
12 Vendor Analysis
- 12.1 Vendors covered
- Exhibit 106: Vendors covered
- 12.2 Market positioning of vendors
- Exhibit 107: Matrix on vendor position and classification
- 12.3 American International Group Inc.
- Exhibit 108: American International Group Inc. - Overview
- Exhibit 109: American International Group Inc. - Business segments
- Exhibit 110: American International Group Inc. - Key news
- Exhibit 111: American International Group Inc. - Key offerings
- Exhibit 112: American International Group Inc. - Segment focus
- 12.4 Aon plc
- Exhibit 113: Aon plc - Overview
- Exhibit 114: Aon plc - Business segments
- Exhibit 115: Aon plc - Key news
- Exhibit 116: Aon plc - Key offerings
- Exhibit 117: Aon plc - Segment focus
- 12.5 At Bay Inc.
- Exhibit 118: At Bay Inc. - Overview
- Exhibit 119: At Bay Inc. - Product / Service
- Exhibit 120: At Bay Inc. - Key offerings
- 12.6 AXA Group
- Exhibit 121: AXA Group - Overview
- Exhibit 122: AXA Group - Business segments
- Exhibit 123: AXA Group - Key offerings
- Exhibit 124: AXA Group - Segment focus
- 12.7 Axis Capital Holdings Ltd.
- Exhibit 125: Axis Capital Holdings Ltd. - Overview
- Exhibit 126: Axis Capital Holdings Ltd. - Business segments
- Exhibit 127: Axis Capital Holdings Ltd. - Key offerings
- Exhibit 128: Axis Capital Holdings Ltd. - Segment focus
- 12.8 Beazley Plc
- Exhibit 129: Beazley Plc - Overview
- Exhibit 130: Beazley Plc - Business segments
- Exhibit 131: Beazley Plc - Key news
- Exhibit 132: Beazley Plc - Key offerings
- Exhibit 133: Beazley Plc - Segment focus
- 12.9 Chubb Ltd.
- Exhibit 134: Chubb Ltd. - Overview
- Exhibit 135: Chubb Ltd. - Business segments
- Exhibit 136: Chubb Ltd. - Key news
- Exhibit 137: Chubb Ltd. - Key offerings
- Exhibit 138: Chubb Ltd. - Segment focus
- 12.10 Cisco Systems Inc.
- Exhibit 139: Cisco Systems Inc. - Overview
- Exhibit 140: Cisco Systems Inc. - Business segments
- Exhibit 141: Cisco Systems Inc. - Key news
- Exhibit 142: Cisco Systems Inc. - Key offerings
- Exhibit 143: Cisco Systems Inc. - Segment focus
- 12.11 CNA Financial Corp.
- Exhibit 144: CNA Financial Corp. - Overview
- Exhibit 145: CNA Financial Corp. - Business segments
- Exhibit 146: CNA Financial Corp. - Key offerings
- Exhibit 147: CNA Financial Corp. - Segment focus
- 12.12 Guy Carpenter and Company LLC
- Exhibit 148: Guy Carpenter and Company LLC - Overview
- Exhibit 149: Guy Carpenter and Company LLC - Product / Service
- Exhibit 150: Guy Carpenter and Company LLC - Key offerings
- 12.13 Lloyds Banking Group Plc
- Exhibit 151: Lloyds Banking Group Plc - Overview
- Exhibit 152: Lloyds Banking Group Plc - Business segments
- Exhibit 153: Lloyds Banking Group Plc - Key offerings
- Exhibit 154: Lloyds Banking Group Plc - Segment focus
- 12.14 Lockton Companies
- Exhibit 155: Lockton Companies - Overview
- Exhibit 156: Lockton Companies - Product / Service
- Exhibit 157: Lockton Companies - Key offerings
- 12.15 Tata Consultancy Services Ltd.
- Exhibit 158: Tata Consultancy Services Ltd. - Overview
- Exhibit 159: Tata Consultancy Services Ltd. - Business segments
- Exhibit 160: Tata Consultancy Services Ltd. - Key news
- Exhibit 161: Tata Consultancy Services Ltd. - Key offerings
- Exhibit 162: Tata Consultancy Services Ltd. - Segment focus
- 12.16 The Travelers Co. Inc.
- Exhibit 163: The Travelers Co. Inc. - Overview
- Exhibit 164: The Travelers Co. Inc. - Business segments
- Exhibit 165: The Travelers Co. Inc. - Key offerings
- Exhibit 166: The Travelers Co. Inc. - Segment focus
- 12.17 Zurich Insurance Co. Ltd.
- Exhibit 167: Zurich Insurance Co. Ltd. - Overview
- Exhibit 168: Zurich Insurance Co. Ltd. - Business segments
- Exhibit 169: Zurich Insurance Co. Ltd. - Key offerings
- Exhibit 170: Zurich Insurance Co. Ltd. - Segment focus
13 Appendix
- 13.1 Scope of the report
- 13.2 Inclusions and exclusions checklist
- Exhibit 171: Inclusions checklist
- Exhibit 172: Exclusions checklist
- 13.3 Currency conversion rates for US$
- Exhibit 173: Currency conversion rates for US$
- 13.4 Research methodology
- Exhibit 174: Research methodology
- Exhibit 175: Validation techniques employed for market sizing
- Exhibit 176: Information sources
- 13.5 List of abbreviations
- Exhibit 177: List of abbreviations
Research Framework
Technavio presents a detailed picture of the market by way of study, synthesis, and summation of data from multiple sources. The analysts have presented the various facets of the market with a particular focus on identifying the key industry influencers. The data thus presented is comprehensive, reliable, and the result of extensive research, both primary and secondary.
INFORMATION SOURCES
Primary sources
- Manufacturers and suppliers
- Channel partners
- Industry experts
- Strategic decision makers
Secondary sources
- Industry journals and periodicals
- Government data
- Financial reports of key industry players
- Historical data
- Press releases
DATA ANALYSIS
Data Synthesis
- Collation of data
- Estimation of key figures
- Analysis of derived insights
Data Validation
- Triangulation with data models
- Reference against proprietary databases
- Corroboration with industry experts
REPORT WRITING
Qualitative
- Market drivers
- Market challenges
- Market trends
- Five forces analysis
Quantitative
- Market size and forecast
- Market segmentation
- Geographical insights
- Competitive landscape
PURCHASE FULL REPORT OF
cyber insurance market market
Key Questions Answered
- What are the key global market and the regional market share?
- What are the revenue-generating key market segments?
- What are the key factors driving and challenging this market’s growth?
- Who are the key market vendors and their growth strategies?
- What are the latest trends influencing the growth of this market?
- What are the variables influencing the market growth in the primary regions?
- What are the factors influencing the growth of the parent market?
Why should you prefer Technavio's market insights report?
- Off-the-shelf research reports
- Reports can be tailored to meet the customer's needs
- Trusted by more than 100 fortune 500 organizations
- Information about the market's key drivers, trends, and challenges
- Parent market analysis
- Every week, 50,000 people visit our subscription platform
- Detailed vendors report with competitive landscape
- Covid-19 impact and recovery analysis
- Data on revenue-generating market segments
- Details on the market shares of various regions
- Five-force market analysis