Cyber Weapon Market Analysis North America, Europe, APAC, Middle East and Africa, South America - US, China, Japan, UK, Germany - Size and Forecast 2023-2027
| Published: Oct 2023 | Pages: 169 | SKU: IRTNTR76417 |
Cyber Weapon Market Forecast 2023-2027
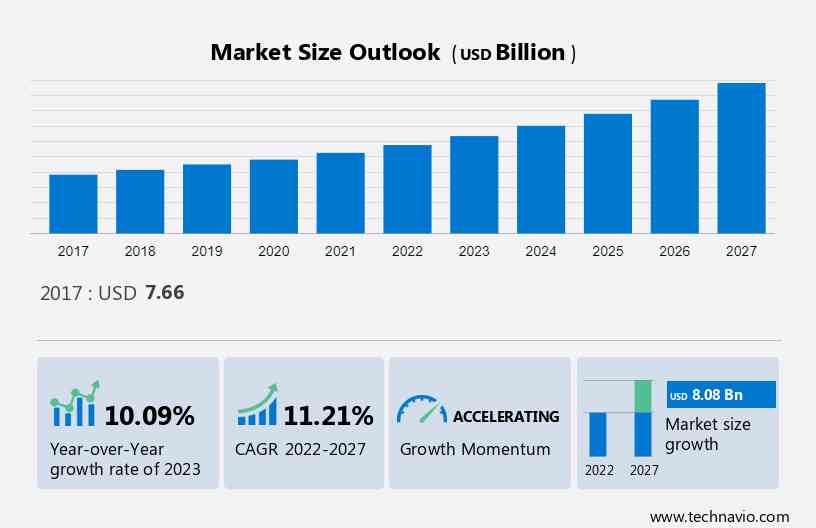
The Cyber Weapon Market size is estimated to grow by USD 8.08 billion at a CAGR of 11.21% between 2022 and 2027. The growth of the market depends on several factors, including the increasing IT security budget, the growing need for infrastructure protection, and the rising international conflicts.
What will be the Size of the Market During the Forecast Period?
To learn more about this report, View Report Sample
Market Overview
Key Driver
One of the key factors driving the market growth is the increasing IT security budget. Several organizations across various sectors are increasing their IT budgets due to the increasing number of cybersecurity threats. In addition, there is a significant increase in global spending on IT security budgets across the globe which mainly comprise expenses on cyber security services.
For example, global spending on IT security services was around USD 71.68 billion in 2022, which is anticipated to reach approximately USD 76 billion by the end of 2023. In addition, there is an increase in the number of cyber attacks as there is an increase in in use of websites and web applications by end-users which fuels the number of instances of identity and data theft. Hence, the increasing complexity of cyber-attacks and the growing awareness of security risks are positively impacting the market. Hence, such factors are expected to drive market during the forecast period.
Significant Trends
One of the major market trends is the growing demand for data safety and security. There is an increase in demand for systems monitoring, hardware, intellectual property, theft, and disposal of targets' data, as well as vital manufacturing and commercial activities fuelled by the market. In addition, there is an increase in demand for control of commercial losses due to factors such as the need for data safety and security.
Moreover, the growing demand across various sectors such as the military, government, telecommunication, banking, and finance is positively impacting the market. Furthermore, the personal data in these end-user sectors are highly prone to unexpected damage by cyber hackers. Hence, such factors are driving the market during the forecast period.
Major Restraint
The high cost of development is one of the key challenges hindering the market. There is a significant cost associated with the development of cyber weapons as it requires time, resources, and technical expertise. In addition, there are only a handful of companies which has the funds and capacity to help with the production of these complicated technologies.
Moreover, as research is highly confidential, it is inconceivable for potential clients to think about the cost and capacities of these frameworks. Hence, such factors are negatively impacting the market which in turn will hinder the market growth during the forecast period.
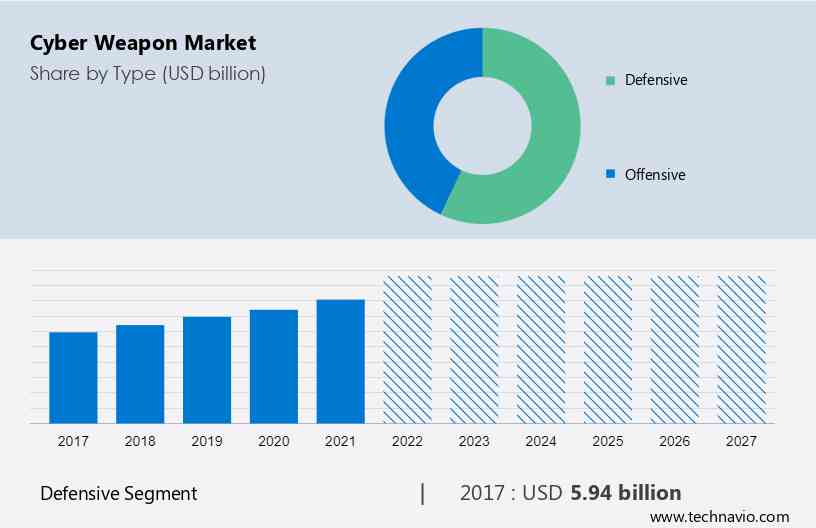
Defensive Segment
The defensive segment is estimated to witness significant growth during the forecast period. There is an increasing deployment of virus malware as defensive cyber weapons to prevent the theft of intellectual property or the erasure of data and systems. Factors such as the increase in threats to critical infrastructure in important industries like information technology and government are significantly contributing to the growth of the defensive segment.
Get a glance at the market contribution of various segments View the Free PDF Sample
The defensive segment was the largest segment and was valued at USD 5.94 billion in 2017. In addition, factors such as rising defense spending as well as the ongoing development as a weapon of war are fuelling the growth of the segment. There is an increasing adoption of cyber weapons, especially malware or a virus, by military, paramilitary, and intelligence services to access the adversary network. Hence, factors such as the increase in demand to invade the target's privacy and protect the host nation's sovereignty are fuelling the growth of this segment which in turn will drive the market growth during the forecast period.
End-user Segment
The increased expenditure on cyber weapons by the government segment will increase the market growth. Factors such as the rise in security installations in both developed and emerging nations, as well as the increasing contribution from the homeland security and defense sectors are fuelling the growth of this segment. In addition, there is an increasing adoption of cyber weapon solutions across the government segment to for the security and confidentiality of data. Several factors such as the e digital transformation, increased government expenditure on cyber weapons, and the rise in international conflicts are fuelling the growth of this segment which in turn will drive the growth during the forecast period.
Regional Overview
For more insights on the market share of various regions Download PDF Sample now!
North America is estimated to contribute 35% to the growth of the global market during the forecast period. Technavio’s analysts have elaborately explained the regional trends and drivers that shape the market during the forecast period. Some of the main factors that are significantly contributing to the growth of the market in North America include increased use in end users' industries, shifting away from conventional IT services towards internet IT systems, and increasing governmental initiatives to tackle cyber security.
Moreover, one of the main countries that are leading contributors to market growth in North America is the US due to the significant presence of new startups in the region. Furthermore, several factors such as the increase in cyber threats in North America due to technological advancements the use of cloud-based systems for data storage, and the rising number of cyber threats targeting defense organizations are driving the market growth in the region.
Key Customer Landscape
The market forecasting report includes the adoption lifecycle of the market, covering from the innovator’s stage to the laggard’s stage. It focuses on adoption rates in different regions based on penetration. Furthermore, the market growth and forecasting report also includes key purchase criteria and drivers of price sensitivity to help companies evaluate and develop their growth strategies.
Customer Landscape
Who are the Major Cyber Weapon Market Companies?
Companies are implementing various strategies, such as strategic alliances, partnerships, mergers and acquisitions, geographical expansion, and product/service launches, to enhance their presence in the market.
- Airbus SE: The company offers cyber weapons under the brand EADS CASSIDIAN.
The market research and growth report also includes detailed analyses of the competitive landscape of the market and information about 20 market companies, including:
- Accenture Plc
- BAE Systems Plc
- Booz Allen Hamilton Holding Corp.
- Broadcom Inc.
- Cisco Systems Inc.
- DXC Technology Co.
- General Dynamics Corp.
- Intel Corp.
- International Business Machines Corp.
- Lockheed Martin Corp.
- Mandiant Inc.
- McAfee LLC
- Musarubra US LLC
- Northrop Grumman Corp.
- Raytheon Technologies Corp.
- Thales Group
- The Boeing Co.
Qualitative and quantitative analysis of companies has been conducted to help clients understand the wider business environment as well as the strengths and weaknesses of key market players. Data is qualitatively analyzed to categorize companies as pure play, category-focused, industry-focused, and diversified; it is quantitatively analyzed to categorize companies as dominant, leading, strong, tentative, and weak.
Market Analyst Overview
The Cyber Weapon Market thrives on the development and deployment of sophisticated computer code, including viruses, ransomware, and logic bombs, challenging cybersecurity strategies globally. Intelligence sectors vigilantly monitor cyberspace for unauthorized activities, safeguarding critical infrastructure like air traffic control, national defense systems, industrial control systems, communication networks, automated transportation systems, and smart power grids. With the BFSI sector particularly targeted, Asia Pacific and the Rest of the World witness escalating cyber threats. Players like FireEye, Inc., and Northrop Grumman Corporation are pivotal in cyber-mission forces, constantly innovating to counteract potential cyberattacks and adversaries' actions, ensuring the resilience of cyber defenses.
Segment Overview
The market growth analysis report covers revenue at global, regional & country levels and provides an analysis of the latest trends and growth opportunities from 2017 to 2027.
- Type Outlook (USD billion, 2017 - 2027)
- Defensive
- Offensive
- End-user Outlook (USD billion, 2017 - 2027)
- Government
- BFSI
- Corporate
- Others
- Geography Outlook (USD billion, 2017 - 2027)
- North America
- The U.S.
- Canada
- Europe
- The U.K.
- Germany
- France
- Rest of Europe
- APAC
- China
- India
- South America
- Chile
- Argentina
- Brazil
- Middle East & Africa
- Saudi Arabia
- South Africa
- Rest of the Middle East & Africa
- North America
|
Market Scope |
|
|
Market Report Coverage |
Details |
|
Page number |
169 |
|
Base year |
2022 |
|
Historic period |
2017-2021 |
|
Forecast period |
2023-2027 |
|
Growth momentum & CAGR |
Accelerate at a CAGR of 11.21% |
|
Market growth 2023-2027 |
USD 8.08 billion |
|
Market structure |
Fragmented |
|
YoY growth 2022-2023(%) |
10.09 |
|
Regional analysis |
North America, Europe, APAC, Middle East and Africa, and South America |
|
Performing market contribution |
North America at 35% |
|
Key countries |
US, China, Japan, UK, and Germany |
|
Competitive landscape |
Leading Companies, Market Positioning of Companies, Competitive Strategies, and Industry Risks |
|
Key companies profiled |
Accenture Plc, Airbus SE, AO Kaspersky Lab, Avast Software sro, BAE Systems Plc, Booz Allen Hamilton Holding Corp., Broadcom Inc., Cisco Systems Inc., DXC Technology Co., General Dynamics Corp., Intel Corp., International Business Machines Corp., Lockheed Martin Corp., Mandiant Inc., McAfee LLC, Musarubra US LLC, Northrop Grumman Corp., Raytheon Technologies Corp., Thales Group, and The Boeing Co. |
|
Market dynamics |
Parent market analysis, Market growth inducers and obstacles, Fast-growing and slow-growing segment analysis, COVID-19 impact and recovery analysis and future consumer dynamics, Market condition analysis for the forecast period |
|
Customization purview |
If our report has not included the data that you are looking for, you can reach out to our analysts and get segments customized. |
What are the Key Data Covered in this Market Research Report?
- CAGR of the market during the forecast period
- Detailed information on factors that will drive the growth of the market between 2023 and 2027
- Precise estimation of the market size and its contribution to the market in focus on the parent market
- Accurate predictions about upcoming trends and changes in consumer behavior
- Growth of the market across North America, Europe, APAC, Middle East and Africa, and South America
- A thorough analysis of the market’s competitive landscape and detailed information about companies
- Comprehensive analysis of factors that will challenge the growth of market companies
We can help! Our analysts can customize this market research report to meet your requirements.
1 Executive Summary
- 1.1 Market overview
- Exhibit 01: Executive Summary – Chart on Market Overview
- Exhibit 02: Executive Summary – Data Table on Market Overview
- Exhibit 03: Executive Summary – Chart on Global Market Characteristics
- Exhibit 04: Executive Summary – Chart on Market by Geography
- Exhibit 05: Executive Summary – Chart on Market Segmentation by Type
- Exhibit 06: Executive Summary – Chart on Market Segmentation by End-user
- Exhibit 07: Executive Summary – Chart on Incremental Growth
- Exhibit 08: Executive Summary – Data Table on Incremental Growth
- Exhibit 09: Executive Summary – Chart on Vendor Market Positioning
2 Market Landscape
- 2.1 Market ecosystem
- Exhibit 10: Parent market
- Exhibit 11: Market Characteristics
3 Market Sizing
- 3.1 Market definition
- Exhibit 12: Offerings of vendors included in the market definition
- 3.2 Market segment analysis
- Exhibit 13: Market segments
- 3.3 Market size 2022
- 3.4 Market outlook: Forecast for 2022-2027
- Exhibit 14: Chart on Global - Market size and forecast 2022-2027 ($ billion)
- Exhibit 15: Data Table on Global - Market size and forecast 2022-2027 ($ billion)
- Exhibit 16: Chart on Global Market: Year-over-year growth 2022-2027 (%)
- Exhibit 17: Data Table on Global Market: Year-over-year growth 2022-2027 (%)
4 Historic Market Size
- 4.1 Global cyber weapon market 2017 - 2021
- Exhibit 18: Historic Market Size – Data Table on global cyber weapon market 2017 - 2021 ($ billion)
- 4.2 Type Segment Analysis 2017 - 2021
- Exhibit 19: Historic Market Size – Type Segment 2017 - 2021 ($ billion)
- 4.3 End-user Segment Analysis 2017 - 2021
- Exhibit 20: Historic Market Size – End-user Segment 2017 - 2021 ($ billion)
- 4.4 Geography Segment Analysis 2017 - 2021
- Exhibit 21: Historic Market Size – Geography Segment 2017 - 2021 ($ billion)
- 4.5 Country Segment Analysis 2017 - 2021
- Exhibit 22: Historic Market Size – Country Segment 2017 - 2021 ($ billion)
5 Five Forces Analysis
- 5.1 Five forces summary
- Exhibit 23: Five forces analysis - Comparison between 2022 and 2027
- 5.2 Bargaining power of buyers
- Exhibit 24: Chart on Bargaining power of buyers – Impact of key factors 2022 and 2027
- 5.3 Bargaining power of suppliers
- Exhibit 25: Bargaining power of suppliers – Impact of key factors in 2022 and 2027
- 5.4 Threat of new entrants
- Exhibit 26: Threat of new entrants – Impact of key factors in 2022 and 2027
- 5.5 Threat of substitutes
- Exhibit 27: Threat of substitutes – Impact of key factors in 2022 and 2027
- 5.6 Threat of rivalry
- Exhibit 28: Threat of rivalry – Impact of key factors in 2022 and 2027
- 5.7 Market condition
- Exhibit 29: Chart on Market condition - Five forces 2022 and 2027
6 Market Segmentation by Type
- 6.1 Market segments
- Exhibit 30: Chart on Type - Market share 2022-2027 (%)
- Exhibit 31: Data Table on Type - Market share 2022-2027 (%)
- 6.2 Comparison by Type
- Exhibit 32: Chart on Comparison by Type
- Exhibit 33: Data Table on Comparison by Type
- 6.3 Defensive - Market size and forecast 2022-2027
- Exhibit 34: Chart on Defensive - Market size and forecast 2022-2027 ($ billion)
- Exhibit 35: Data Table on Defensive - Market size and forecast 2022-2027 ($ billion)
- Exhibit 36: Chart on Defensive - Year-over-year growth 2022-2027 (%)
- Exhibit 37: Data Table on Defensive - Year-over-year growth 2022-2027 (%)
- 6.4 Offensive - Market size and forecast 2022-2027
- Exhibit 38: Chart on Offensive - Market size and forecast 2022-2027 ($ billion)
- Exhibit 39: Data Table on Offensive - Market size and forecast 2022-2027 ($ billion)
- Exhibit 40: Chart on Offensive - Year-over-year growth 2022-2027 (%)
- Exhibit 41: Data Table on Offensive - Year-over-year growth 2022-2027 (%)
- 6.5 Market opportunity by Type
- Exhibit 42: Market opportunity by Type ($ billion)
- Exhibit 43: Data Table on Market opportunity by Type ($ billion)
7 Market Segmentation by End-user
- 7.1 Market segments
- Exhibit 44: Chart on End-user - Market share 2022-2027 (%)
- Exhibit 45: Data Table on End-user - Market share 2022-2027 (%)
- 7.2 Comparison by End-user
- Exhibit 46: Chart on Comparison by End-user
- Exhibit 47: Data Table on Comparison by End-user
- 7.3 Government - Market size and forecast 2022-2027
- Exhibit 48: Chart on Government - Market size and forecast 2022-2027 ($ billion)
- Exhibit 49: Data Table on Government - Market size and forecast 2022-2027 ($ billion)
- Exhibit 50: Chart on Government - Year-over-year growth 2022-2027 (%)
- Exhibit 51: Data Table on Government - Year-over-year growth 2022-2027 (%)
- 7.4 BFSI - Market size and forecast 2022-2027
- Exhibit 52: Chart on BFSI - Market size and forecast 2022-2027 ($ billion)
- Exhibit 53: Data Table on BFSI - Market size and forecast 2022-2027 ($ billion)
- Exhibit 54: Chart on BFSI - Year-over-year growth 2022-2027 (%)
- Exhibit 55: Data Table on BFSI - Year-over-year growth 2022-2027 (%)
- 7.5 Corporate - Market size and forecast 2022-2027
- Exhibit 56: Chart on Corporate - Market size and forecast 2022-2027 ($ billion)
- Exhibit 57: Data Table on Corporate - Market size and forecast 2022-2027 ($ billion)
- Exhibit 58: Chart on Corporate - Year-over-year growth 2022-2027 (%)
- Exhibit 59: Data Table on Corporate - Year-over-year growth 2022-2027 (%)
- 7.6 Others - Market size and forecast 2022-2027
- Exhibit 60: Chart on Others - Market size and forecast 2022-2027 ($ billion)
- Exhibit 61: Data Table on Others - Market size and forecast 2022-2027 ($ billion)
- Exhibit 62: Chart on Others - Year-over-year growth 2022-2027 (%)
- Exhibit 63: Data Table on Others - Year-over-year growth 2022-2027 (%)
- 7.7 Market opportunity by End-user
- Exhibit 64: Market opportunity by End-user ($ billion)
- Exhibit 65: Data Table on Market opportunity by End-user ($ billion)
8 Customer Landscape
- 8.1 Customer landscape overview
- Exhibit 66: Analysis of price sensitivity, lifecycle, customer purchase basket, adoption rates, and purchase criteria
9 Geographic Landscape
- 9.1 Geographic segmentation
- Exhibit 67: Chart on Market share by geography 2022-2027 (%)
- Exhibit 68: Data Table on Market share by geography 2022-2027 (%)
- 9.2 Geographic comparison
- Exhibit 69: Chart on Geographic comparison
- Exhibit 70: Data Table on Geographic comparison
- 9.3 North America - Market size and forecast 2022-2027
- Exhibit 71: Chart on North America - Market size and forecast 2022-2027 ($ billion)
- Exhibit 72: Data Table on North America - Market size and forecast 2022-2027 ($ billion)
- Exhibit 73: Chart on North America - Year-over-year growth 2022-2027 (%)
- Exhibit 74: Data Table on North America - Year-over-year growth 2022-2027 (%)
- 9.4 Europe - Market size and forecast 2022-2027
- Exhibit 75: Chart on Europe - Market size and forecast 2022-2027 ($ billion)
- Exhibit 76: Data Table on Europe - Market size and forecast 2022-2027 ($ billion)
- Exhibit 77: Chart on Europe - Year-over-year growth 2022-2027 (%)
- Exhibit 78: Data Table on Europe - Year-over-year growth 2022-2027 (%)
- 9.5 APAC - Market size and forecast 2022-2027
- Exhibit 79: Chart on APAC - Market size and forecast 2022-2027 ($ billion)
- Exhibit 80: Data Table on APAC - Market size and forecast 2022-2027 ($ billion)
- Exhibit 81: Chart on APAC - Year-over-year growth 2022-2027 (%)
- Exhibit 82: Data Table on APAC - Year-over-year growth 2022-2027 (%)
- 9.6 Middle East and Africa - Market size and forecast 2022-2027
- Exhibit 83: Chart on Middle East and Africa - Market size and forecast 2022-2027 ($ billion)
- Exhibit 84: Data Table on Middle East and Africa - Market size and forecast 2022-2027 ($ billion)
- Exhibit 85: Chart on Middle East and Africa - Year-over-year growth 2022-2027 (%)
- Exhibit 86: Data Table on Middle East and Africa - Year-over-year growth 2022-2027 (%)
- 9.7 South America - Market size and forecast 2022-2027
- Exhibit 87: Chart on South America - Market size and forecast 2022-2027 ($ billion)
- Exhibit 88: Data Table on South America - Market size and forecast 2022-2027 ($ billion)
- Exhibit 89: Chart on South America - Year-over-year growth 2022-2027 (%)
- Exhibit 90: Data Table on South America - Year-over-year growth 2022-2027 (%)
- 9.8 US - Market size and forecast 2022-2027
- Exhibit 91: Chart on US - Market size and forecast 2022-2027 ($ billion)
- Exhibit 92: Data Table on US - Market size and forecast 2022-2027 ($ billion)
- Exhibit 93: Chart on US - Year-over-year growth 2022-2027 (%)
- Exhibit 94: Data Table on US - Year-over-year growth 2022-2027 (%)
- 9.9 China - Market size and forecast 2022-2027
- Exhibit 95: Chart on China - Market size and forecast 2022-2027 ($ billion)
- Exhibit 96: Data Table on China - Market size and forecast 2022-2027 ($ billion)
- Exhibit 97: Chart on China - Year-over-year growth 2022-2027 (%)
- Exhibit 98: Data Table on China - Year-over-year growth 2022-2027 (%)
- 9.10 UK - Market size and forecast 2022-2027
- Exhibit 99: Chart on UK - Market size and forecast 2022-2027 ($ billion)
- Exhibit 100: Data Table on UK - Market size and forecast 2022-2027 ($ billion)
- Exhibit 101: Chart on UK - Year-over-year growth 2022-2027 (%)
- Exhibit 102: Data Table on UK - Year-over-year growth 2022-2027 (%)
- 9.11 Germany - Market size and forecast 2022-2027
- Exhibit 103: Chart on Germany - Market size and forecast 2022-2027 ($ billion)
- Exhibit 104: Data Table on Germany - Market size and forecast 2022-2027 ($ billion)
- Exhibit 105: Chart on Germany - Year-over-year growth 2022-2027 (%)
- Exhibit 106: Data Table on Germany - Year-over-year growth 2022-2027 (%)
- 9.12 Japan - Market size and forecast 2022-2027
- Exhibit 107: Chart on Japan - Market size and forecast 2022-2027 ($ billion)
- Exhibit 108: Data Table on Japan - Market size and forecast 2022-2027 ($ billion)
- Exhibit 109: Chart on Japan - Year-over-year growth 2022-2027 (%)
- Exhibit 110: Data Table on Japan - Year-over-year growth 2022-2027 (%)
- 9.13 Market opportunity by geography
- Exhibit 111: Market opportunity by geography ($ billion)
- Exhibit 112: Data Tables on Market opportunity by geography ($ billion)
10 Drivers, Challenges, and Trends
- 10.1 Market drivers
- 10.2 Market challenges
- 10.3 Impact of drivers and challenges
- Exhibit 113: Impact of drivers and challenges in 2022 and 2027
- 10.4 Market trends
11 Vendor Landscape
- 11.1 Overview
- 11.2 Vendor landscape
- Exhibit 114: Overview on Criticality of inputs and Factors of differentiation
- 11.3 Landscape disruption
- Exhibit 115: Overview on factors of disruption
- 11.4 Industry risks
- Exhibit 116: Impact of key risks on business
12 Vendor Analysis
- 12.1 Vendors covered
- Exhibit 117: Vendors covered
- 12.2 Market positioning of vendors
- Exhibit 118: Matrix on vendor position and classification
- 12.3 Airbus SE
- Exhibit 119: Airbus SE - Overview
- Exhibit 120: Airbus SE - Business segments
- Exhibit 121: Airbus SE - Key news
- Exhibit 122: Airbus SE - Key offerings
- Exhibit 123: Airbus SE - Segment focus
- 12.4 AO Kaspersky Lab
- Exhibit 124: AO Kaspersky Lab - Overview
- Exhibit 125: AO Kaspersky Lab - Product / Service
- Exhibit 126: AO Kaspersky Lab - Key offerings
- 12.5 Avast Software sro
- Exhibit 127: Avast Software sro - Overview
- Exhibit 128: Avast Software sro - Business segments
- Exhibit 129: Avast Software sro - Key offerings
- Exhibit 130: Avast Software sro - Segment focus
- 12.6 BAE Systems Plc
- Exhibit 131: BAE Systems Plc - Overview
- Exhibit 132: BAE Systems Plc - Business segments
- Exhibit 133: BAE Systems Plc - Key offerings
- Exhibit 134: BAE Systems Plc - Segment focus
- 12.7 Cisco Systems Inc.
- Exhibit 135: Cisco Systems Inc. - Overview
- Exhibit 136: Cisco Systems Inc. - Business segments
- Exhibit 137: Cisco Systems Inc. - Key news
- Exhibit 138: Cisco Systems Inc. - Key offerings
- Exhibit 139: Cisco Systems Inc. - Segment focus
- 12.8 DXC Technology Co.
- Exhibit 140: DXC Technology Co. - Overview
- Exhibit 141: DXC Technology Co. - Business segments
- Exhibit 142: DXC Technology Co. - Key news
- Exhibit 143: DXC Technology Co. - Key offerings
- Exhibit 144: DXC Technology Co. - Segment focus
- 12.9 General Dynamics Corp.
- Exhibit 145: General Dynamics Corp. - Overview
- Exhibit 146: General Dynamics Corp. - Business segments
- Exhibit 147: General Dynamics Corp. - Key news
- Exhibit 148: General Dynamics Corp. - Key offerings
- Exhibit 149: General Dynamics Corp. - Segment focus
- 12.10 Intel Corp.
- Exhibit 150: Intel Corp. - Overview
- Exhibit 151: Intel Corp. - Business segments
- Exhibit 152: Intel Corp. - Key news
- Exhibit 153: Intel Corp. - Key offerings
- Exhibit 154: Intel Corp. - Segment focus
- 12.11 International Business Machines Corp.
- Exhibit 155: International Business Machines Corp. - Overview
- Exhibit 156: International Business Machines Corp. - Business segments
- Exhibit 157: International Business Machines Corp. - Key news
- Exhibit 158: International Business Machines Corp. - Key offerings
- Exhibit 159: International Business Machines Corp. - Segment focus
- 12.12 Lockheed Martin Corp.
- Exhibit 160: Lockheed Martin Corp. - Overview
- Exhibit 161: Lockheed Martin Corp. - Business segments
- Exhibit 162: Lockheed Martin Corp. - Key news
- Exhibit 163: Lockheed Martin Corp. - Key offerings
- Exhibit 164: Lockheed Martin Corp. - Segment focus
- 12.13 McAfee LLC
- Exhibit 165: McAfee LLC - Overview
- Exhibit 166: McAfee LLC - Product / Service
- Exhibit 167: McAfee LLC - Key news
- Exhibit 168: McAfee LLC - Key offerings
- 12.14 Northrop Grumman Corp.
- Exhibit 169: Northrop Grumman Corp. - Overview
- Exhibit 170: Northrop Grumman Corp. - Business segments
- Exhibit 171: Northrop Grumman Corp. - Key news
- Exhibit 172: Northrop Grumman Corp. - Key offerings
- Exhibit 173: Northrop Grumman Corp. - Segment focus
- 12.15 Raytheon Technologies Corp.
- Exhibit 174: Raytheon Technologies Corp. - Overview
- Exhibit 175: Raytheon Technologies Corp. - Business segments
- Exhibit 176: Raytheon Technologies Corp. - Key news
- Exhibit 177: Raytheon Technologies Corp. - Key offerings
- Exhibit 178: Raytheon Technologies Corp. - Segment focus
- 12.16 Thales Group
- Exhibit 179: Thales Group - Overview
- Exhibit 180: Thales Group - Business segments
- Exhibit 181: Thales Group - Key news
- Exhibit 182: Thales Group - Key offerings
- Exhibit 183: Thales Group - Segment focus
- 12.17 The Boeing Co.
- Exhibit 184: The Boeing Co. - Overview
- Exhibit 185: The Boeing Co. - Business segments
- Exhibit 186: The Boeing Co. - Key offerings
- Exhibit 187: The Boeing Co. - Segment focus
13 Appendix
- 13.1 Scope of the report
- 13.2 Inclusions and exclusions checklist
- Exhibit 188: Inclusions checklist
- Exhibit 189: Exclusions checklist
- 13.3 Currency conversion rates for US$
- Exhibit 190: Currency conversion rates for US$
- 13.4 Research methodology
- Exhibit 191: Research methodology
- Exhibit 192: Validation techniques employed for market sizing
- Exhibit 193: Information sources
- 13.5 List of abbreviations
- Exhibit 194: List of abbreviations
Research Framework
Technavio presents a detailed picture of the market by way of study, synthesis, and summation of data from multiple sources. The analysts have presented the various facets of the market with a particular focus on identifying the key industry influencers. The data thus presented is comprehensive, reliable, and the result of extensive research, both primary and secondary.
INFORMATION SOURCES
Primary sources
- Manufacturers and suppliers
- Channel partners
- Industry experts
- Strategic decision makers
Secondary sources
- Industry journals and periodicals
- Government data
- Financial reports of key industry players
- Historical data
- Press releases
DATA ANALYSIS
Data Synthesis
- Collation of data
- Estimation of key figures
- Analysis of derived insights
Data Validation
- Triangulation with data models
- Reference against proprietary databases
- Corroboration with industry experts
REPORT WRITING
Qualitative
- Market drivers
- Market challenges
- Market trends
- Five forces analysis
Quantitative
- Market size and forecast
- Market segmentation
- Geographical insights
- Competitive landscape
PURCHASE FULL REPORT OF
cyber weapon market
Key Questions Answered
- What are the key global market and the regional market share?
- What are the revenue-generating key market segments?
- What are the key factors driving and challenging this market’s growth?
- Who are the key market vendors and their growth strategies?
- What are the latest trends influencing the growth of this market?
- What are the variables influencing the market growth in the primary regions?
- What are the factors influencing the growth of the parent market?
Why should you prefer Technavio's market insights report?
- Off-the-shelf research reports
- Reports can be tailored to meet the customer's needs
- Trusted by more than 100 fortune 500 organizations
- Information about the market's key drivers, trends, and challenges
- Parent market analysis
- Every week, 50,000 people visit our subscription platform
- Detailed vendors report with competitive landscape
- Covid-19 impact and recovery analysis
- Data on revenue-generating market segments
- Details on the market shares of various regions
- Five-force market analysis