Edtech Market Analysis North America, Europe, APAC, South America, Middle East and Africa - US, Canada, China, Japan, Germany - Size and Forecast 2023-2027
| Published: Oct 2023 | Pages: 165 | SKU: IRTNTR71093 |
Edtech Market Report 2023-2027
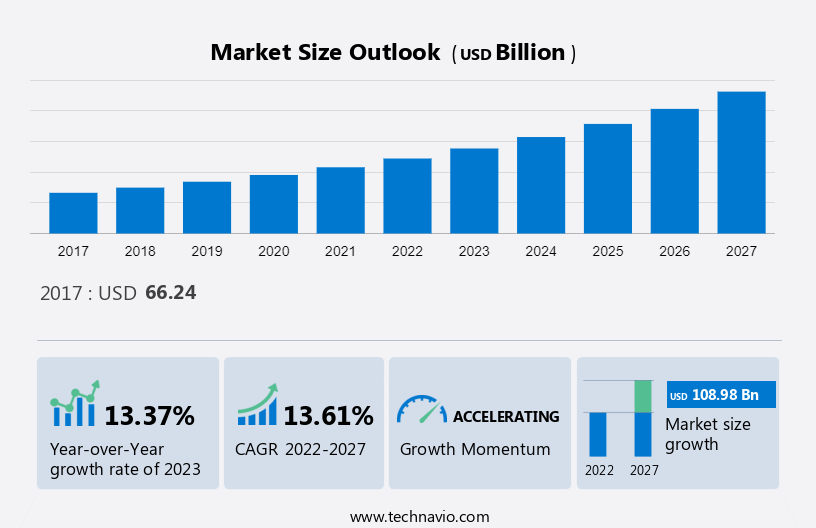
The Edtech Market is projected to reach a value of USD 231.08 billion in 2027 with a CAGR of 13.61% between 2022 and 2027.
The market research and growth report also extensively covers market segmentation by type (hardware, content, and software), sector (K-12, higher education, and others), and geography (North America, Europe, APAC, South America, and the Middle East and Africa). This edtech market's research report also includes an in-depth analysis of drivers, trends, and challenges.
| Analysis Period | 2017-2027 |
| Market Size (2017) Historic Year | USD 66.24 billion |
| Market Size (2027) - Forecasted Year | USD 231.08 billion |
| Historic Opportunity (2017-2021) | USD 41.57 billion |
| Historic CAGR | 12.95 % |
| Forecasted Opportunity (2023-2027) | USD 108.98 billion |
| Market Opportunity Transformation Growth | 248.85 % |
| Market Opportunity Capitalization | USD 150.55 billion |
The learners shifting toward eBooks is driving growth in the market. Distributors, internet bookstores, and makers of tablets have elevated standards of the computerized fate of the book business. Amazon has secured itself as one of the central parts in the US by sending off a progressive electronic perusing gadget that simplifies it for clients to buy books at sensible costs. Individuals have been constrained into changing to electronic course books by the Coronavirus pandemic. In 2020, there was a lockdown, and it were closed down to distribute units. The reception of digital books expanded because of the adaptability and straightforwardness digital books offer, likewise, individuals were stuck at home during the lockdowns, and they read digital books during their extra time without different choices like those presented by open air games. Such factors will increase the market growth during the forecast period.
Overview of Edtech Market
Key Players in the Industry
Edtech marketplace vendors are implementing various strategies, such as strategic alliances, partnerships, mergers and acquisitions, geographical expansion, and product/service launches, to enhance their presence in the market.
2U Inc. - The company Professional Certificates, MicroBachelors, MicroMasters, and Boot Camps.
The market report also includes detailed analyses of the competitive landscape of the market and information about 15 market vendors, including:
- Alphabet Inc.
- Anthology Inc.
- Chegg Inc.
- Cornerstone OnDemand Inc.
- Coursera Inc.
- D2L Corp.
- edX LLC
- Ellucian Co. LP
- Instructure Holdings Inc.
- Microsoft Corp.
- Oracle Corp.
- PleIQ Smart Toys Spa
- Promethean World Ltd.
- Think and Learn Pvt. Ltd.
Qualitative and quantitative analysis of vendors has been conducted to help clients understand the wider business environment as well as the strengths and weaknesses of key market players. Data is qualitatively analyzed to categorize vendors as pure play, category-focused, industry-focused, and diversified; it is quantitatively analyzed to categorize vendors as dominant, leading, strong, tentative, and weak.
Regional Insight
View the Bestselling Market Report Instantly
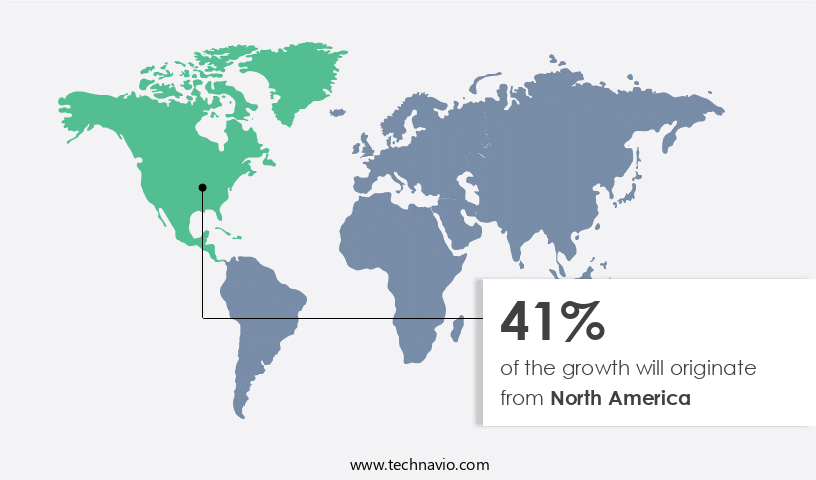
North America is estimated to contribute 41% to the growth of the global market during the forecast period. Technavio’s analysts have elaborately explained the regional trends and drivers that shape the market during the forecast period. In North America, the overall market, owing to the presence of well-established infrastructure and the ready adoption of advanced technologies among educational institutions and students. In this region, the US has been the major adopter of digitization, which makes the country a significant contributor to market revenue. In this region, the fast adoption of smart learning systems by educational institutions is facilitated by the presence of a high level of Internet infrastructure. In addition to hosting and cloud services, the software solutions introduced by vendors are increasingly available.
Market Segmentation by Type
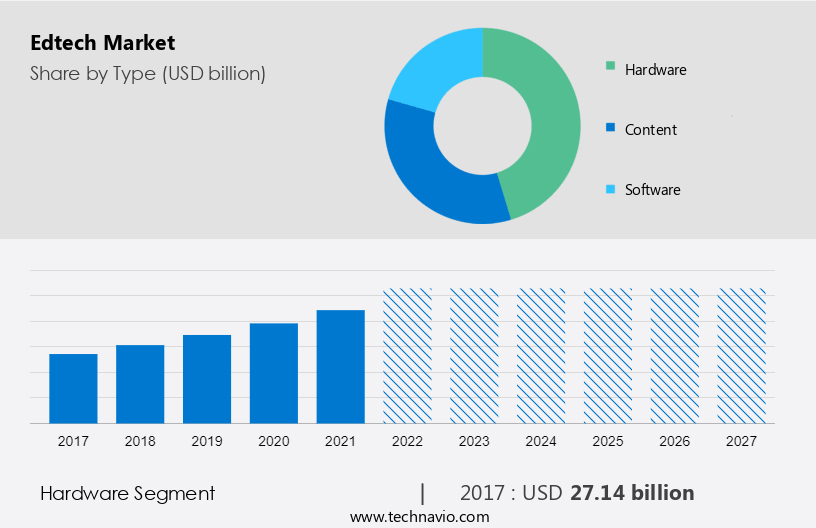
The market share growth by the hardware segment will be significant during the forecast period. The hardware segment includes educational, personal computers (PCs), interactive displays, classroom wearables, sound systems, projectors, and lecture capture solutions. There is an immense large proportion of university students, there is a huge increase in the adoption of personal computer devices such as desktops and laptops.
The hardware segments showed a gradual increase in the market share of USD 27.14 billion in 2017 and continued to grow by 2021. Technology-enabled classrooms often require computing devices to facilitate information access and dissemination. Digital displays with touch screens in classrooms have also been adopted by a large number of higher education institutions. The market for educational technology products that are available in schools is gaining momentum, ranging from flatscreen TVs to interactive whiteboards and projectors. Document cameras have also gained traction, owing to their benefits. Such factors will increase segment growth during the forecast period.
Key Trends and Challenges
It encompasses technological tools and innovations designed to enhance teaching and learning. The global market is experiencing rapid growth due to the increased adoption of digital learning solutions. Edtech platforms offer online courses, virtual classrooms, adaptive learning, and educational apps. The market is driven by the demand for personalized, interactive, and accessible educational experiences. The of K-12 teachers in the United States use some form of education technology in their classrooms. Online learning platforms have experienced a surge in popularity, with an increase in user enrollment over the past five years.
Future Trends
The integration of AR and VR in modern classrooms revolutionizes education, creating immersive learning environments. Utilizing smart devices like tablets and laptops, schools enhance engagement with communication technologies. AI (artificial intelligence) further transforms education, reducing the workload on teachers with applications like handwriting recognition and grading systems. Customizable lesson plans cater to individual student needs, closing learning gaps. As e-learning embraces these trends, including Learning Management Systems (LMS) and innovative platforms, the global education technology market is poised for significant growth. Hands-on experiences in various disciplines through VR headsets and smart glasses underscore the potential of technology in shaping market trends and analysis of the future of education.
Challenges and Opportunities in the Market
The availability of open-source learning content poses a challenge to the market. The COVID-19 pandemic shifted education online, impacting traditional learning methods. Economic downturns in nations like Brazil, Argentina, Chile, and South Africa hindered the reopening of educational institutions, exacerbating educational inequalities. To address inclusivity, there's a surge in open-source learning content, with universities offering free or low-cost courses. This has attracted students from economically challenged backgrounds, negatively impacting the market. Emphasizing skills, upskilling, and understanding industry trends becomes crucial for universities and institutes navigating the evolving landscape of online education.
Impact of Customer Landscape
The Market forecasting analysis report includes the adoption lifecycle of the market, from the innovator’s stage to the laggard’s stage. It focuses on adoption rates in different regions based on market penetration. Furthermore, the market research and growth report also includes key purchase criteria and drivers of price sensitivity to help companies evaluate and develop their growth strategies.
Customer Landscape
Market Analysis
Training to startups is reshaping the landscape of the EdTech industry, driving significant changes in curriculum and pedagogical approaches. As the sector experiences exponential growth due to huge investment into innovative solutions and edtech marketing results in shaping the future of diverse learners. Instance advancements in educational technology and the transformative power of online learning platforms (LMS) and tools. The integration of artificial intelligence in education enhances personalized learning experiences, while virtual reality and augmented reality redefine how students engage with educational content.
|
Industry Scope |
|
|
Report Coverage |
Details |
|
Page number |
165 |
|
Base year |
2022 |
|
Historic period |
2017 - 2021 |
|
Forecast period |
2023-2027 |
|
Growth momentum & CAGR |
Accelerate at a CAGR of 13.61% |
|
Market growth 2023-2027 |
USD 108.98 billion |
|
Market structure |
Fragmented |
|
YoY growth 2022-2023(%) |
13.37 |
|
Regional analysis |
North America, Europe, APAC, South America, and Middle East and Africa |
|
Performing market contribution |
North America at 41% |
|
Key countries |
US, Canada, China, Japan, and Germany |
|
Competitive landscape |
Leading Companies, Market Positioning of Companies, Competitive Strategies, and Industry Risks |
|
Key companies profiled |
2U Inc., Alphabet Inc., Anthology Inc., Chegg Inc., Cornerstone OnDemand Inc., Coursera Inc., D2L Corp., edX LLC, Ellucian Co. LP, Instructure Holdings Inc., Microsoft Corp., Oracle Corp., PleIQ Smart Toys Spa, Promethean World Ltd., Think and Learn Pvt. Ltd., Udacity Inc., UOL EdTech, upGrad Education Pvt. Ltd., Warner Bros Discovery Inc., and Workday Inc. |
|
Market dynamics |
Parent market analysis, Market growth inducers and obstacles, Fast-growing and slow-growing segment analysis, COVID 19 impact and recovery analysis and future consumer dynamics, condition analysis for the market projection period |
|
Customization purview |
If our report has not included the data that you are looking for, you can reach out to our analysts and get segments customized. |
What are the Key Data Covered in this Market Research Report?
- CAGR of the market forecast
- Detailed information of market report factors that will drive the growth of the market between 2023 and 2027
- Precise estimation of the size of the market size and its contribution of the market in focus to the parent market
- Accurate predictions about upcoming trends and changes in consumer behaviour
- The market growth and forecasting across North America, Europe, APAC, South America, and Middle East and Africa
- Thorough analysis of the market’s competitive landscape and market growth and trends
- Comprehensive analysis of factors that will challenge the growth of market companies
We can help! Our analysts can customize this market research report to meet your requirements. Get in touch
1 Executive Summary
- 1.1 Market overview
- Exhibit 01: Executive Summary – Chart on Market Overview
- Exhibit 02: Executive Summary – Data Table on Market Overview
- Exhibit 03: Executive Summary – Chart on Global Market Characteristics
- Exhibit 04: Executive Summary – Chart on Market by Geography
- Exhibit 05: Executive Summary – Chart on Market Segmentation by Type
- Exhibit 06: Executive Summary – Chart on Market Segmentation by Sector
- Exhibit 07: Executive Summary – Chart on Incremental Growth
- Exhibit 08: Executive Summary – Data Table on Incremental Growth
- Exhibit 09: Executive Summary – Chart on Vendor Market Positioning
2 Market Landscape
- 2.1 Market ecosystem
- Exhibit 10: Parent market
- Exhibit 11: Market Characteristics
3 Market Sizing
- 3.1 Market definition
- Exhibit 12: Offerings of vendors included in the market definition
- 3.2 Market segment analysis
- Exhibit 13: Market segments
- 3.3 Market size 2022
- 3.4 Market outlook: Forecast for 2022-2027
- Exhibit 14: Chart on Global - Market size and forecast 2022-2027 ($ billion)
- Exhibit 15: Data Table on Global - Market size and forecast 2022-2027 ($ billion)
- Exhibit 16: Chart on Global Market: Year-over-year growth 2022-2027 (%)
- Exhibit 17: Data Table on Global Market: Year-over-year growth 2022-2027 (%)
4 Historic Market Size
- 4.1 Global edtech market 2017 - 2021
- Exhibit 18: Historic Market Size – Data Table on global edtech market 2017 - 2021 ($ billion)
- 4.2 Type Segment Analysis 2017 - 2021
- Exhibit 19: Historic Market Size – Type Segment 2017 - 2021 ($ billion)
- 4.3 Sector Segment Analysis 2017 - 2021
- Exhibit 20: Historic Market Size – Sector Segment 2017 - 2021 ($ billion)
- 4.4 Geography Segment Analysis 2017 - 2021
- Exhibit 21: Historic Market Size – Geography Segment 2017 - 2021 ($ billion)
- 4.5 Country Segment Analysis 2017 - 2021
- Exhibit 22: Historic Market Size – Country Segment 2017 - 2021 ($ billion)
5 Five Forces Analysis
- 5.1 Five forces summary
- Exhibit 23: Five forces analysis - Comparison between 2022 and 2027
- 5.2 Bargaining power of buyers
- Exhibit 24: Chart on Bargaining power of buyers – Impact of key factors 2022 and 2027
- 5.3 Bargaining power of suppliers
- Exhibit 25: Bargaining power of suppliers – Impact of key factors in 2022 and 2027
- 5.4 Threat of new entrants
- Exhibit 26: Threat of new entrants – Impact of key factors in 2022 and 2027
- 5.5 Threat of substitutes
- Exhibit 27: Threat of substitutes – Impact of key factors in 2022 and 2027
- 5.6 Threat of rivalry
- Exhibit 28: Threat of rivalry – Impact of key factors in 2022 and 2027
- 5.7 Market condition
- Exhibit 29: Chart on Market condition - Five forces 2022 and 2027
6 Market Segmentation by Type
- 6.1 Market segments
- Exhibit 30: Chart on Type - Market share 2022-2027 (%)
- Exhibit 31: Data Table on Type - Market share 2022-2027 (%)
- 6.2 Comparison by Type
- Exhibit 32: Chart on Comparison by Type
- Exhibit 33: Data Table on Comparison by Type
- 6.3 Hardware - Market size and forecast 2022-2027
- Exhibit 34: Chart on Hardware - Market size and forecast 2022-2027 ($ billion)
- Exhibit 35: Data Table on Hardware - Market size and forecast 2022-2027 ($ billion)
- Exhibit 36: Chart on Hardware - Year-over-year growth 2022-2027 (%)
- Exhibit 37: Data Table on Hardware - Year-over-year growth 2022-2027 (%)
- 6.4 Content - Market size and forecast 2022-2027
- Exhibit 38: Chart on Content - Market size and forecast 2022-2027 ($ billion)
- Exhibit 39: Data Table on Content - Market size and forecast 2022-2027 ($ billion)
- Exhibit 40: Chart on Content - Year-over-year growth 2022-2027 (%)
- Exhibit 41: Data Table on Content - Year-over-year growth 2022-2027 (%)
- 6.5 Software - Market size and forecast 2022-2027
- Exhibit 42: Chart on Software - Market size and forecast 2022-2027 ($ billion)
- Exhibit 43: Data Table on Software - Market size and forecast 2022-2027 ($ billion)
- Exhibit 44: Chart on Software - Year-over-year growth 2022-2027 (%)
- Exhibit 45: Data Table on Software - Year-over-year growth 2022-2027 (%)
- 6.6 Market opportunity by Type
- Exhibit 46: Market opportunity by Type ($ billion)
- Exhibit 47: Data Table on Market opportunity by Type ($ billion)
7 Market Segmentation by Sector
- 7.1 Market segments
- Exhibit 48: Chart on Sector - Market share 2022-2027 (%)
- Exhibit 49: Data Table on Sector - Market share 2022-2027 (%)
- 7.2 Comparison by Sector
- Exhibit 50: Chart on Comparison by Sector
- Exhibit 51: Data Table on Comparison by Sector
- 7.3 K-12 - Market size and forecast 2022-2027
- Exhibit 52: Chart on K-12 - Market size and forecast 2022-2027 ($ billion)
- Exhibit 53: Data Table on K-12 - Market size and forecast 2022-2027 ($ billion)
- Exhibit 54: Chart on K-12 - Year-over-year growth 2022-2027 (%)
- Exhibit 55: Data Table on K-12 - Year-over-year growth 2022-2027 (%)
- 7.4 Higher education - Market size and forecast 2022-2027
- Exhibit 56: Chart on Higher education - Market size and forecast 2022-2027 ($ billion)
- Exhibit 57: Data Table on Higher education - Market size and forecast 2022-2027 ($ billion)
- Exhibit 58: Chart on Higher education - Year-over-year growth 2022-2027 (%)
- Exhibit 59: Data Table on Higher education - Year-over-year growth 2022-2027 (%)
- 7.5 Others - Market size and forecast 2022-2027
- Exhibit 60: Chart on Others - Market size and forecast 2022-2027 ($ billion)
- Exhibit 61: Data Table on Others - Market size and forecast 2022-2027 ($ billion)
- Exhibit 62: Chart on Others - Year-over-year growth 2022-2027 (%)
- Exhibit 63: Data Table on Others - Year-over-year growth 2022-2027 (%)
- 7.6 Market opportunity by Sector
- Exhibit 64: Market opportunity by Sector ($ billion)
- Exhibit 65: Data Table on Market opportunity by Sector ($ billion)
8 Customer Landscape
- 8.1 Customer landscape overview
- Exhibit 66: Analysis of price sensitivity, lifecycle, customer purchase basket, adoption rates, and purchase criteria
9 Geographic Landscape
- 9.1 Geographic segmentation
- Exhibit 67: Chart on Market share by geography 2022-2027 (%)
- Exhibit 68: Data Table on Market share by geography 2022-2027 (%)
- 9.2 Geographic comparison
- Exhibit 69: Chart on Geographic comparison
- Exhibit 70: Data Table on Geographic comparison
- 9.3 North America - Market size and forecast 2022-2027
- Exhibit 71: Chart on North America - Market size and forecast 2022-2027 ($ billion)
- Exhibit 72: Data Table on North America - Market size and forecast 2022-2027 ($ billion)
- Exhibit 73: Chart on North America - Year-over-year growth 2022-2027 (%)
- Exhibit 74: Data Table on North America - Year-over-year growth 2022-2027 (%)
- 9.4 Europe - Market size and forecast 2022-2027
- Exhibit 75: Chart on Europe - Market size and forecast 2022-2027 ($ billion)
- Exhibit 76: Data Table on Europe - Market size and forecast 2022-2027 ($ billion)
- Exhibit 77: Chart on Europe - Year-over-year growth 2022-2027 (%)
- Exhibit 78: Data Table on Europe - Year-over-year growth 2022-2027 (%)
- 9.5 APAC - Market size and forecast 2022-2027
- Exhibit 79: Chart on APAC - Market size and forecast 2022-2027 ($ billion)
- Exhibit 80: Data Table on APAC - Market size and forecast 2022-2027 ($ billion)
- Exhibit 81: Chart on APAC - Year-over-year growth 2022-2027 (%)
- Exhibit 82: Data Table on APAC - Year-over-year growth 2022-2027 (%)
- 9.6 South America - Market size and forecast 2022-2027
- Exhibit 83: Chart on South America - Market size and forecast 2022-2027 ($ billion)
- Exhibit 84: Data Table on South America - Market size and forecast 2022-2027 ($ billion)
- Exhibit 85: Chart on South America - Year-over-year growth 2022-2027 (%)
- Exhibit 86: Data Table on South America - Year-over-year growth 2022-2027 (%)
- 9.7 Middle East and Africa - Market size and forecast 2022-2027
- Exhibit 87: Chart on Middle East and Africa - Market size and forecast 2022-2027 ($ billion)
- Exhibit 88: Data Table on Middle East and Africa - Market size and forecast 2022-2027 ($ billion)
- Exhibit 89: Chart on Middle East and Africa - Year-over-year growth 2022-2027 (%)
- Exhibit 90: Data Table on Middle East and Africa - Year-over-year growth 2022-2027 (%)
- 9.8 US - Market size and forecast 2022-2027
- Exhibit 91: Chart on US - Market size and forecast 2022-2027 ($ billion)
- Exhibit 92: Data Table on US - Market size and forecast 2022-2027 ($ billion)
- Exhibit 93: Chart on US - Year-over-year growth 2022-2027 (%)
- Exhibit 94: Data Table on US - Year-over-year growth 2022-2027 (%)
- 9.9 Germany - Market size and forecast 2022-2027
- Exhibit 95: Chart on Germany - Market size and forecast 2022-2027 ($ billion)
- Exhibit 96: Data Table on Germany - Market size and forecast 2022-2027 ($ billion)
- Exhibit 97: Chart on Germany - Year-over-year growth 2022-2027 (%)
- Exhibit 98: Data Table on Germany - Year-over-year growth 2022-2027 (%)
- 9.10 China - Market size and forecast 2022-2027
- Exhibit 99: Chart on China - Market size and forecast 2022-2027 ($ billion)
- Exhibit 100: Data Table on China - Market size and forecast 2022-2027 ($ billion)
- Exhibit 101: Chart on China - Year-over-year growth 2022-2027 (%)
- Exhibit 102: Data Table on China - Year-over-year growth 2022-2027 (%)
- 9.11 Canada - Market size and forecast 2022-2027
- Exhibit 103: Chart on Canada - Market size and forecast 2022-2027 ($ billion)
- Exhibit 104: Data Table on Canada - Market size and forecast 2022-2027 ($ billion)
- Exhibit 105: Chart on Canada - Year-over-year growth 2022-2027 (%)
- Exhibit 106: Data Table on Canada - Year-over-year growth 2022-2027 (%)
- 9.12 Japan - Market size and forecast 2022-2027
- Exhibit 107: Chart on Japan - Market size and forecast 2022-2027 ($ billion)
- Exhibit 108: Data Table on Japan - Market size and forecast 2022-2027 ($ billion)
- Exhibit 109: Chart on Japan - Year-over-year growth 2022-2027 (%)
- Exhibit 110: Data Table on Japan - Year-over-year growth 2022-2027 (%)
- 9.13 Market opportunity by geography
- Exhibit 111: Market opportunity by geography ($ billion)
- Exhibit 112: Data Tables on Market opportunity by geography ($ billion)
10 Drivers, Challenges, and Trends
- 10.1 Market drivers
- 10.2 Market challenges
- 10.3 Impact of drivers and challenges
- Exhibit 113: Impact of drivers and challenges in 2022 and 2027
- 10.4 Market trends
11 Vendor Landscape
- 11.1 Overview
- 11.2 Vendor landscape
- Exhibit 114: Overview on Criticality of inputs and Factors of differentiation
- 11.3 Landscape disruption
- Exhibit 115: Overview on factors of disruption
- 11.4 Industry risks
- Exhibit 116: Impact of key risks on business
12 Vendor Analysis
- 12.1 Vendors covered
- Exhibit 117: Vendors covered
- 12.2 Market positioning of vendors
- Exhibit 118: Matrix on vendor position and classification
- 12.3 2U Inc.
- Exhibit 119: 2U Inc. - Overview
- Exhibit 120: 2U Inc. - Business segments
- Exhibit 121: 2U Inc. - Key news
- Exhibit 122: 2U Inc. - Key offerings
- Exhibit 123: 2U Inc. - Segment focus
- 12.4 Alphabet Inc.
- Exhibit 124: Alphabet Inc. - Overview
- Exhibit 125: Alphabet Inc. - Business segments
- Exhibit 126: Alphabet Inc. - Key news
- Exhibit 127: Alphabet Inc. - Key offerings
- Exhibit 128: Alphabet Inc. - Segment focus
- 12.5 Anthology Inc.
- Exhibit 129: Anthology Inc. - Overview
- Exhibit 130: Anthology Inc. - Product / Service
- Exhibit 131: Anthology Inc. - Key offerings
- 12.6 Chegg Inc.
- Exhibit 132: Chegg Inc. - Overview
- Exhibit 133: Chegg Inc. - Product / Service
- Exhibit 134: Chegg Inc. - Key news
- Exhibit 135: Chegg Inc. - Key offerings
- 12.7 Cornerstone OnDemand Inc.
- Exhibit 136: Cornerstone OnDemand Inc. - Overview
- Exhibit 137: Cornerstone OnDemand Inc. - Product / Service
- Exhibit 138: Cornerstone OnDemand Inc. - Key offerings
- 12.8 Coursera Inc.
- Exhibit 139: Coursera Inc. - Overview
- Exhibit 140: Coursera Inc. - Business segments
- Exhibit 141: Coursera Inc. - Key offerings
- Exhibit 142: Coursera Inc. - Segment focus
- 12.9 D2L Corp.
- Exhibit 143: D2L Corp. - Overview
- Exhibit 144: D2L Corp. - Product / Service
- Exhibit 145: D2L Corp. - Key news
- Exhibit 146: D2L Corp. - Key offerings
- 12.10 edX LLC
- Exhibit 147: edX LLC - Overview
- Exhibit 148: edX LLC - Product / Service
- Exhibit 149: edX LLC - Key offerings
- 12.11 Ellucian Co. LP
- Exhibit 150: Ellucian Co. LP - Overview
- Exhibit 151: Ellucian Co. LP - Product / Service
- Exhibit 152: Ellucian Co. LP - Key offerings
- 12.12 Instructure Holdings Inc.
- Exhibit 153: Instructure Holdings Inc. - Overview
- Exhibit 154: Instructure Holdings Inc. - Product / Service
- Exhibit 155: Instructure Holdings Inc. - Key offerings
- 12.13 Microsoft Corp.
- Exhibit 156: Microsoft Corp. - Overview
- Exhibit 157: Microsoft Corp. - Business segments
- Exhibit 158: Microsoft Corp. - Key news
- Exhibit 159: Microsoft Corp. - Key offerings
- Exhibit 160: Microsoft Corp. - Segment focus
- 12.14 Think and Learn Pvt. Ltd.
- Exhibit 161: Think and Learn Pvt. Ltd. - Overview
- Exhibit 162: Think and Learn Pvt. Ltd. - Product / Service
- Exhibit 163: Think and Learn Pvt. Ltd. - Key offerings
- 12.15 Udacity Inc.
- Exhibit 164: Udacity Inc. - Overview
- Exhibit 165: Udacity Inc. - Product / Service
- Exhibit 166: Udacity Inc. - Key offerings
- 12.16 upGrad Education Pvt. Ltd.
- Exhibit 167: upGrad Education Pvt. Ltd. - Overview
- Exhibit 168: upGrad Education Pvt. Ltd. - Product / Service
- Exhibit 169: upGrad Education Pvt. Ltd. - Key offerings
- 12.17 Warner Bros Discovery Inc.
- Exhibit 170: Warner Bros Discovery Inc. - Overview
- Exhibit 171: Warner Bros Discovery Inc. - Business segments
- Exhibit 172: Warner Bros Discovery Inc. - Key offerings
- Exhibit 173: Warner Bros Discovery Inc. - Segment focus
13 Appendix
- 13.1 Scope of the report
- 13.2 Inclusions and exclusions checklist
- Exhibit 174: Inclusions checklist
- Exhibit 175: Exclusions checklist
- 13.3 Currency conversion rates for US$
- Exhibit 176: Currency conversion rates for US$
- 13.4 Research methodology
- Exhibit 177: Research methodology
- Exhibit 178: Validation techniques employed for market sizing
- Exhibit 179: Information sources
- 13.5 List of abbreviations
- Exhibit 180: List of abbreviations
Research Framework
Technavio presents a detailed picture of the market by way of study, synthesis, and summation of data from multiple sources. The analysts have presented the various facets of the market with a particular focus on identifying the key industry influencers. The data thus presented is comprehensive, reliable, and the result of extensive research, both primary and secondary.
INFORMATION SOURCES
Primary sources
- Manufacturers and suppliers
- Channel partners
- Industry experts
- Strategic decision makers
Secondary sources
- Industry journals and periodicals
- Government data
- Financial reports of key industry players
- Historical data
- Press releases
DATA ANALYSIS
Data Synthesis
- Collation of data
- Estimation of key figures
- Analysis of derived insights
Data Validation
- Triangulation with data models
- Reference against proprietary databases
- Corroboration with industry experts
REPORT WRITING
Qualitative
- Market drivers
- Market challenges
- Market trends
- Five forces analysis
Quantitative
- Market size and forecast
- Market segmentation
- Geographical insights
- Competitive landscape
PURCHASE FULL REPORT OF
edtech market market
Key Questions Answered
- What are the key global market and the regional market share?
- What are the revenue-generating key market segments?
- What are the key factors driving and challenging this market’s growth?
- Who are the key market vendors and their growth strategies?
- What are the latest trends influencing the growth of this market?
- What are the variables influencing the market growth in the primary regions?
- What are the factors influencing the growth of the parent market?
Why should you prefer Technavio's market insights report?
- Off-the-shelf research reports
- Reports can be tailored to meet the customer's needs
- Trusted by more than 100 fortune 500 organizations
- Information about the market's key drivers, trends, and challenges
- Parent market analysis
- Every week, 50,000 people visit our subscription platform
- Detailed vendors report with competitive landscape
- Covid-19 impact and recovery analysis
- Data on revenue-generating market segments
- Details on the market shares of various regions
- Five-force market analysis