Flat Panel Display (FPD) Equipment Market Analysis APAC, North America, Europe, South America, Middle East and Africa - US, Japan, China, India, Germany - Size and Forecast 2024-2028
| Published: Nov 2023 | Pages: 168 | SKU: IRTNTR44142 |
Flat Panel Display (FPD) Equipment Market 2024-2028 :
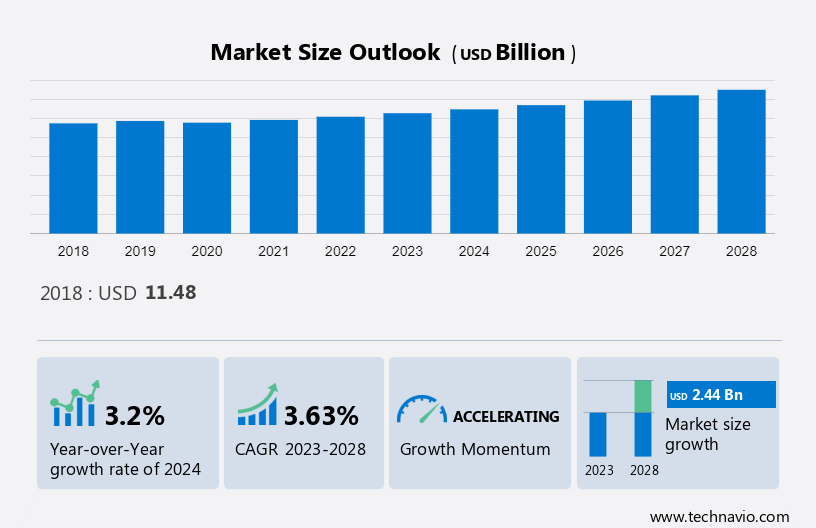
The Flat Panel Display (FPD) Equipment Market is anticipated to experience substantial growth, projected at a Compound Annual Growth Rate (CAGR) of 3.63% between 2023 and 2028, with an estimated market size to increase by USD 2.44 billion. This market is structured in a fragmented manner, exhibiting a Year-over-Year (YoY) growth of 3.2% in 2023-2024. In the regional breakdown, this analysis includes APAC, North America, Europe, South America, and the Middle East and Africa, with APAC contributing significantly, standing at 39%. Key countries propelling this market include the US, China, Japan, Germany, and UK.
A flat panel display is an electronic viewing device to see content such as images, videos, text, or other visual material. Flat panel displays are used in a wide range of entertainment products, such as consumer electronics like personal computers, mobile devices, televisions, and other display appliances, and in other products such as medical, transportation, and industrial equipment. A flat panel display equipment is any machinery that is used to manufacture flat panel displays for the above-mentioned applications.The growth of the market depends on several factors such as the production capacity expansion of display manufacturers, the growing need for high-performance displays and the increasing demand for flat panel displays in the automotive sector.
What will be the size of the Flat Panel Display Equipment Market During the Forecast Period?
For More Highlights About this Report, Download Free Sample in a Minute
Flat Panel Display Equipment Market Overview
Flat Panel Display Equipment Market Driver
Production capacity expansion of display manufacturers is notably driving the market growth. The expansion of production capacity is one of the major factors driving the growth of the flat panel display equipment market. Display manufacturers are moving toward the production of high-resolution displays for notebooks, smartphones, tablets, and TVs. Therefore, display manufacturers are switching to metal oxide and AMOLED displays for producing ultra-high-resolution displays as they are cost-efficient and energy-efficient. To meet the growing demand of consumers for AMOLEDs, display manufacturers are increasing their production capacity.
For instance, in Aug 2021, LG Display will invest 3.3 trillion won to expand its medium-and-small sized OLED display production capacity. The investment will be used in OLED facilities in South Korea that manufacture sixth-generation (1,500mm x 1,850mm) substrates. Companies are working on ramping up their AMOLED and TFT LCD fabs. As the manufacturer expands the production capacity of high-resolution displays for notebooks, smartphones, tablets, and TVs, this will drive the growth of the global flat panel display equipment market during the forecast period.
Flat Panel Display Equipment Market Trends
Increasing adoption of touch-enabled digital signage is an emerging trend shaping the market growth. The increasing adoption of touch-enabled digital signage is one of the major trends driving the growth of the flat panel display equipment market. Interactive Digital Signage refers to a form of digital display technology that allows users to interact with the content being displayed through touchscreens, gesture control, or other input methods. Advancements in display technologies, such as high-resolution screens and multi-touch capabilities, are constantly improving the interactive digital signage experience. To remain competitive amid rapid growth in the e-commerce sector, brick-and-mortar retailers have increased interactions with consumers through IT kiosks and digital signage. These touch-enabled kiosks in retail outlets are allowing consumers to browse through stock and order products.
Moreover, some outlets are using touch-enabled tables to display product ranges. It is estimated that retailers will rapidly adopt such concepts as they try to narrow the gap between their business models and e-commerce players. Demand for touchscreen displays has increased globally in the retail sector. This intensifies the production of flat panel displays to meet the growing demand for digital signage. This further leads to the establishment of more fabs manufacturing flat panel displays for digital signage, which, in turn, helps to drive the growth of the global flat panel display equipment market during the forecast period.
Flat Panel Display Equipment Market Restrain
A concentrated customer base is a significant challenge hindering market growth. The concentrated customer base is one of the major challenges in the flat panel display equipment market. The vendor semiconductor customer base is concentrated due to industry dynamics and the ever-changing economic scenario globally. The top customers of Applied Materials are still Intel (INTC) and Taiwan Semiconductor Manufacturing (TSM). Customers have also entered strategic alliances to increase the influence of industry participants on technology decisions made by stakeholders. The customer mix, customer type, and individual sales vary quarter-wise and year-wise.
In addition, as the products are designed to customer specifications, changing, rescheduling, or canceling orders may lead to a significant risk of losses in terms of unrecoverable costs. If customers place substantially fewer order quantities or delay or cancel orders, vendors may face losses adversely affecting the company operations. Hence, the concentrated customer base poses a significant challenge to the growth of the global flat panel display equipment market during the forecast period.
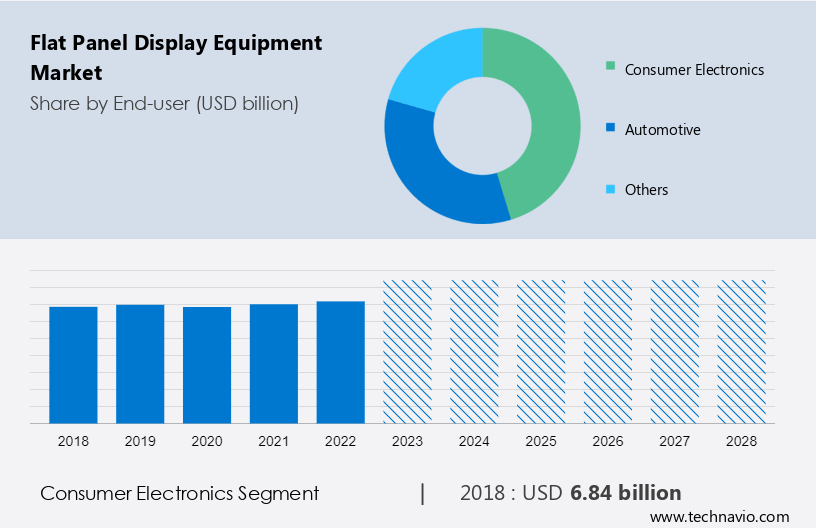
Flat Panel Display Equipment Market Segmentation By End-user Segment
The market share growth by the consumer electronics segment will be significant during the forecast period. The consumer electronics segment is growing at a significant growth rate in the flat panel display (FPD) equipment market. The growing adoption of AMOLEDs for smartphones, tablets, laptops, and LEDs for TVs and other appliances drives the flat panel display (FPD) equipment market in the consumer electronics segment. Also, OLED TVs are gaining traction among consumers. The growing demand for high-resolution and rich color-quality displays is driving the adoption of OLED TVs.
Get a glance at the market contribution of various segments Download the PDF Sample
The consumer electronics segment was the largest and was valued at USD 6.83 billion in 2018. Also, there is an increasing demand for ultra-high-definition (UHD) LCD/ LED TVs, primarily 4K TVs of 40 inches and larger. In 2021, many manufacturers introduced 4K TVs of size 50 inches and above. For instance, in April 2021, Sony India announced the launch of its all-new X80J Google television series with a 4K Ultra HD LED display. Moreover, Netflix, Amazon (Amazon Instant Video service), Ultraflix, and YouTube are the leading UHD content providers. Other content vendors include Vudu and Sony Ultra. This increase in UHD content by service providers will drive the demand for 4K TV products, which will further intensify the demand for LED flat panel displays, contributing to the growth of the global flat panel display equipment market during the forecast period.
Flat Panel Display Equipment Market Segmentation By Technology Segment
The amorphous silicon (a-Si) technology segment is growing at a steady growth rate in the global flat panel display equipment market. Amorphous silicon (a-Si) thin film transistor-liquid crystal display (TFT-LCD) has been the dominant technology for the manufacturing of active matrix TFT-LCD for over 20 years due to low-cost material and the abundant supply. Amorphous silicon is the widely used material for backplane technology and comes with a variety of different manufacturing methods to improve its energy efficiency, refresh speeds, and display viewing angle. Furthermore, it is cheaper than LTPS technology. With the growing proliferation of smart TVs across the globe, the demand for a-Si technology will decrease owing to the increase in the advanced OLED display demand. In addition, the fluctuations in the demand pattern of Si-based flat panel display equipment are attributed to limited continuous investments. Investments in flat panel display equipment are always substantial in nature and are long-term, declining the growth of the global flat panel display equipment market during the forecast period.
Regional Overview
For more insights on the market share of various regions Download PDF Sample now!
APAC is estimated to contribute 39% to the growth of the global market during the forecast period. Technavio’s analysts have elaborately explained the regional trends and drivers that shape the market during the forecast period. The APAC region is growing at a significant growth rate in the flat panel display equipment market. In 2023, APAC dominated the flat panel display (FPD) equipment market because of the high concentration of display device manufacturers and LCD and OLED panel manufacturers in the region. Moreover, in 2022, Japan has maintained its leadership in equipment used to make flat panel displays. Japanese companies supplied more than 50% of the market for flat panel display manufacturing equipment. Furthermore, the well-established supply chain for display devices in APAC will support the region's dominance in the market during the forecast period.
The outbreak of the COVID-19 pandemic in 2020 severely affected the economic growth in APAC. However, in 2021, the initiation of large-scale vaccination drives led to the lifting of lockdown and trade restrictions in the region. The education sector saw huge demand for tablets, computers, and home personal computers, which fueled the flat panel display (FPD) equipment market growth. As a result, with the increasing demand for consumer electronics such as tablets, computers, and smart wearables, the regional flat panel display equipment market in APAC is expected to grow during the forecast period.
Flat Panel Display Equipment Market Customer Landscape
The Flat Panel Display Equipment Market Analysis report includes the adoption lifecycle of the market, covering from the innovator’s stage to the laggard’s stage. It focuses on adoption rates in different regions based on penetration. Furthermore, the report also includes key purchase criteria and drivers of price sensitivity to help companies evaluate and develop their growth strategies.
Global Flat Panel Display Equipment Market Customer Landscape
Who are the Major Flat Panel Display Equipment Market Companies?
Companies are implementing various strategies, such as strategic alliances, partnerships, mergers and acquisitions, geographical expansion, and product/service launches, to enhance their presence in the market.
Applied Materials Inc. - The company offers flat panel display equipment such as AKT eBeam for LCD and OLED displays.
Camfil AB - The company offers flat panel display equipment such as Camfil HEPA and ULPA filters to improve display quality, reduce product yield losses, minimise downtime and increase profitability.
Canon Inc.- The company offers flat panel display equipment under Canon MPAsp Series such as MPAsp-E9032, MPAsp-E813H, MPAsp-H1003H and MPAsp-H1003T.
The research report also includes detailed analyses of the competitive landscape of the market and information about 20 market companies, including:
- Coreflow Ltd.
- Hitachi Ltd.
- HORIBA Ltd.
- JTEKT Corp.
- KLA Corp.
- Lasertec Corp
- Manz AG
- Micronics Japan Co. Ltd.
- Nikon Corp.
- Nissin Ion Equipment Co. Ltd.
- Screen Holdings Co. Ltd.
- Soleras Advanced Coatings BV
- Solutions Technologies Pvt Ltd.
- Soonhan Co. Ltd.
- TBS Holdings Inc.
- ULVAC Inc.
- VON ARDENNE GMBH
Qualitative and quantitative analysis of companies has been conducted to help clients understand the wider business environment as well as the strengths and weaknesses of key market players. Data is qualitatively analyzed to categorize companies as pure play, category-focused, industry-focused, and diversified; it is quantitatively analyzed to categorize companies as dominant, leading, strong, tentative, and weak.
Segment Overview
The flat panel display equipment market report forecasts market growth by revenue at global, regional & country levels and provides an analysis of the latest trends and growth opportunities from 2018 - 2022.
- End-user Outlook
- Consumer electronics
- Automotive
- Others
- Technology Outlook
- a-Si
- LTPS
- Region Outlook
- North America
- The U.S.
- Canada
- South America
- Chile
- Brazil
- Argentina
- Europe
- U.K.
- Germany
- France
- Rest of Europe
- APAC
- China
- India
- Middle East & Africa
- Saudi Arabia
- South Africa
- Rest of the Middle East & Africa
- North America
|
Flat Panel Display Equipment Market Scope |
|
|
Report Coverage |
Details |
|
Page number |
168 |
|
Base year |
2023 |
|
Historic period |
2018-2022 |
|
Forecast period |
2024-2028 |
|
Growth momentum & CAGR |
Accelerate at a CAGR of 3.63% |
|
Market Growth 2024-2028 |
USD 2.44 billion |
|
Market structure |
Fragmented |
|
YoY growth 2023-2024(%) |
3.2 |
|
Regional analysis |
APAC, North America, Europe, South America, and Middle East and Africa |
|
Performing market contribution |
APAC at 39% |
|
Key countries |
US, Japan, China, India, and Germany |
|
Competitive landscape |
Leading Companies, Market Positioning of Companies, Competitive Strategies, and Industry Risks |
|
Key companies profiled |
Applied Materials Inc., Camfil AB, Canon Inc., Coreflow Ltd., Hitachi Ltd., HORIBA Ltd., JTEKT Corp., KLA Corp., Lasertec Corp, Manz AG, Micronics Japan Co. Ltd., Nikon Corp., Nissin Ion Equipment Co. Ltd., Screen Holdings Co. Ltd., Soleras Advanced Coatings BV, Solutions Technologies Pvt Ltd., Soonhan Co. Ltd., TBS Holdings Inc., ULVAC Inc., and VON ARDENNE GMBH |
|
Market dynamics |
Parent market analysis, Market growth inducers and obstacles, Fast-growing and slow-growing segment analysis, COVID-19 impact and recovery analysis and future consumer dynamics, Market condition analysis for forecast period. |
|
Customization purview |
If our report has not included the data that you are looking for, you can reach out to our analysts and get segments customized. |
What are the Key Data Covered in this Flat Panel Display Equipment Market Research Report?
- CAGR of the market during the forecast period
- Detailed information on factors that will drive the growth of the market between 2024 and 2028
- Precise estimation of the market size and its contribution of the market in focus to the parent market
- Accurate predictions about upcoming trends and changes in consumer behaviour
- Growth of the market across APAC, North America, Europe, South America, and Middle East and Africa
- Thorough analysis of the market’s competitive landscape and detailed information about companies
- Comprehensive analysis of factors that will challenge the growth of market companies
We can help! Our analysts can customize this market research report to meet your requirements.
1 Executive Summary
- 1.1 Market overview
- Exhibit 01: Executive Summary – Chart on Market Overview
- Exhibit 02: Executive Summary – Data Table on Market Overview
- Exhibit 03: Executive Summary – Chart on Global Market Characteristics
- Exhibit 04: Executive Summary – Chart on Market by Geography
- Exhibit 05: Executive Summary – Chart on Market Segmentation by End-user
- Exhibit 06: Executive Summary – Chart on Market Segmentation by Technology
- Exhibit 07: Executive Summary – Chart on Incremental Growth
- Exhibit 08: Executive Summary – Data Table on Incremental Growth
- Exhibit 09: Executive Summary – Chart on Vendor Market Positioning
2 Market Landscape
- 2.1 Market ecosystem
- Exhibit 10: Parent market
- Exhibit 11: Market Characteristics
3 Market Sizing
- 3.1 Market definition
- Exhibit 12: Offerings of vendors included in the market definition
- 3.2 Market segment analysis
- Exhibit 13: Market segments
- 3.3 Market size 2023
- 3.4 Market outlook: Forecast for 2023-2028
- Exhibit 14: Chart on Global - Market size and forecast 2023-2028 ($ billion)
- Exhibit 15: Data Table on Global - Market size and forecast 2023-2028 ($ billion)
- Exhibit 16: Chart on Global Market: Year-over-year growth 2023-2028 (%)
- Exhibit 17: Data Table on Global Market: Year-over-year growth 2023-2028 (%)
4 Historic Market Size
- 4.1 Global flat panel display equipment market 2018 - 2022
- Exhibit 18: Historic Market Size – Data Table on global flat panel display equipment market 2018 - 2022 ($ billion)
- 4.2 End-user Segment Analysis 2018 - 2022
- Exhibit 19: Historic Market Size – End-user Segment 2018 - 2022 ($ billion)
- 4.3 Technology Segment Analysis 2018 - 2022
- Exhibit 20: Historic Market Size – Technology Segment 2018 - 2022 ($ billion)
- 4.4 Geography Segment Analysis 2018 - 2022
- Exhibit 21: Historic Market Size – Geography Segment 2018 - 2022 ($ billion)
- 4.5 Country Segment Analysis 2018 - 2022
- Exhibit 22: Historic Market Size – Country Segment 2018 - 2022 ($ billion)
5 Five Forces Analysis
- 5.1 Five forces summary
- Exhibit 23: Five forces analysis - Comparison between 2023 and 2028
- 5.2 Bargaining power of buyers
- Exhibit 24: Chart on Bargaining power of buyers – Impact of key factors 2023 and 2028
- 5.3 Bargaining power of suppliers
- Exhibit 25: Bargaining power of suppliers – Impact of key factors in 2023 and 2028
- 5.4 Threat of new entrants
- Exhibit 26: Threat of new entrants – Impact of key factors in 2023 and 2028
- 5.5 Threat of substitutes
- Exhibit 27: Threat of substitutes – Impact of key factors in 2023 and 2028
- 5.6 Threat of rivalry
- Exhibit 28: Threat of rivalry – Impact of key factors in 2023 and 2028
- 5.7 Market condition
- Exhibit 29: Chart on Market condition - Five forces 2023 and 2028
6 Market Segmentation by End-user
- 6.1 Market segments
- Exhibit 30: Chart on End-user - Market share 2023-2028 (%)
- Exhibit 31: Data Table on End-user - Market share 2023-2028 (%)
- 6.2 Comparison by End-user
- Exhibit 32: Chart on Comparison by End-user
- Exhibit 33: Data Table on Comparison by End-user
- 6.3 Consumer electronics - Market size and forecast 2023-2028
- Exhibit 34: Chart on Consumer electronics - Market size and forecast 2023-2028 ($ billion)
- Exhibit 35: Data Table on Consumer electronics - Market size and forecast 2023-2028 ($ billion)
- Exhibit 36: Chart on Consumer electronics - Year-over-year growth 2023-2028 (%)
- Exhibit 37: Data Table on Consumer electronics - Year-over-year growth 2023-2028 (%)
- 6.4 Automotive - Market size and forecast 2023-2028
- Exhibit 38: Chart on Automotive - Market size and forecast 2023-2028 ($ billion)
- Exhibit 39: Data Table on Automotive - Market size and forecast 2023-2028 ($ billion)
- Exhibit 40: Chart on Automotive - Year-over-year growth 2023-2028 (%)
- Exhibit 41: Data Table on Automotive - Year-over-year growth 2023-2028 (%)
- 6.5 Others - Market size and forecast 2023-2028
- Exhibit 42: Chart on Others - Market size and forecast 2023-2028 ($ billion)
- Exhibit 43: Data Table on Others - Market size and forecast 2023-2028 ($ billion)
- Exhibit 44: Chart on Others - Year-over-year growth 2023-2028 (%)
- Exhibit 45: Data Table on Others - Year-over-year growth 2023-2028 (%)
- 6.6 Market opportunity by End-user
- Exhibit 46: Market opportunity by End-user ($ billion)
- Exhibit 47: Data Table on Market opportunity by End-user ($ billion)
7 Market Segmentation by Technology
- 7.1 Market segments
- Exhibit 48: Chart on Technology - Market share 2023-2028 (%)
- Exhibit 49: Data Table on Technology - Market share 2023-2028 (%)
- 7.2 Comparison by Technology
- Exhibit 50: Chart on Comparison by Technology
- Exhibit 51: Data Table on Comparison by Technology
- 7.3 a-Si - Market size and forecast 2023-2028
- Exhibit 52: Chart on a-Si - Market size and forecast 2023-2028 ($ billion)
- Exhibit 53: Data Table on a-Si - Market size and forecast 2023-2028 ($ billion)
- Exhibit 54: Chart on a-Si - Year-over-year growth 2023-2028 (%)
- Exhibit 55: Data Table on a-Si - Year-over-year growth 2023-2028 (%)
- 7.4 LTPS - Market size and forecast 2023-2028
- Exhibit 56: Chart on LTPS - Market size and forecast 2023-2028 ($ billion)
- Exhibit 57: Data Table on LTPS - Market size and forecast 2023-2028 ($ billion)
- Exhibit 58: Chart on LTPS - Year-over-year growth 2023-2028 (%)
- Exhibit 59: Data Table on LTPS - Year-over-year growth 2023-2028 (%)
- 7.5 Market opportunity by Technology
- Exhibit 60: Market opportunity by Technology ($ billion)
- Exhibit 61: Data Table on Market opportunity by Technology ($ billion)
8 Customer Landscape
- 8.1 Customer landscape overview
- Exhibit 62: Analysis of price sensitivity, lifecycle, customer purchase basket, adoption rates, and purchase criteria
9 Geographic Landscape
- 9.1 Geographic segmentation
- Exhibit 63: Chart on Market share by geography 2023-2028 (%)
- Exhibit 64: Data Table on Market share by geography 2023-2028 (%)
- 9.2 Geographic comparison
- Exhibit 65: Chart on Geographic comparison
- Exhibit 66: Data Table on Geographic comparison
- 9.3 APAC - Market size and forecast 2023-2028
- Exhibit 67: Chart on APAC - Market size and forecast 2023-2028 ($ billion)
- Exhibit 68: Data Table on APAC - Market size and forecast 2023-2028 ($ billion)
- Exhibit 69: Chart on APAC - Year-over-year growth 2023-2028 (%)
- Exhibit 70: Data Table on APAC - Year-over-year growth 2023-2028 (%)
- 9.4 North America - Market size and forecast 2023-2028
- Exhibit 71: Chart on North America - Market size and forecast 2023-2028 ($ billion)
- Exhibit 72: Data Table on North America - Market size and forecast 2023-2028 ($ billion)
- Exhibit 73: Chart on North America - Year-over-year growth 2023-2028 (%)
- Exhibit 74: Data Table on North America - Year-over-year growth 2023-2028 (%)
- 9.5 Europe - Market size and forecast 2023-2028
- Exhibit 75: Chart on Europe - Market size and forecast 2023-2028 ($ billion)
- Exhibit 76: Data Table on Europe - Market size and forecast 2023-2028 ($ billion)
- Exhibit 77: Chart on Europe - Year-over-year growth 2023-2028 (%)
- Exhibit 78: Data Table on Europe - Year-over-year growth 2023-2028 (%)
- 9.6 South America - Market size and forecast 2023-2028
- Exhibit 79: Chart on South America - Market size and forecast 2023-2028 ($ billion)
- Exhibit 80: Data Table on South America - Market size and forecast 2023-2028 ($ billion)
- Exhibit 81: Chart on South America - Year-over-year growth 2023-2028 (%)
- Exhibit 82: Data Table on South America - Year-over-year growth 2023-2028 (%)
- 9.7 Middle East and Africa - Market size and forecast 2023-2028
- Exhibit 83: Chart on Middle East and Africa - Market size and forecast 2023-2028 ($ billion)
- Exhibit 84: Data Table on Middle East and Africa - Market size and forecast 2023-2028 ($ billion)
- Exhibit 85: Chart on Middle East and Africa - Year-over-year growth 2023-2028 (%)
- Exhibit 86: Data Table on Middle East and Africa - Year-over-year growth 2023-2028 (%)
- 9.8 Japan - Market size and forecast 2023-2028
- Exhibit 87: Chart on Japan - Market size and forecast 2023-2028 ($ billion)
- Exhibit 88: Data Table on Japan - Market size and forecast 2023-2028 ($ billion)
- Exhibit 89: Chart on Japan - Year-over-year growth 2023-2028 (%)
- Exhibit 90: Data Table on Japan - Year-over-year growth 2023-2028 (%)
- 9.9 US - Market size and forecast 2023-2028
- Exhibit 91: Chart on US - Market size and forecast 2023-2028 ($ billion)
- Exhibit 92: Data Table on US - Market size and forecast 2023-2028 ($ billion)
- Exhibit 93: Chart on US - Year-over-year growth 2023-2028 (%)
- Exhibit 94: Data Table on US - Year-over-year growth 2023-2028 (%)
- 9.10 China - Market size and forecast 2023-2028
- Exhibit 95: Chart on China - Market size and forecast 2023-2028 ($ billion)
- Exhibit 96: Data Table on China - Market size and forecast 2023-2028 ($ billion)
- Exhibit 97: Chart on China - Year-over-year growth 2023-2028 (%)
- Exhibit 98: Data Table on China - Year-over-year growth 2023-2028 (%)
- 9.11 India - Market size and forecast 2023-2028
- Exhibit 99: Chart on India - Market size and forecast 2023-2028 ($ billion)
- Exhibit 100: Data Table on India - Market size and forecast 2023-2028 ($ billion)
- Exhibit 101: Chart on India - Year-over-year growth 2023-2028 (%)
- Exhibit 102: Data Table on India - Year-over-year growth 2023-2028 (%)
- 9.12 Germany - Market size and forecast 2023-2028
- Exhibit 103: Chart on Germany - Market size and forecast 2023-2028 ($ billion)
- Exhibit 104: Data Table on Germany - Market size and forecast 2023-2028 ($ billion)
- Exhibit 105: Chart on Germany - Year-over-year growth 2023-2028 (%)
- Exhibit 106: Data Table on Germany - Year-over-year growth 2023-2028 (%)
- 9.13 Market opportunity by geography
- Exhibit 107: Market opportunity by geography ($ billion)
- Exhibit 108: Data Tables on Market opportunity by geography ($ billion)
10 Drivers, Challenges, and Trends
- 10.1 Market drivers
- 10.2 Market challenges
- 10.3 Impact of drivers and challenges
- Exhibit 109: Impact of drivers and challenges in 2023 and 2028
- 10.4 Market trends
11 Vendor Landscape
- 11.1 Overview
- 11.2 Vendor landscape
- Exhibit 110: Overview on Criticality of inputs and Factors of differentiation
- 11.3 Landscape disruption
- Exhibit 111: Overview on factors of disruption
- 11.4 Industry risks
- Exhibit 112: Impact of key risks on business
12 Vendor Analysis
- 12.1 Vendors covered
- Exhibit 113: Vendors covered
- 12.2 Market positioning of vendors
- Exhibit 114: Matrix on vendor position and classification
- 12.3 Applied Materials Inc.
- Exhibit 115: Applied Materials Inc. - Overview
- Exhibit 116: Applied Materials Inc. - Business segments
- Exhibit 117: Applied Materials Inc. - Key offerings
- Exhibit 118: Applied Materials Inc. - Segment focus
- 12.4 Camfil AB
- Exhibit 119: Camfil AB - Overview
- Exhibit 120: Camfil AB - Product / Service
- Exhibit 121: Camfil AB - Key offerings
- 12.5 Canon Inc.
- Exhibit 122: Canon Inc. - Overview
- Exhibit 123: Canon Inc. - Business segments
- Exhibit 124: Canon Inc. - Key offerings
- Exhibit 125: Canon Inc. - Segment focus
- 12.6 Coreflow Ltd.
- Exhibit 126: Coreflow Ltd. - Overview
- Exhibit 127: Coreflow Ltd. - Product / Service
- Exhibit 128: Coreflow Ltd. - Key offerings
- 12.7 Hitachi Ltd.
- Exhibit 129: Hitachi Ltd. - Overview
- Exhibit 130: Hitachi Ltd. - Business segments
- Exhibit 131: Hitachi Ltd. - Key news
- Exhibit 132: Hitachi Ltd. - Key offerings
- Exhibit 133: Hitachi Ltd. - Segment focus
- 12.8 JTEKT Corp.
- Exhibit 134: JTEKT Corp. - Overview
- Exhibit 135: JTEKT Corp. - Business segments
- Exhibit 136: JTEKT Corp. - Key news
- Exhibit 137: JTEKT Corp. - Key offerings
- Exhibit 138: JTEKT Corp. - Segment focus
- 12.9 KLA Corp.
- Exhibit 139: KLA Corp. - Overview
- Exhibit 140: KLA Corp. - Business segments
- Exhibit 141: KLA Corp. - Key offerings
- Exhibit 142: KLA Corp. - Segment focus
- 12.10 Lasertec Corp
- Exhibit 143: Lasertec Corp - Overview
- Exhibit 144: Lasertec Corp - Product / Service
- Exhibit 145: Lasertec Corp - Key offerings
- 12.11 Manz AG
- Exhibit 146: Manz AG - Overview
- Exhibit 147: Manz AG - Business segments
- Exhibit 148: Manz AG - Key news
- Exhibit 149: Manz AG - Key offerings
- Exhibit 150: Manz AG - Segment focus
- 12.12 Nikon Corp.
- Exhibit 151: Nikon Corp. - Overview
- Exhibit 152: Nikon Corp. - Business segments
- Exhibit 153: Nikon Corp. - Key news
- Exhibit 154: Nikon Corp. - Key offerings
- Exhibit 155: Nikon Corp. - Segment focus
- 12.13 Nissin Ion Equipment Co. Ltd.
- Exhibit 156: Nissin Ion Equipment Co. Ltd. - Overview
- Exhibit 157: Nissin Ion Equipment Co. Ltd. - Product / Service
- Exhibit 158: Nissin Ion Equipment Co. Ltd. - Key offerings
- 12.14 Solutions Technologies Pvt Ltd.
- Exhibit 159: Solutions Technologies Pvt Ltd. - Overview
- Exhibit 160: Solutions Technologies Pvt Ltd. - Product / Service
- Exhibit 161: Solutions Technologies Pvt Ltd. - Key offerings
- 12.15 Soonhan Co. Ltd.
- Exhibit 162: Soonhan Co. Ltd. - Overview
- Exhibit 163: Soonhan Co. Ltd. - Product / Service
- Exhibit 164: Soonhan Co. Ltd. - Key offerings
- 12.16 TBS Holdings Inc.
- Exhibit 165: TBS Holdings Inc. - Overview
- Exhibit 166: TBS Holdings Inc. - Business segments
- Exhibit 167: TBS Holdings Inc. - Key offerings
- Exhibit 168: TBS Holdings Inc. - Segment focus
- 12.17 ULVAC Inc.
- Exhibit 169: ULVAC Inc. - Overview
- Exhibit 170: ULVAC Inc. - Business segments
- Exhibit 171: ULVAC Inc. - Key news
- Exhibit 172: ULVAC Inc. - Key offerings
- Exhibit 173: ULVAC Inc. - Segment focus
13 Appendix
- 13.1 Scope of the report
- 13.2 Inclusions and exclusions checklist
- Exhibit 174: Inclusions checklist
- Exhibit 175: Exclusions checklist
- 13.3 Currency conversion rates for US$
- Exhibit 176: Currency conversion rates for US$
- 13.4 Research methodology
- Exhibit 177: Research methodology
- Exhibit 178: Validation techniques employed for market sizing
- Exhibit 179: Information sources
- 13.5 List of abbreviations
- Exhibit 180: List of abbreviations
Research Framework
Technavio presents a detailed picture of the market by way of study, synthesis, and summation of data from multiple sources. The analysts have presented the various facets of the market with a particular focus on identifying the key industry influencers. The data thus presented is comprehensive, reliable, and the result of extensive research, both primary and secondary.
INFORMATION SOURCES
Primary sources
- Manufacturers and suppliers
- Channel partners
- Industry experts
- Strategic decision makers
Secondary sources
- Industry journals and periodicals
- Government data
- Financial reports of key industry players
- Historical data
- Press releases
DATA ANALYSIS
Data Synthesis
- Collation of data
- Estimation of key figures
- Analysis of derived insights
Data Validation
- Triangulation with data models
- Reference against proprietary databases
- Corroboration with industry experts
REPORT WRITING
Qualitative
- Market drivers
- Market challenges
- Market trends
- Five forces analysis
Quantitative
- Market size and forecast
- Market segmentation
- Geographical insights
- Competitive landscape
PURCHASE FULL REPORT OF
flat panel display equipment market market
Key Questions Answered
- What are the key global market and the regional market share?
- What are the revenue-generating key market segments?
- What are the key factors driving and challenging this market’s growth?
- Who are the key market vendors and their growth strategies?
- What are the latest trends influencing the growth of this market?
- What are the variables influencing the market growth in the primary regions?
- What are the factors influencing the growth of the parent market?
Why should you prefer Technavio's market insights report?
- Off-the-shelf research reports
- Reports can be tailored to meet the customer's needs
- Trusted by more than 100 fortune 500 organizations
- Information about the market's key drivers, trends, and challenges
- Parent market analysis
- Every week, 50,000 people visit our subscription platform
- Detailed vendors report with competitive landscape
- Covid-19 impact and recovery analysis
- Data on revenue-generating market segments
- Details on the market shares of various regions
- Five-force market analysis