Load Monitoring Systems Market Analysis Europe, North America, APAC, South America, Middle East and Africa - US, Canada, China, Germany, UK - Size and Forecast 2023-2027
| Published: Oct 2023 | Pages: 166 | SKU: IRTNTR40221 |
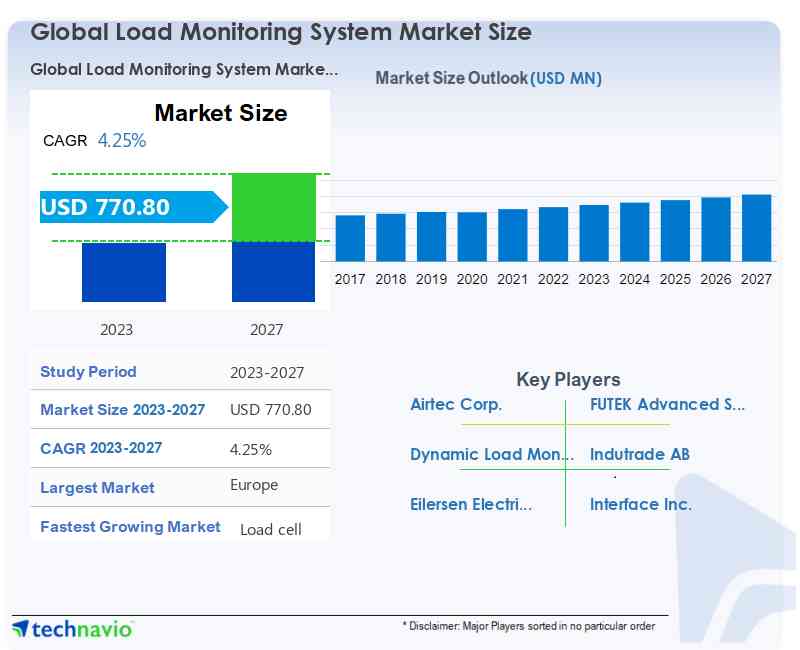
Load Monitoring System Market Forecast 2023-2027
The Load Monitoring System Market size is estimated to grow by USD 770.8 million accelerating at a CAGR of 4.25% between 2023 and 2027. The report also includes an in-depth analysis of drivers, trends, and challenges. Furthermore, the report includes historic market data from 2017 to 2021.
Market Growth Factors:
- Increasing use of load monitoring systems in healthcare sector
- Growing demand for wireless load monitoring systems
- Emergence of custom load monitoring systems
Load Monitoring System Market Share
To learn more about this report, Request Free Sample
Market: Key Drivers, Trends and Challenges
Our researchers analyzed the data with 2022 as the base year, along with the key drivers, trends, and challenges. A holistic analysis of drivers will help companies refine their marketing strategies to gain a competitive advantage.
Key Market Driver
Growing demand for wireless load monitoring systems is a key factor driving the market growth. Load monitoring systems, crucial in challenging industries like oil and gas, often rely on outdated strain gauge technology, causing accuracy issues due to signal fluctuations with changing loads. Wireless load monitoring systems, calibrated with NIST traceable standards, offer durability and non-intrusive operation, achieving approximately 0.52% accuracy.
Vendors like Airtec and Mantracourt Electronics provide solutions like Airtec's 89AXM system and Mantracourt's BroadWeigh Crosby load cell shackle, offering real-time wireless monitoring, easy installation, and high precision. The growing demand for remote load monitoring systems is expected to drive substantial growth in the global load monitoring systems market.
Major Market Trends
The growing number of product launches is a key trend shaping the market. The mature state of the load monitoring systems market has intensified competition among vendors, prompting them to compete on price, product quality, efficiency, supply chain, and product variety. Both global and regional vendors are engaged in product launches to maintain and expand their market shares. An example is Mettler-Toledo International Inc., which introduced the Flash Cell load monitoring system for packaging and pharmaceutical applications in June 2021. Such product launches play a significant role in driving market growth.
The market witnesses a substantial number of product launches, driven by vendor competition and the expansion of end-user industries, particularly automotive and cargo sectors. Vendors use new product launches to tap into unexplored consumer segments, a trend expected to persist as the global load monitoring systems market matures. Consequently, the market is projected to experience growth due to the increasing frequency of product launches during the forecast period.
Significant Market Challenge
Issues associated with the failure of load monitoring systems is a key challenge causing hindrance in the market. As load monitoring systems advance in complexity across industries, pinpointing potential causes of failure becomes crucial for technicians and engineers. Identifying these causes can be intricate, given the array of issues that may contribute. Common issues include corrosion, misalignment, dust, hardened grease, and damaged parts, as well as external factors, defective components, and issues with current sensors.
Additional factors leading to failure include power quality problems, variable frequency drive issues, and mechanical faults. Failures can undermine user trust in these systems, impacting market growth. Consequently, challenges related to load monitoring system failures may hinder the global market's growth in the forecast period.
Market Product, Technology, and Geography
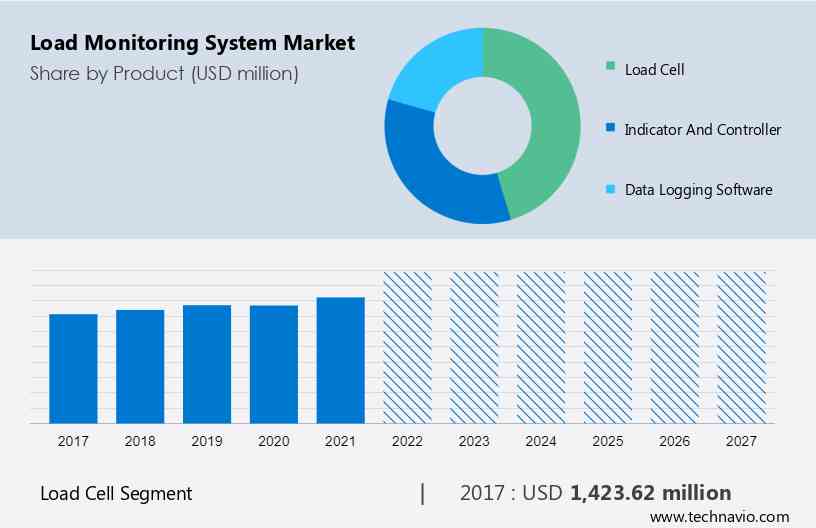
Product Segment Analysis:
The load cell segment will account for a major share of the market's growth during the forecast period.?Load cells are used in industrial environments for applications such as weighing vehicles, tanks, silos, ships, quality control systems, conveyors, fatigue testing systems, test systems, and other performance monitoring of the crane. Some common types of load cells are pneumatic, strain gauges, and hydraulics. In addition to these load cells, piezoelectric load cells and magnetostrictive sensors are some of the other types of load cells used in load monitoring systems.
Get a glance at the market contribution of various segments View the PDF Sample
The load cell segment was valued at USD 1,423.62 million in 2017 and continued to grow until 2021. The load cell market is expanding due to the growing demand for high-accuracy measurement methods to ensure product quality and production productivity. Furthermore, increased investment in industrial automation technology and raised use of load cells in automotive assembly lines, construction, logistics, metals, and mining will promote the adoption of load cells during the forecast period.
Technology Analysis
Based on technology, the analog segment holds the largest market share. Analog technology is easy to implement, requires low cost and is highly demanded by various industries, such as food and beverages, agriculture, mining, and automotive industries. The increasing demand from all those industries boosts the growth of the analog load monitoring technology segment.
Regional Analysis
For more insights on the market share of various regions Download PDF Sample now!
Europe is estimated to contribute 34% to the growth of the global market during the forecast period. Technavio’s analysts have elaborately explained the regional trends and drivers that shape the market during the forecast period.
Germany, the UK, France, and Italy are key players in Europe's load monitoring systems market, driven by thriving automotive and cargo industries. These systems, crucial for optimizing freight loading, align with EU Directive 2015/719, enforcing vehicle weight standards to avoid penalties and cargo issues. The rising preference for SUVs and crossovers among European consumers prompts automakers like Kia to introduce new models, boosting demand. Investments in vehicle production, including electric vehicles like Ford's billion-dollar plant in Germany, fuel the need for load monitoring systems.
Moreover, Europe's flourishing food and beverage sector, fueled by increased income levels and organic product demand, contributes to the market. Load monitoring systems are pivotal in packaging machinery, supporting dynamic weighing, distribution, and production of organic foods and beverages. This growth trend is set to persist during the forecast period.
Major Load Monitoring System Market Companies
Companies are implementing various strategies, such as strategic alliances, partnerships, mergers and acquisitions, geographical expansion, and product/service launches, to enhance their presence in the market.
Interface Inc.- The company offers load monitoring system products such as compression load cells, planar beam load cells, and SLB beam load cells, through its subsidiary Flintec Sales Pvt Ltd.
The research report also includes detailed analyses of the competitive landscape of the market and information about 15 market companies, including:
Airtec Corp., Dynamic Load Monitoring UK Ltd., Eilersen Electric Digital Systems AS, FUTEK Advanced Sensor Technology Inc., Indutrade AB, Interface Inc., James Fisher and Sons Plc, JCM Load Monitoring Ltd., Load Monitoring Systems, Mantracourt Electronics Ltd., Mettler Toledo International Inc., Spectris Plc, Standard Loadcells, Strainsert Co., Thames Side Sensors Ltd., The Crosby Group LLC, Vishay Precision Group Inc., WIKA Alexander Wiegand SE and Co. KG, Euroload, and Precia SA
Qualitative and quantitative analysis of companies has been conducted to help clients understand the wider business environment as well as the strengths and weaknesses of key market players. Data is qualitatively analyzed to categorize companies as pure play, category-focused, industry-focused, and diversified; it is quantitatively analyzed to categorize companies as dominant, leading, strong, tentative, and weak.
Segment Overview
The market report forecasts market growth by revenue at global, regional & country levels and provides an analysis of the market growth and trends opportunities from 2017 to 2027.
- Product Outlook (USD Million, 2017 - 2027)
- Load cell
- Indicator and controller
- Data logging software
- Technology Outlook (USD Million, 2017 - 2027)
- Analog
- Digital
- Region Outlook (USD Million, 2017 - 2027)
- North America
- The U.S.
- Canada
- Europe
- U.K.
- Germany
- France
- Rest of Europe
- APAC
- China
- India
- South America
- Chile
- Brazil
- Argentina
- Middle East & Africa
- Saudi Arabia
- South Africa
- Rest of the Middle East & Africa
- North America
Market Analyst Overview
The market is witnessing significant growth, especially in industries like food & beverages, where precise measurement and control are crucial. Technological innovations, including digital load cells and load indicators and controllers, are driving this growth, enabling more accurate monitoring and management of loads.
In the healthcare sector, the trend towards digitization is driving the adoption of load monitoring systems for preventive medical equipment, ensuring compliance with quality and safety standards. These systems are also increasingly used in packaging, filling, sorting machines, and check weighers, where they play a critical role in maintaining efficiency and product quality.
Despite the volatility in demand, the market is expected to continue its growth trajectory, driven by the increasing need for precise load measurement and control across various industries.
|
Load Monitoring System Market Scope |
|
|
Report Attributes |
Details |
|
Regional analysis |
Europe, North America, APAC, South America, and Middle East and Africa |
|
Performing market contribution |
Europe at 34% |
|
Key countries |
US, Canada, China, Germany, and UK |
|
Competitive landscape |
Leading Companies, Market Positioning of Companies, Competitive Strategies, and Industry Risks |
|
Key companies profiled |
Airtec Corp., Dynamic Load Monitoring UK Ltd., Eilersen Electric Digital Systems AS, FUTEK Advanced Sensor Technology Inc., Indutrade AB, Interface Inc., James Fisher and Sons Plc, JCM Load Monitoring Ltd., Load Monitoring Systems, Mantracourt Electronics Ltd., Mettler Toledo International Inc., Spectris Plc, Standard Loadcells, Strainsert Co., Thames Side Sensors Ltd., The Crosby Group LLC, Vishay Precision Group Inc., WIKA Alexander Wiegand SE and Co. KG, Euroload, and Precia SA |
|
Market dynamics |
Parent market analysis, Market Forecasting, Market growth inducers and obstacles, Fast-growing and slow-growing segment analysis, COVID-19 impact and recovery analysis and future consumer dynamics, Market condition analysis for the market forecast period |
|
Customization purview |
If our report has not included the data that you are looking for, you can reach out to our analysts and get segments customized. |
What are the Key Data Covered in this Market Research Report?
- CAGR of the market during the forecast period
- Detailed information on factors that will drive the market growth and forecasting of the market between 2023 and 2027
- Precise estimation of the size of the market size and its contribution to the parent market
- Accurate predictions about upcoming market trends and analysis and changes in consumer behavior
- Growth of the market industry across Europe, North America, APAC, South America, and Middle East and Africa
- Thorough market growth analysis of the market’s competitive landscape and detailed information about vendors
- Comprehensive market analysis and report on the factors that will challenge the market research and growth of market vendors
We can help! Our analysts can customize this market research report to meet your requirements.
1 Executive Summary
- 1.1 Market overview
- Exhibit 01: Executive Summary – Chart on Market Overview
- Exhibit 02: Executive Summary – Data Table on Market Overview
- Exhibit 03: Executive Summary – Chart on Global Market Characteristics
- Exhibit 04: Executive Summary – Chart on Market by Geography
- Exhibit 05: Executive Summary – Chart on Market Segmentation by Product
- Exhibit 06: Executive Summary – Chart on Market Segmentation by Technology
- Exhibit 07: Executive Summary – Chart on Incremental Growth
- Exhibit 08: Executive Summary – Data Table on Incremental Growth
- Exhibit 09: Executive Summary – Chart on Vendor Market Positioning
2 Market Landscape
- 2.1 Market ecosystem
- Exhibit 10: Parent market
- Exhibit 11: Market Characteristics
3 Market Sizing
- 3.1 Market definition
- Exhibit 12: Offerings of vendors included in the market definition
- 3.2 Market segment analysis
- Exhibit 13: Market segments
- 3.3 Market size 2022
- 3.4 Market outlook: Forecast for 2022-2027
- Exhibit 14: Chart on Global - Market size and forecast 2022-2027 ($ million)
- Exhibit 15: Data Table on Global - Market size and forecast 2022-2027 ($ million)
- Exhibit 16: Chart on Global Market: Year-over-year growth 2022-2027 (%)
- Exhibit 17: Data Table on Global Market: Year-over-year growth 2022-2027 (%)
4 Historic Market Size
- 4.1 Global load monitoring system market 2017 - 2021
- Exhibit 18: Historic Market Size – Data Table on global load monitoring system market 2017 - 2021 ($ million)
- 4.2 Product Segment Analysis 2017 - 2021
- Exhibit 19: Historic Market Size – Product Segment 2017 - 2021 ($ million)
- 4.3 Technology Segment Analysis 2017 - 2021
- Exhibit 20: Historic Market Size – Technology Segment 2017 - 2021 ($ million)
- 4.4 Geography Segment Analysis 2017 - 2021
- Exhibit 21: Historic Market Size – Geography Segment 2017 - 2021 ($ million)
- 4.5 Country Segment Analysis 2017 - 2021
- Exhibit 22: Historic Market Size – Country Segment 2017 - 2021 ($ million)
5 Five Forces Analysis
- 5.1 Five forces summary
- Exhibit 23: Five forces analysis - Comparison between 2022 and 2027
- 5.2 Bargaining power of buyers
- Exhibit 24: Chart on Bargaining power of buyers – Impact of key factors 2022 and 2027
- 5.3 Bargaining power of suppliers
- Exhibit 25: Bargaining power of suppliers – Impact of key factors in 2022 and 2027
- 5.4 Threat of new entrants
- Exhibit 26: Threat of new entrants – Impact of key factors in 2022 and 2027
- 5.5 Threat of substitutes
- Exhibit 27: Threat of substitutes – Impact of key factors in 2022 and 2027
- 5.6 Threat of rivalry
- Exhibit 28: Threat of rivalry – Impact of key factors in 2022 and 2027
- 5.7 Market condition
- Exhibit 29: Chart on Market condition - Five forces 2022 and 2027
6 Market Segmentation by Product
- 6.1 Market segments
- Exhibit 30: Chart on Product - Market share 2022-2027 (%)
- Exhibit 31: Data Table on Product - Market share 2022-2027 (%)
- 6.2 Comparison by Product
- Exhibit 32: Chart on Comparison by Product
- Exhibit 33: Data Table on Comparison by Product
- 6.3 Load cell - Market size and forecast 2022-2027
- Exhibit 34: Chart on Load cell - Market size and forecast 2022-2027 ($ million)
- Exhibit 35: Data Table on Load cell - Market size and forecast 2022-2027 ($ million)
- Exhibit 36: Chart on Load cell - Year-over-year growth 2022-2027 (%)
- Exhibit 37: Data Table on Load cell - Year-over-year growth 2022-2027 (%)
- 6.4 Indicator and controller - Market size and forecast 2022-2027
- Exhibit 38: Chart on Indicator and controller - Market size and forecast 2022-2027 ($ million)
- Exhibit 39: Data Table on Indicator and controller - Market size and forecast 2022-2027 ($ million)
- Exhibit 40: Chart on Indicator and controller - Year-over-year growth 2022-2027 (%)
- Exhibit 41: Data Table on Indicator and controller - Year-over-year growth 2022-2027 (%)
- 6.5 Data logging software - Market size and forecast 2022-2027
- Exhibit 42: Chart on Data logging software - Market size and forecast 2022-2027 ($ million)
- Exhibit 43: Data Table on Data logging software - Market size and forecast 2022-2027 ($ million)
- Exhibit 44: Chart on Data logging software - Year-over-year growth 2022-2027 (%)
- Exhibit 45: Data Table on Data logging software - Year-over-year growth 2022-2027 (%)
- 6.6 Market opportunity by Product
- Exhibit 46: Market opportunity by Product ($ million)
- Exhibit 47: Data Table on Market opportunity by Product ($ million)
7 Market Segmentation by Technology
- 7.1 Market segments
- Exhibit 48: Chart on Technology - Market share 2022-2027 (%)
- Exhibit 49: Data Table on Technology - Market share 2022-2027 (%)
- 7.2 Comparison by Technology
- Exhibit 50: Chart on Comparison by Technology
- Exhibit 51: Data Table on Comparison by Technology
- 7.3 Analog - Market size and forecast 2022-2027
- Exhibit 52: Chart on Analog - Market size and forecast 2022-2027 ($ million)
- Exhibit 53: Data Table on Analog - Market size and forecast 2022-2027 ($ million)
- Exhibit 54: Chart on Analog - Year-over-year growth 2022-2027 (%)
- Exhibit 55: Data Table on Analog - Year-over-year growth 2022-2027 (%)
- 7.4 Digital - Market size and forecast 2022-2027
- Exhibit 56: Chart on Digital - Market size and forecast 2022-2027 ($ million)
- Exhibit 57: Data Table on Digital - Market size and forecast 2022-2027 ($ million)
- Exhibit 58: Chart on Digital - Year-over-year growth 2022-2027 (%)
- Exhibit 59: Data Table on Digital - Year-over-year growth 2022-2027 (%)
- 7.5 Market opportunity by Technology
- Exhibit 60: Market opportunity by Technology ($ million)
- Exhibit 61: Data Table on Market opportunity by Technology ($ million)
8 Customer Landscape
- 8.1 Customer landscape overview
- Exhibit 62: Analysis of price sensitivity, lifecycle, customer purchase basket, adoption rates, and purchase criteria
9 Geographic Landscape
- 9.1 Geographic segmentation
- Exhibit 63: Chart on Market share by geography 2022-2027 (%)
- Exhibit 64: Data Table on Market share by geography 2022-2027 (%)
- 9.2 Geographic comparison
- Exhibit 65: Chart on Geographic comparison
- Exhibit 66: Data Table on Geographic comparison
- 9.3 Europe - Market size and forecast 2022-2027
- Exhibit 67: Chart on Europe - Market size and forecast 2022-2027 ($ million)
- Exhibit 68: Data Table on Europe - Market size and forecast 2022-2027 ($ million)
- Exhibit 69: Chart on Europe - Year-over-year growth 2022-2027 (%)
- Exhibit 70: Data Table on Europe - Year-over-year growth 2022-2027 (%)
- 9.4 North America - Market size and forecast 2022-2027
- Exhibit 71: Chart on North America - Market size and forecast 2022-2027 ($ million)
- Exhibit 72: Data Table on North America - Market size and forecast 2022-2027 ($ million)
- Exhibit 73: Chart on North America - Year-over-year growth 2022-2027 (%)
- Exhibit 74: Data Table on North America - Year-over-year growth 2022-2027 (%)
- 9.5 APAC - Market size and forecast 2022-2027
- Exhibit 75: Chart on APAC - Market size and forecast 2022-2027 ($ million)
- Exhibit 76: Data Table on APAC - Market size and forecast 2022-2027 ($ million)
- Exhibit 77: Chart on APAC - Year-over-year growth 2022-2027 (%)
- Exhibit 78: Data Table on APAC - Year-over-year growth 2022-2027 (%)
- 9.6 South America - Market size and forecast 2022-2027
- Exhibit 79: Chart on South America - Market size and forecast 2022-2027 ($ million)
- Exhibit 80: Data Table on South America - Market size and forecast 2022-2027 ($ million)
- Exhibit 81: Chart on South America - Year-over-year growth 2022-2027 (%)
- Exhibit 82: Data Table on South America - Year-over-year growth 2022-2027 (%)
- 9.7 Middle East and Africa - Market size and forecast 2022-2027
- Exhibit 83: Chart on Middle East and Africa - Market size and forecast 2022-2027 ($ million)
- Exhibit 84: Data Table on Middle East and Africa - Market size and forecast 2022-2027 ($ million)
- Exhibit 85: Chart on Middle East and Africa - Year-over-year growth 2022-2027 (%)
- Exhibit 86: Data Table on Middle East and Africa - Year-over-year growth 2022-2027 (%)
- 9.8 US - Market size and forecast 2022-2027
- Exhibit 87: Chart on US - Market size and forecast 2022-2027 ($ million)
- Exhibit 88: Data Table on US - Market size and forecast 2022-2027 ($ million)
- Exhibit 89: Chart on US - Year-over-year growth 2022-2027 (%)
- Exhibit 90: Data Table on US - Year-over-year growth 2022-2027 (%)
- 9.9 China - Market size and forecast 2022-2027
- Exhibit 91: Chart on China - Market size and forecast 2022-2027 ($ million)
- Exhibit 92: Data Table on China - Market size and forecast 2022-2027 ($ million)
- Exhibit 93: Chart on China - Year-over-year growth 2022-2027 (%)
- Exhibit 94: Data Table on China - Year-over-year growth 2022-2027 (%)
- 9.10 Germany - Market size and forecast 2022-2027
- Exhibit 95: Chart on Germany - Market size and forecast 2022-2027 ($ million)
- Exhibit 96: Data Table on Germany - Market size and forecast 2022-2027 ($ million)
- Exhibit 97: Chart on Germany - Year-over-year growth 2022-2027 (%)
- Exhibit 98: Data Table on Germany - Year-over-year growth 2022-2027 (%)
- 9.11 UK - Market size and forecast 2022-2027
- Exhibit 99: Chart on UK - Market size and forecast 2022-2027 ($ million)
- Exhibit 100: Data Table on UK - Market size and forecast 2022-2027 ($ million)
- Exhibit 101: Chart on UK - Year-over-year growth 2022-2027 (%)
- Exhibit 102: Data Table on UK - Year-over-year growth 2022-2027 (%)
- 9.12 Canada - Market size and forecast 2022-2027
- Exhibit 103: Chart on Canada - Market size and forecast 2022-2027 ($ million)
- Exhibit 104: Data Table on Canada - Market size and forecast 2022-2027 ($ million)
- Exhibit 105: Chart on Canada - Year-over-year growth 2022-2027 (%)
- Exhibit 106: Data Table on Canada - Year-over-year growth 2022-2027 (%)
- 9.13 Market opportunity by geography
- Exhibit 107: Market opportunity by geography ($ million)
- Exhibit 108: Data Tables on Market opportunity by geography ($ million)
10 Drivers, Challenges, and Trends
- 10.1 Market drivers
- 10.2 Market challenges
- 10.3 Impact of drivers and challenges
- Exhibit 109: Impact of drivers and challenges in 2022 and 2027
- 10.4 Market trends
11 Vendor Landscape
- 11.1 Overview
- 11.2 Vendor landscape
- Exhibit 110: Overview on Criticality of inputs and Factors of differentiation
- 11.3 Landscape disruption
- Exhibit 111: Overview on factors of disruption
- 11.4 Industry risks
- Exhibit 112: Impact of key risks on business
12 Vendor Analysis
- 12.1 Vendors covered
- Exhibit 113: Vendors covered
- 12.2 Market positioning of vendors
- Exhibit 114: Matrix on vendor position and classification
- 12.3 Airtec Corp.
- Exhibit 115: Airtec Corp. - Overview
- Exhibit 116: Airtec Corp. - Product / Service
- Exhibit 117: Airtec Corp. - Key offerings
- 12.4 Dynamic Load Monitoring UK Ltd.
- Exhibit 118: Dynamic Load Monitoring UK Ltd. - Overview
- Exhibit 119: Dynamic Load Monitoring UK Ltd. - Product / Service
- Exhibit 120: Dynamic Load Monitoring UK Ltd. - Key offerings
- 12.5 Eilersen Electric Digital Systems AS
- Exhibit 121: Eilersen Electric Digital Systems AS - Overview
- Exhibit 122: Eilersen Electric Digital Systems AS - Product / Service
- Exhibit 123: Eilersen Electric Digital Systems AS - Key offerings
- 12.6 Euroload
- Exhibit 124: Euroload - Overview
- Exhibit 125: Euroload - Product / Service
- Exhibit 126: Euroload - Key offerings
- 12.7 FUTEK Advanced Sensor Technology Inc.
- Exhibit 127: FUTEK Advanced Sensor Technology Inc. - Overview
- Exhibit 128: FUTEK Advanced Sensor Technology Inc. - Product / Service
- Exhibit 129: FUTEK Advanced Sensor Technology Inc. - Key offerings
- 12.8 Indutrade AB
- Exhibit 130: Indutrade AB - Overview
- Exhibit 131: Indutrade AB - Business segments
- Exhibit 132: Indutrade AB - Key offerings
- Exhibit 133: Indutrade AB - Segment focus
- 12.9 Interface Inc.
- Exhibit 134: Interface Inc. - Overview
- Exhibit 135: Interface Inc. - Product / Service
- Exhibit 136: Interface Inc. - Key offerings
- 12.10 James Fisher and Sons Plc
- Exhibit 137: James Fisher and Sons Plc - Overview
- Exhibit 138: James Fisher and Sons Plc - Business segments
- Exhibit 139: James Fisher and Sons Plc - Key offerings
- Exhibit 140: James Fisher and Sons Plc - Segment focus
- 12.11 JCM Load Monitoring Ltd.
- Exhibit 141: JCM Load Monitoring Ltd. - Overview
- Exhibit 142: JCM Load Monitoring Ltd. - Product / Service
- Exhibit 143: JCM Load Monitoring Ltd. - Key offerings
- 12.12 Load Monitoring Systems
- Exhibit 144: Load Monitoring Systems - Overview
- Exhibit 145: Load Monitoring Systems - Product / Service
- Exhibit 146: Load Monitoring Systems - Key offerings
- 12.13 Mettler Toledo International Inc.
- Exhibit 147: Mettler Toledo International Inc. - Overview
- Exhibit 148: Mettler Toledo International Inc. - Business segments
- Exhibit 149: Mettler Toledo International Inc. - Key offerings
- Exhibit 150: Mettler Toledo International Inc. - Segment focus
- 12.14 Precia SA
- Exhibit 151: Precia SA - Overview
- Exhibit 152: Precia SA - Product / Service
- Exhibit 153: Precia SA - Key offerings
- 12.15 Spectris Plc
- Exhibit 154: Spectris Plc - Overview
- Exhibit 155: Spectris Plc - Business segments
- Exhibit 156: Spectris Plc - Key offerings
- Exhibit 157: Spectris Plc - Segment focus
- 12.16 Vishay Precision Group Inc.
- Exhibit 158: Vishay Precision Group Inc. - Overview
- Exhibit 159: Vishay Precision Group Inc. - Business segments
- Exhibit 160: Vishay Precision Group Inc. - Key offerings
- Exhibit 161: Vishay Precision Group Inc. - Segment focus
- 12.17 WIKA Alexander Wiegand SE and Co. KG
- Exhibit 162: WIKA Alexander Wiegand SE and Co. KG - Overview
- Exhibit 163: WIKA Alexander Wiegand SE and Co. KG - Product / Service
- Exhibit 164: WIKA Alexander Wiegand SE and Co. KG - Key offerings
13 Appendix
- 13.1 Scope of the report
- 13.2 Inclusions and exclusions checklist
- Exhibit 165: Inclusions checklist
- Exhibit 166: Exclusions checklist
- 13.3 Currency conversion rates for US$
- Exhibit 167: Currency conversion rates for US$
- 13.4 Research methodology
- Exhibit 168: Research methodology
- Exhibit 169: Validation techniques employed for market sizing
- Exhibit 170: Information sources
- 13.5 List of abbreviations
- Exhibit 171: List of abbreviations
Research Framework
Technavio presents a detailed picture of the market by way of study, synthesis, and summation of data from multiple sources. The analysts have presented the various facets of the market with a particular focus on identifying the key industry influencers. The data thus presented is comprehensive, reliable, and the result of extensive research, both primary and secondary.
INFORMATION SOURCES
Primary sources
- Manufacturers and suppliers
- Channel partners
- Industry experts
- Strategic decision makers
Secondary sources
- Industry journals and periodicals
- Government data
- Financial reports of key industry players
- Historical data
- Press releases
DATA ANALYSIS
Data Synthesis
- Collation of data
- Estimation of key figures
- Analysis of derived insights
Data Validation
- Triangulation with data models
- Reference against proprietary databases
- Corroboration with industry experts
REPORT WRITING
Qualitative
- Market drivers
- Market challenges
- Market trends
- Five forces analysis
Quantitative
- Market size and forecast
- Market segmentation
- Geographical insights
- Competitive landscape
PURCHASE FULL REPORT OF
load monitoring system market market
Key Questions Answered
- What are the key global market and the regional market share?
- What are the revenue-generating key market segments?
- What are the key factors driving and challenging this market’s growth?
- Who are the key market vendors and their growth strategies?
- What are the latest trends influencing the growth of this market?
- What are the variables influencing the market growth in the primary regions?
- What are the factors influencing the growth of the parent market?
Why should you prefer Technavio's market insights report?
- Off-the-shelf research reports
- Reports can be tailored to meet the customer's needs
- Trusted by more than 100 fortune 500 organizations
- Information about the market's key drivers, trends, and challenges
- Parent market analysis
- Every week, 50,000 people visit our subscription platform
- Detailed vendors report with competitive landscape
- Covid-19 impact and recovery analysis
- Data on revenue-generating market segments
- Details on the market shares of various regions
- Five-force market analysis