Marketing Consulting Market Size & Share Analysis - Growth Trends & Forecast 2023-2027
| Published: Oct 2023 | Pages: 170 | SKU: IRTNTR71542 |
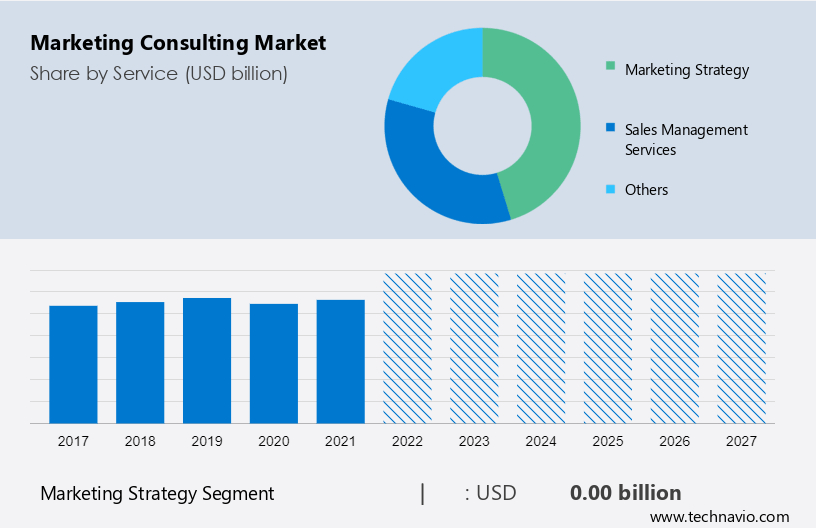
The marketing consulting market size is forecast to increase by USD 41.56 billion. The Report covers the Marketing Consulting industry forecast and is segmented into Service (marketing strategy market development and implementation consulting services, sales management and development consulting services, and others), Application (automotive, chemicals, machine industry) and geography North America, Europe, APAC, Middle East and Africa, and South America. The report market size, historical data (2017 - 2021) and forecast for marketing consulting on the basis of value (USD Billion) for all above segments.
Marketing Consulting Market Market Size
To learn more about this report, Download Report Sample
Marketing Consulting Market Analysis
The market size for marketing consulting market is projected to experience a CAGR 4.93% with a year-over-year (YoY) growth of 4.35% from 2022 to 2023.
The increasing demand for marketing consulting services can be attributed to the rising need for enhanced digital customer experiences.
With intensifying market competition, marketing consulting firms are compelled to meet evolving client demands at competitive rates. This has driven organizations to enhance marketing campaigns and information delivery to target audiences, focusing on improved efficiency. Marketing automation software plays a vital role, analyzing company-wide marketing data and offering statistical insights to guide investment decisions.
Recognizing the significance of customer-centric online marketing, consulting firms are making substantial investments in marketing automation software. Effective management of the digital customer experience is now a fundamental requirement for customer retention and acquisition. In an era where customers research and stay updated on technology through online content, providing a sophisticated digital experience has become imperative. This shift is expected to propel growth in the global marketing consulting market throughout the forecast period.
Marketing Consulting Market Trends
The changing selection process of consulting firms is an upcoming trend in the market.
- Marketing consulting firms have adapted their consultant selection process to align with changing customer behavior.
- Customers now use online services to research and identify the most suitable advisors.
- Internet databases offer speed and cost-efficiency, impacting large consulting firms.
- Established businesses with reputations may opt for smaller firms with specialized expertise.
- Some companies are forming internal teams of former consultants, reducing the reliance on external advisors.
- These trends are expected to drive substantial growth in the global marketing consulting market.
North America is Dominating the Market
North America is estimated to contribute 36% to the growth by 2027.
The development of new research companies and the availability of various databases and business analytics tools, this region is a major contributor to the global marketing consulting market. This allows businesses to collect meaningful, useful data at a fraction of the cost that marketing consultants pay.
Additionally, the ease of scaling virtualization and automating administrative tasks dynamically will increase SaaS adoption. Due to digitalization, various businesses and organizations in this region are adopting SaaS solutions, which help improve a range of operations such as business planning, order fulfilment, and customer service. Hence, such factors are expected to drive market growth in this region during the forecast period.
Such factors are expected to increase the demand for quartz during the forecast period.
Marketing Consulting Market - Growth Rate by Region 2017-2027
To understand geographic trends Download Report Sample
Marketing Consulting Industry Segmentation
For more details on other segments Download Sample Report
Marketing Consulting Market Companies Overview
The Marketing Consulting market is fragmented in nature. Some significant players include Bain, Accenture and Alvarezandmarsal.combain.
The research report also includes detailed analyses of the competitive landscape of the market and information about 15 market companies, including:
Alvarez and Marsal Holdings LLC, Bain and Co. Inc., BearingPoint Holding BV, Boston Consulting Group Inc., Cedar Management Consulting International LLC, Deloitte Touche Tohmatsu Ltd., Elixirr International plc, Ernst and Young Global Ltd., INNOPAY B.V., KPMG International Ltd., L.E.K. Consulting LLC, McKinsey and Co., Nextcontinent, OC and C Strategy Consultants, PricewaterhouseCoopers LLP, RGA Media Group Inc., The Nielsen Co. US LLC, The North Highland Co., YCP Solidiance, and ZS Associates Inc.
Technavio report provides an in-depth analysis of the market and its players through combined qualitative and quantitative data. The analysis classifies companies into categories based on their business approaches, including pure-play, category-focused, industry-focused, and diversified. Companies are specially categorized into dominant, leading, strong, tentative, and weak, based on their quantitative data analysis.
|
Marketing Consulting Market Scope |
|
|
Report Coverage |
Details |
|
Regional analysis |
North America, Europe, APAC, Middle East and Africa, and South America |
|
Performing market contribution |
North America at 36% |
|
Key countries |
US, Canada, China, Germany, and UK |
|
Competitive landscape |
Leading Companies, Market Positioning of Companies, Competitive Strategies, and Industry Risks |
|
Key companies profiled |
Accenture Plc, Alvarez and Marsal Holdings LLC, Bain and Co. Inc., BearingPoint Holding BV, Boston Consulting Group Inc., Cedar Management Consulting International LLC, Deloitte Touche Tohmatsu Ltd., Elixirr International plc, Ernst and Young Global Ltd., INNOPAY B.V., KPMG International Ltd., L.E.K. Consulting LLC, McKinsey and Co., Nextcontinent, OC and C Strategy Consultants, PricewaterhouseCoopers LLP, RGA Media Group Inc., The Nielsen Co. US LLC, The North Highland Co., YCP Solidiance, and ZS Associates Inc. |
|
Market dynamics |
Parent market analysis, Market growth inducers and obstacles, Fast-growing and slow-growing segment analysis, COVID 19 impact and recovery analysis and future consumer dynamics, Market condition analysis for forecast period |
|
Customization purview |
If our report has not included the data that you are looking for, you can reach out to our analysts and get segments customized. |
What are the Key Data Covered in this Marketing Consulting Market Research Report?
- CAGR of the market during the forecast period
- Detailed information on factors that will drive the growth of the market between 2023 and 2027
- Precise estimation of the size of the market size and its contribution of the market in focus to the parent market
- Accurate predictions about upcoming trends and changes in consumer behaviour
- Growth of the market industry across North America, Europe, APAC, Middle East and Africa, and South America
- Thorough analysis of the market’s competitive landscape and detailed information about companies
- Comprehensive analysis of factors that will challenge the growth of market companies
We can help! Our analysts can customize this market research report to meet your requirements.
1 Executive Summary
- 1.1 Market overview
- Exhibit 01: Executive Summary – Chart on Market Overview
- Exhibit 02: Executive Summary – Data Table on Market Overview
- Exhibit 03: Executive Summary – Chart on Global Market Characteristics
- Exhibit 04: Executive Summary – Chart on Market by Geography
- Exhibit 05: Executive Summary – Chart on Market Segmentation by Service
- Exhibit 06: Executive Summary – Chart on Market Segmentation by Application
- Exhibit 07: Executive Summary – Chart on Incremental Growth
- Exhibit 08: Executive Summary – Data Table on Incremental Growth
- Exhibit 09: Executive Summary – Chart on Vendor Market Positioning
2 Market Landscape
- 2.1 Market ecosystem
- Exhibit 10: Parent market
- Exhibit 11: Market Characteristics
3 Market Sizing
- 3.1 Market definition
- Exhibit 12: Offerings of vendors included in the market definition
- 3.2 Market segment analysis
- Exhibit 13: Market segments
- 3.3 Market size 2022
- 3.4 Market outlook: Forecast for 2022-2027
- Exhibit 14: Chart on Global - Market size and forecast 2022-2027 ($ billion)
- Exhibit 15: Data Table on Global - Market size and forecast 2022-2027 ($ billion)
- Exhibit 16: Chart on Global Market: Year-over-year growth 2022-2027 (%)
- Exhibit 17: Data Table on Global Market: Year-over-year growth 2022-2027 (%)
4 Historic Market Size
- 4.1 Global marketing consulting market 2017 - 2021
- Exhibit 18: Historic Market Size – Data Table on global marketing consulting market 2017 - 2021 ($ billion)
- 4.2 Service Segment Analysis 2017 - 2021
- Exhibit 19: Historic Market Size – Service Segment 2017 - 2021 ($ billion)
- 4.3 Application Segment Analysis 2017 - 2021
- Exhibit 20: Historic Market Size – Application Segment 2017 - 2021 ($ billion)
- 4.4 Geography Segment Analysis 2017 - 2021
- Exhibit 21: Historic Market Size – Geography Segment 2017 - 2021 ($ billion)
- 4.5 Country Segment Analysis 2017 - 2021
- Exhibit 22: Historic Market Size – Country Segment 2017 - 2021 ($ billion)
5 Five Forces Analysis
- 5.1 Five forces summary
- Exhibit 23: Five forces analysis - Comparison between 2022 and 2027
- 5.2 Bargaining power of buyers
- Exhibit 24: Chart on Bargaining power of buyers – Impact of key factors 2022 and 2027
- 5.3 Bargaining power of suppliers
- Exhibit 25: Bargaining power of suppliers – Impact of key factors in 2022 and 2027
- 5.4 Threat of new entrants
- Exhibit 26: Threat of new entrants – Impact of key factors in 2022 and 2027
- 5.5 Threat of substitutes
- Exhibit 27: Threat of substitutes – Impact of key factors in 2022 and 2027
- 5.6 Threat of rivalry
- Exhibit 28: Threat of rivalry – Impact of key factors in 2022 and 2027
- 5.7 Market condition
- Exhibit 29: Chart on Market condition - Five forces 2022 and 2027
6 Market Segmentation by Service
- 6.1 Market segments
- Exhibit 30: Chart on Service - Market share 2022-2027 (%)
- Exhibit 31: Data Table on Service - Market share 2022-2027 (%)
- 6.2 Comparison by Service
- Exhibit 32: Chart on Comparison by Service
- Exhibit 33: Data Table on Comparison by Service
- 6.3 Marketing strategy market development and implementation consulting services - Market size and forecast 2022-2027
- Exhibit 34: Chart on Marketing strategy market development and implementation consulting services - Market size and forecast 2022-2027 ($ billion)
- Exhibit 35: Data Table on Marketing strategy market development and implementation consulting services - Market size and forecast 2022-2027 ($ billion)
- Exhibit 36: Chart on Marketing strategy market development and implementation consulting services - Year-over-year growth 2022-2027 (%)
- Exhibit 37: Data Table on Marketing strategy market development and implementation consulting services - Year-over-year growth 2022-2027 (%)
- 6.4 Sales management and development consulting services - Market size and forecast 2022-2027
- Exhibit 38: Chart on Sales management and development consulting services - Market size and forecast 2022-2027 ($ billion)
- Exhibit 39: Data Table on Sales management and development consulting services - Market size and forecast 2022-2027 ($ billion)
- Exhibit 40: Chart on Sales management and development consulting services - Year-over-year growth 2022-2027 (%)
- Exhibit 41: Data Table on Sales management and development consulting services - Year-over-year growth 2022-2027 (%)
- 6.5 Others - Market size and forecast 2022-2027
- Exhibit 42: Chart on Others - Market size and forecast 2022-2027 ($ billion)
- Exhibit 43: Data Table on Others - Market size and forecast 2022-2027 ($ billion)
- Exhibit 44: Chart on Others - Year-over-year growth 2022-2027 (%)
- Exhibit 45: Data Table on Others - Year-over-year growth 2022-2027 (%)
- 6.6 Market opportunity by Service
- Exhibit 46: Market opportunity by Service ($ billion)
- Exhibit 47: Data Table on Market opportunity by Service ($ billion)
7 Market Segmentation by Application
- 7.1 Market segments
- Exhibit 48: Chart on Application - Market share 2022-2027 (%)
- Exhibit 49: Data Table on Application - Market share 2022-2027 (%)
- 7.2 Comparison by Application
- Exhibit 50: Chart on Comparison by Application
- Exhibit 51: Data Table on Comparison by Application
- 7.3 Automotive - Market size and forecast 2022-2027
- Exhibit 52: Chart on Automotive - Market size and forecast 2022-2027 ($ billion)
- Exhibit 53: Data Table on Automotive - Market size and forecast 2022-2027 ($ billion)
- Exhibit 54: Chart on Automotive - Year-over-year growth 2022-2027 (%)
- Exhibit 55: Data Table on Automotive - Year-over-year growth 2022-2027 (%)
- 7.4 Chemicals - Market size and forecast 2022-2027
- Exhibit 56: Chart on Chemicals - Market size and forecast 2022-2027 ($ billion)
- Exhibit 57: Data Table on Chemicals - Market size and forecast 2022-2027 ($ billion)
- Exhibit 58: Chart on Chemicals - Year-over-year growth 2022-2027 (%)
- Exhibit 59: Data Table on Chemicals - Year-over-year growth 2022-2027 (%)
- 7.5 Machine industry - Market size and forecast 2022-2027
- Exhibit 60: Chart on Machine industry - Market size and forecast 2022-2027 ($ billion)
- Exhibit 61: Data Table on Machine industry - Market size and forecast 2022-2027 ($ billion)
- Exhibit 62: Chart on Machine industry - Year-over-year growth 2022-2027 (%)
- Exhibit 63: Data Table on Machine industry - Year-over-year growth 2022-2027 (%)
- 7.6 Others - Market size and forecast 2022-2027
- Exhibit 64: Chart on Others - Market size and forecast 2022-2027 ($ billion)
- Exhibit 65: Data Table on Others - Market size and forecast 2022-2027 ($ billion)
- Exhibit 66: Chart on Others - Year-over-year growth 2022-2027 (%)
- Exhibit 67: Data Table on Others - Year-over-year growth 2022-2027 (%)
- 7.7 Market opportunity by Application
- Exhibit 68: Market opportunity by Application ($ billion)
- Exhibit 69: Data Table on Market opportunity by Application ($ billion)
8 Customer Landscape
- 8.1 Customer landscape overview
- Exhibit 70: Analysis of price sensitivity, lifecycle, customer purchase basket, adoption rates, and purchase criteria
9 Geographic Landscape
- 9.1 Geographic segmentation
- Exhibit 71: Chart on Market share by geography 2022-2027 (%)
- Exhibit 72: Data Table on Market share by geography 2022-2027 (%)
- 9.2 Geographic comparison
- Exhibit 73: Chart on Geographic comparison
- Exhibit 74: Data Table on Geographic comparison
- 9.3 North America - Market size and forecast 2022-2027
- Exhibit 75: Chart on North America - Market size and forecast 2022-2027 ($ billion)
- Exhibit 76: Data Table on North America - Market size and forecast 2022-2027 ($ billion)
- Exhibit 77: Chart on North America - Year-over-year growth 2022-2027 (%)
- Exhibit 78: Data Table on North America - Year-over-year growth 2022-2027 (%)
- 9.4 Europe - Market size and forecast 2022-2027
- Exhibit 79: Chart on Europe - Market size and forecast 2022-2027 ($ billion)
- Exhibit 80: Data Table on Europe - Market size and forecast 2022-2027 ($ billion)
- Exhibit 81: Chart on Europe - Year-over-year growth 2022-2027 (%)
- Exhibit 82: Data Table on Europe - Year-over-year growth 2022-2027 (%)
- 9.5 APAC - Market size and forecast 2022-2027
- Exhibit 83: Chart on APAC - Market size and forecast 2022-2027 ($ billion)
- Exhibit 84: Data Table on APAC - Market size and forecast 2022-2027 ($ billion)
- Exhibit 85: Chart on APAC - Year-over-year growth 2022-2027 (%)
- Exhibit 86: Data Table on APAC - Year-over-year growth 2022-2027 (%)
- 9.6 Middle East and Africa - Market size and forecast 2022-2027
- Exhibit 87: Chart on Middle East and Africa - Market size and forecast 2022-2027 ($ billion)
- Exhibit 88: Data Table on Middle East and Africa - Market size and forecast 2022-2027 ($ billion)
- Exhibit 89: Chart on Middle East and Africa - Year-over-year growth 2022-2027 (%)
- Exhibit 90: Data Table on Middle East and Africa - Year-over-year growth 2022-2027 (%)
- 9.7 South America - Market size and forecast 2022-2027
- Exhibit 91: Chart on South America - Market size and forecast 2022-2027 ($ billion)
- Exhibit 92: Data Table on South America - Market size and forecast 2022-2027 ($ billion)
- Exhibit 93: Chart on South America - Year-over-year growth 2022-2027 (%)
- Exhibit 94: Data Table on South America - Year-over-year growth 2022-2027 (%)
- 9.8 US - Market size and forecast 2022-2027
- Exhibit 95: Chart on US - Market size and forecast 2022-2027 ($ billion)
- Exhibit 96: Data Table on US - Market size and forecast 2022-2027 ($ billion)
- Exhibit 97: Chart on US - Year-over-year growth 2022-2027 (%)
- Exhibit 98: Data Table on US - Year-over-year growth 2022-2027 (%)
- 9.9 Germany - Market size and forecast 2022-2027
- Exhibit 99: Chart on Germany - Market size and forecast 2022-2027 ($ billion)
- Exhibit 100: Data Table on Germany - Market size and forecast 2022-2027 ($ billion)
- Exhibit 101: Chart on Germany - Year-over-year growth 2022-2027 (%)
- Exhibit 102: Data Table on Germany - Year-over-year growth 2022-2027 (%)
- 9.10 China - Market size and forecast 2022-2027
- Exhibit 103: Chart on China - Market size and forecast 2022-2027 ($ billion)
- Exhibit 104: Data Table on China - Market size and forecast 2022-2027 ($ billion)
- Exhibit 105: Chart on China - Year-over-year growth 2022-2027 (%)
- Exhibit 106: Data Table on China - Year-over-year growth 2022-2027 (%)
- 9.11 Canada - Market size and forecast 2022-2027
- Exhibit 107: Chart on Canada - Market size and forecast 2022-2027 ($ billion)
- Exhibit 108: Data Table on Canada - Market size and forecast 2022-2027 ($ billion)
- Exhibit 109: Chart on Canada - Year-over-year growth 2022-2027 (%)
- Exhibit 110: Data Table on Canada - Year-over-year growth 2022-2027 (%)
- 9.12 UK - Market size and forecast 2022-2027
- Exhibit 111: Chart on UK - Market size and forecast 2022-2027 ($ billion)
- Exhibit 112: Data Table on UK - Market size and forecast 2022-2027 ($ billion)
- Exhibit 113: Chart on UK - Year-over-year growth 2022-2027 (%)
- Exhibit 114: Data Table on UK - Year-over-year growth 2022-2027 (%)
- 9.13 Market opportunity by geography
- Exhibit 115: Market opportunity by geography ($ billion)
- Exhibit 116: Data Tables on Market opportunity by geography ($ billion)
10 Drivers, Challenges, and Trends
- 10.1 Market drivers
- 10.2 Market challenges
- 10.3 Impact of drivers and challenges
- Exhibit 117: Impact of drivers and challenges in 2022 and 2027
- 10.4 Market trends
11 Vendor Landscape
- 11.1 Overview
- 11.2 Vendor landscape
- Exhibit 118: Overview on Criticality of inputs and Factors of differentiation
- 11.3 Landscape disruption
- Exhibit 119: Overview on factors of disruption
- 11.4 Industry risks
- Exhibit 120: Impact of key risks on business
12 Vendor Analysis
- 12.1 Vendors covered
- Exhibit 121: Vendors covered
- 12.2 Market positioning of vendors
- Exhibit 122: Matrix on vendor position and classification
- 12.3 Accenture Plc
- Exhibit 123: Accenture Plc - Overview
- Exhibit 124: Accenture Plc - Business segments
- Exhibit 125: Accenture Plc - Key news
- Exhibit 126: Accenture Plc - Key offerings
- Exhibit 127: Accenture Plc - Segment focus
- 12.4 Alvarez and Marsal Holdings LLC
- Exhibit 128: Alvarez and Marsal Holdings LLC - Overview
- Exhibit 129: Alvarez and Marsal Holdings LLC - Product / Service
- Exhibit 130: Alvarez and Marsal Holdings LLC - Key offerings
- 12.5 Bain and Co. Inc.
- Exhibit 131: Bain and Co. Inc. - Overview
- Exhibit 132: Bain and Co. Inc. - Product / Service
- Exhibit 133: Bain and Co. Inc. - Key offerings
- 12.6 BearingPoint Holding BV
- Exhibit 134: BearingPoint Holding BV - Overview
- Exhibit 135: BearingPoint Holding BV - Product / Service
- Exhibit 136: BearingPoint Holding BV - Key offerings
- 12.7 Boston Consulting Group Inc.
- Exhibit 137: Boston Consulting Group Inc. - Overview
- Exhibit 138: Boston Consulting Group Inc. - Product / Service
- Exhibit 139: Boston Consulting Group Inc. - Key offerings
- 12.8 Cedar Management Consulting International LLC
- Exhibit 140: Cedar Management Consulting International LLC - Overview
- Exhibit 141: Cedar Management Consulting International LLC - Product / Service
- Exhibit 142: Cedar Management Consulting International LLC - Key offerings
- 12.9 Deloitte Touche Tohmatsu Ltd.
- Exhibit 143: Deloitte Touche Tohmatsu Ltd. - Overview
- Exhibit 144: Deloitte Touche Tohmatsu Ltd. - Business segments
- Exhibit 145: Deloitte Touche Tohmatsu Ltd. - Key offerings
- Exhibit 146: Deloitte Touche Tohmatsu Ltd. - Segment focus
- 12.10 Elixirr International plc
- Exhibit 147: Elixirr International plc - Overview
- Exhibit 148: Elixirr International plc - Product / Service
- Exhibit 149: Elixirr International plc - Key offerings
- 12.11 Ernst and Young Global Ltd.
- Exhibit 150: Ernst and Young Global Ltd. - Overview
- Exhibit 151: Ernst and Young Global Ltd. - Product / Service
- Exhibit 152: Ernst and Young Global Ltd. - Key offerings
- 12.12 KPMG International Ltd.
- Exhibit 153: KPMG International Ltd. - Overview
- Exhibit 154: KPMG International Ltd. - Business segments
- Exhibit 155: KPMG International Ltd. - Key news
- Exhibit 156: KPMG International Ltd. - Key offerings
- Exhibit 157: KPMG International Ltd. - Segment focus
- 12.13 McKinsey and Co.
- Exhibit 158: McKinsey and Co. - Overview
- Exhibit 159: McKinsey and Co. - Product / Service
- Exhibit 160: McKinsey and Co. - Key offerings
- 12.14 Nextcontinent
- Exhibit 161: Nextcontinent - Overview
- Exhibit 162: Nextcontinent - Product / Service
- Exhibit 163: Nextcontinent - Key offerings
- 12.15 OC and C Strategy Consultants
- Exhibit 164: OC and C Strategy Consultants - Overview
- Exhibit 165: OC and C Strategy Consultants - Product / Service
- Exhibit 166: OC and C Strategy Consultants - Key offerings
- 12.16 PricewaterhouseCoopers LLP
- Exhibit 167: PricewaterhouseCoopers LLP - Overview
- Exhibit 168: PricewaterhouseCoopers LLP - Product / Service
- Exhibit 169: PricewaterhouseCoopers LLP - Key offerings
- 12.17 The Nielsen Co. US LLC
- Exhibit 170: The Nielsen Co. US LLC - Overview
- Exhibit 171: The Nielsen Co. US LLC - Product / Service
- Exhibit 172: The Nielsen Co. US LLC - Key offerings
13 Appendix
- 13.1 Scope of the report
- 13.2 Inclusions and exclusions checklist
- Exhibit 173: Inclusions checklist
- Exhibit 174: Exclusions checklist
- 13.3 Currency conversion rates for US$
- Exhibit 175: Currency conversion rates for US$
- 13.4 Research methodology
- Exhibit 176: Research methodology
- Exhibit 177: Validation techniques employed for market sizing
- Exhibit 178: Information sources
- 13.5 List of abbreviations
- Exhibit 179: List of abbreviations
Research Framework
Technavio presents a detailed picture of the market by way of study, synthesis, and summation of data from multiple sources. The analysts have presented the various facets of the market with a particular focus on identifying the key industry influencers. The data thus presented is comprehensive, reliable, and the result of extensive research, both primary and secondary.
INFORMATION SOURCES
Primary sources
- Manufacturers and suppliers
- Channel partners
- Industry experts
- Strategic decision makers
Secondary sources
- Industry journals and periodicals
- Government data
- Financial reports of key industry players
- Historical data
- Press releases
DATA ANALYSIS
Data Synthesis
- Collation of data
- Estimation of key figures
- Analysis of derived insights
Data Validation
- Triangulation with data models
- Reference against proprietary databases
- Corroboration with industry experts
REPORT WRITING
Qualitative
- Market drivers
- Market challenges
- Market trends
- Five forces analysis
Quantitative
- Market size and forecast
- Market segmentation
- Geographical insights
- Competitive landscape
PURCHASE FULL REPORT OF
marketing consulting market market
Key Questions Answered
- What are the key global market and the regional market share?
- What are the revenue-generating key market segments?
- What are the key factors driving and challenging this market’s growth?
- Who are the key market vendors and their growth strategies?
- What are the latest trends influencing the growth of this market?
- What are the variables influencing the market growth in the primary regions?
- What are the factors influencing the growth of the parent market?
Why should you prefer Technavio's market insights report?
- Off-the-shelf research reports
- Reports can be tailored to meet the customer's needs
- Trusted by more than 100 fortune 500 organizations
- Information about the market's key drivers, trends, and challenges
- Parent market analysis
- Every week, 50,000 people visit our subscription platform
- Detailed vendors report with competitive landscape
- Covid-19 impact and recovery analysis
- Data on revenue-generating market segments
- Details on the market shares of various regions
- Five-force market analysis