Motorcycle Helmet Heads-up Display Market Analysis Europe, North America, APAC, South America, Middle East and Africa - US, China, France, Germany, UK - Size and Forecast 2023-2027
| Published: Oct 2023 | Pages: 157 | SKU: IRTNTR45858 |
Motorcycle Helmet Heads-up Display Market by Application, End-user, and Geography- Forecast 2023-2027
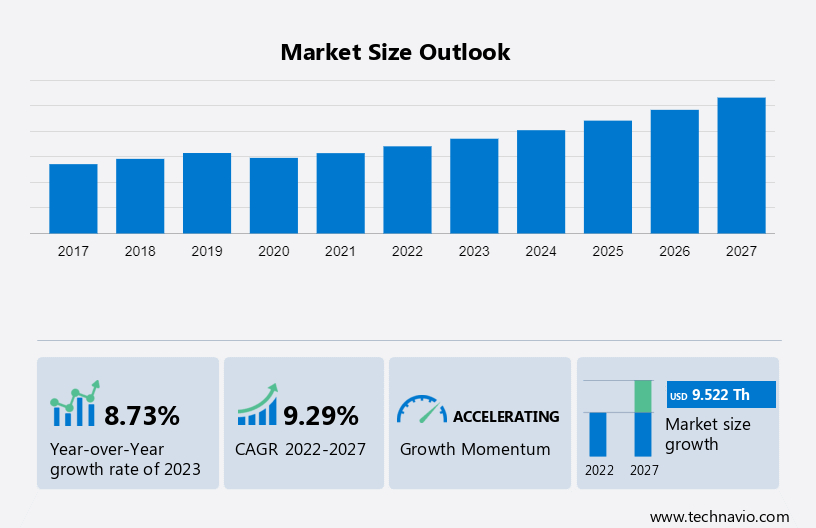
The motorcycle helmet heads-up display market size is forecast to increase by USD 9,522.16 from 2022 to 2027, accelerating at a CAGR of 9.2%. The US held the largest market share in 2017, projecting an outstanding revenue of USD 3,901.05. The report includes the Motorcycle Helmet Heads-up Display Market's projected outlook, and it is divided by Application comprising racing professionals and regular users, End-user comprising OEM and aftermarket segments, and Geographical regions comprising Europe, North America, APAC, South America, and Middle East and Africa. The market size, historical market size (2017-2021), and forecasts are provided on the basis of value (thousand) for all the above segments.
What will be the Size of the Motorcycle Helmet Heads-up Display Market During the Forecast Period?
To learn more about this report, Download Report Sample
Motorcycle Helmet Heads-up Display Market Analysis
Due to the outbreak of Covid-19 in 2020 motorcycle helmets in Europe dropped due to rising economic uncertainty and the sudden closure of many dealerships, service workshops, and registration offices. However, the introduction of vaccination campaigns in the first half of 2021 resulted in a decline in the number of COVID-19 infections, which was followed by the lifting of lockdown restrictions across Europe. It also aided in the resumption of motorbike sports activities in 2021.
One of the major motorcycle helmet heads-up display market's driving factors is the increasing on-road accidents due to distracted riding. Two-wheelers face a heightened risk of accidents, primarily due to the lack of safety equipment. Onboard ADAS and safety systems are crucial to mitigate the severe injuries motorcyclists often suffer. Despite efforts to promote attentive riding and reduce distractions, their impact remains limited.
Head injuries are a leading cause of motorcycle accident fatalities, with thousands of global deaths annually. While many countries mandate helmet use, the incidence of severe injuries and fatalities has seen little change. Improper lane changes are another perilous issue, given the lack of protection motorcycles have. Smart helmets and motorcycle helmet HUD technology offer potential solutions to provide critical information to riders, reducing the risk of collisions. This vulnerability of two-wheeler riders is expected to drive the global motorcycle helmet HUD market in the forecast period.
Motorcycle Helmet Heads-up Display Market Trends
The market share growth by the racing professional segment will be significant during the forecast period.
The racing professional segment was valued at USD 8,547.34 in 2017 and continued to grow until 2021. The racing professional segment mainly includes helmets which are mandatory requirements for sports and adventure events for safety concerns. These helmets are used by most riders for navigation and vehicle information.
Motorcycle Helmet Heads-up Display Market- Revenue Share by Application, 2017-2027
For more details on other segments, Download Sample Report
Furthermore, most motorcycle helmet HUD use augmented reality (AR)/ virtual reality (VR) displays for speed, phone charging status, safety mechanisms, and smart features such as Bluetooth to connect with smartphones and detect accidents and send alerts to emergency support through sending alerts via SMS. Due to increasing competition, especially in the developed motorcycle industry, helmet makers are equipping their products with certified armor that safeguards the head of riders. Thus the above factors can significantly contribute to the motorcycle helmet heads-up display market growth during the forecast period.
North America Holds the Largest Market Share
North America holds 39% of the global motorcycle helmet heads-up display market share.
Another region offering significant growth opportunities to vendors is Europe. Due to the high-volume sales of performance and sports motorcycles in the region and the high penetration rate of advanced ride-assisting functionalities, there is significant market growth in the region.
Additionally, the efforts to curb motorcycle fatalities in the EU are expected to fuel the growth of the motorcycle helmet HUD market in Europe. Furthermore, the presence of all these factors is expected to boost the market for advanced helmet functionalities, such as helmet integrating HUD, smart helmets, and even connected helmets which in turn will drive the motorcycle helmet heads-up display market growth during the forecast period.
Motorcycle Helmet Heads-up Display Market Size, By Region, Global, 2017-2027
To understand geographic trends, Download Report Sample
Motorcycle Helmet Heads-up Display Industry Market Leaders Overview
The Motorcycle Helmet Heads-up Display Market is fragmented in nature. Some significant players include Altimategear, CIMA International, DigiLens Inc., Bayerische Motoren Werke AG, Borderless Inc.
The research report also includes detailed analyses of the competitive landscape of the market and information about 12 market companies, including HOLOEYE Photonics AG, HUDWAY LLC, Intelligent Cranium Helmets, JARVISH Inc., LiveMap, Sawo, Schuberth GmbH, Sena Technologies Inc., SHOEI Co. Ltd., Tilsberk, Whyre Pte Ltd., and EYELIGHTS.
Technavio report provides an in-depth analysis of the market and its players through combined qualitative and quantitative data. The analysis classifies companies into categories based on their business approaches, including pure-play, category-focused, industry-focused, and diversified. Companies are specially categorized into dominant, leading, strong, tentative, and weak, based on their quantitative data analysis.
Segment Overview
The motorcycle helmet heads-up display market report forecasts market growth by revenue at global, regional & country levels and provides an analysis of the latest trends and growth opportunities from 2017 to 2027.
- Application Outlook
- Racing professional
- Normal use
- End-user Outlook
- Large Enterprise
- Small and Medium Enterprise
- Geography Outlook
- North America
- The U.S.
- Canada
- Europe
- The U.K.
- Germany
- France
- Rest of Europe
- APAC
- China
- India
- South America
- Chile
- Argentina
- Brazil
- Middle East & Africa
- Saudi Arabia
- South Africa
- Rest of the Middle East & Africa
- North America
|
Motorcycle Helmet Heads-up Display Market Scope |
|
|
Report Coverage |
Details |
|
Page number |
157 |
|
Base year |
2022 |
|
Historic period |
2017-2021 |
|
Forecast period |
2023-2027 |
|
Growth momentum & CAGR |
Accelerate at a CAGR of 9.29% |
|
Market growth 2023-2027 |
USD 9,522.16 |
|
Market structure |
Fragmented |
|
YoY growth 2022-2023(%) |
8.73 |
|
Regional analysis |
Europe, North America, APAC, South America, and Middle East and Africa |
|
Performing market contribution |
North America at 39% |
|
Key countries |
US, China, France, Germany, and UK |
|
Competitive landscape |
Leading Vendors, Market Positioning of Vendors, Competitive Strategies, and Industry Risks |
|
Key companies profiled |
Altimategear, Bayerische Motoren Werke AG, Borderless Inc., CIMA International, DigiLens Inc., HOLOEYE Photonics AG, HUDWAY LLC, Intelligent Cranium Helmets, JARVISH Inc., LiveMap, Sawo, Schuberth GmbH, Sena Technologies Inc., SHOEI Co. Ltd., Tilsberk, Whyre Pte Ltd., and EYELIGHTS |
|
Market dynamics |
Parent market analysis, Market growth inducers and obstacles, Fast-growing and slow-growing segment analysis, COVID-19 impact and recovery analysis and future consumer dynamics, Market condition analysis for forecast period |
|
Customization purview |
If our report has not included the data that you are looking for, you can reach out to our analysts and get segments customized. |
What are the Key Data Covered in this Motorcycle Helmet Heads-up Display Market Research Report?
- CAGR of the market during the forecast period
- Detailed information on factors that will drive the growth of the market between 2023 and 2027
- Precise estimation of the market size and its contribution of the market in focus to the parent market
- Accurate predictions about upcoming trends and changes in consumer behaviour
- Growth of the market across Europe, North America, APAC, South America, and Middle East and Africa
- Thorough analysis of the market’s competitive landscape and detailed information about vendors
- Comprehensive analysis of factors that will challenge the growth of market vendors
We can help! Our analysts can customize this market research report to meet your requirements.
1 Executive Summary
- 1.1 Market overview
- Exhibit 01: Executive Summary – Chart on Market Overview
- Exhibit 02: Executive Summary – Data Table on Market Overview
- Exhibit 03: Executive Summary – Chart on Global Market Characteristics
- Exhibit 04: Executive Summary – Chart on Market by Geography
- Exhibit 05: Executive Summary – Chart on Market Segmentation by Application
- Exhibit 06: Executive Summary – Chart on Market Segmentation by End-user
- Exhibit 07: Executive Summary – Chart on Incremental Growth
- Exhibit 08: Executive Summary – Data Table on Incremental Growth
- Exhibit 09: Executive Summary – Chart on Vendor Market Positioning
2 Market Landscape
- 2.1 Market ecosystem
- Exhibit 10: Parent market
- Exhibit 11: Market Characteristics
3 Market Sizing
- 3.1 Market definition
- Exhibit 12: Offerings of vendors included in the market definition
- 3.2 Market segment analysis
- Exhibit 13: Market segments
- 3.3 Market size 2022
- 3.4 Market outlook: Forecast for 2022-2027
- Exhibit 14: Chart on Global - Market size and forecast 2022-2027 ($ thousand)
- Exhibit 15: Data Table on Global - Market size and forecast 2022-2027 ($ thousand)
- Exhibit 16: Chart on Global Market: Year-over-year growth 2022-2027 (%)
- Exhibit 17: Data Table on Global Market: Year-over-year growth 2022-2027 (%)
4 Historic Market Size
- 4.1 Global motorcycle helmet heads-up display market 2017 - 2021
- Exhibit 18: Historic Market Size – Data Table on global motorcycle helmet heads-up display market 2017 - 2021 ($ thousand)
- 4.2 Application Segment Analysis 2017 - 2021
- Exhibit 19: Historic Market Size – Application Segment 2017 - 2021 ($ thousand)
- 4.3 End-user Segment Analysis 2017 - 2021
- Exhibit 20: Historic Market Size – End-user Segment 2017 - 2021 ($ thousand)
- 4.4 Geography Segment Analysis 2017 - 2021
- Exhibit 21: Historic Market Size – Geography Segment 2017 - 2021 ($ thousand)
- 4.5 Country Segment Analysis 2017 - 2021
- Exhibit 22: Historic Market Size – Country Segment 2017 - 2021 ($ thousand)
5 Five Forces Analysis
- 5.1 Five forces summary
- Exhibit 23: Five forces analysis - Comparison between 2022 and 2027
- 5.2 Bargaining power of buyers
- Exhibit 24: Chart on Bargaining power of buyers – Impact of key factors 2022 and 2027
- 5.3 Bargaining power of suppliers
- Exhibit 25: Bargaining power of suppliers – Impact of key factors in 2022 and 2027
- 5.4 Threat of new entrants
- Exhibit 26: Threat of new entrants – Impact of key factors in 2022 and 2027
- 5.5 Threat of substitutes
- Exhibit 27: Threat of substitutes – Impact of key factors in 2022 and 2027
- 5.6 Threat of rivalry
- Exhibit 28: Threat of rivalry – Impact of key factors in 2022 and 2027
- 5.7 Market condition
- Exhibit 29: Chart on Market condition - Five forces 2022 and 2027
6 Market Segmentation by Application
- 6.1 Market segments
- Exhibit 30: Chart on Application - Market share 2022-2027 (%)
- Exhibit 31: Data Table on Application - Market share 2022-2027 (%)
- 6.2 Comparison by Application
- Exhibit 32: Chart on Comparison by Application
- Exhibit 33: Data Table on Comparison by Application
- 6.3 Racing professional - Market size and forecast 2022-2027
- Exhibit 34: Chart on Racing professional - Market size and forecast 2022-2027 ($ thousand)
- Exhibit 35: Data Table on Racing professional - Market size and forecast 2022-2027 ($ thousand)
- Exhibit 36: Chart on Racing professional - Year-over-year growth 2022-2027 (%)
- Exhibit 37: Data Table on Racing professional - Year-over-year growth 2022-2027 (%)
- 6.4 Normal use - Market size and forecast 2022-2027
- Exhibit 38: Chart on Normal use - Market size and forecast 2022-2027 ($ thousand)
- Exhibit 39: Data Table on Normal use - Market size and forecast 2022-2027 ($ thousand)
- Exhibit 40: Chart on Normal use - Year-over-year growth 2022-2027 (%)
- Exhibit 41: Data Table on Normal use - Year-over-year growth 2022-2027 (%)
- 6.5 Market opportunity by Application
- Exhibit 42: Market opportunity by Application ($ thousand)
- Exhibit 43: Data Table on Market opportunity by Application ($ thousand)
7 Market Segmentation by End-user
- 7.1 Market segments
- Exhibit 44: Chart on End-user - Market share 2022-2027 (%)
- Exhibit 45: Data Table on End-user - Market share 2022-2027 (%)
- 7.2 Comparison by End-user
- Exhibit 46: Chart on Comparison by End-user
- Exhibit 47: Data Table on Comparison by End-user
- 7.3 OEM - Market size and forecast 2022-2027
- Exhibit 48: Chart on OEM - Market size and forecast 2022-2027 ($ thousand)
- Exhibit 49: Data Table on OEM - Market size and forecast 2022-2027 ($ thousand)
- Exhibit 50: Chart on OEM - Year-over-year growth 2022-2027 (%)
- Exhibit 51: Data Table on OEM - Year-over-year growth 2022-2027 (%)
- 7.4 Aftermarket - Market size and forecast 2022-2027
- Exhibit 52: Chart on Aftermarket - Market size and forecast 2022-2027 ($ thousand)
- Exhibit 53: Data Table on Aftermarket - Market size and forecast 2022-2027 ($ thousand)
- Exhibit 54: Chart on Aftermarket - Year-over-year growth 2022-2027 (%)
- Exhibit 55: Data Table on Aftermarket - Year-over-year growth 2022-2027 (%)
- 7.5 Market opportunity by End-user
- Exhibit 56: Market opportunity by End-user ($ thousand)
- Exhibit 57: Data Table on Market opportunity by End-user ($ thousand)
8 Customer Landscape
- 8.1 Customer landscape overview
- Exhibit 58: Analysis of price sensitivity, lifecycle, customer purchase basket, adoption rates, and purchase criteria
9 Geographic Landscape
- 9.1 Geographic segmentation
- Exhibit 59: Chart on Market share by geography 2022-2027 (%)
- Exhibit 60: Data Table on Market share by geography 2022-2027 (%)
- 9.2 Geographic comparison
- Exhibit 61: Chart on Geographic comparison
- Exhibit 62: Data Table on Geographic comparison
- 9.3 Europe - Market size and forecast 2022-2027
- Exhibit 63: Chart on Europe - Market size and forecast 2022-2027 ($ thousand)
- Exhibit 64: Data Table on Europe - Market size and forecast 2022-2027 ($ thousand)
- Exhibit 65: Chart on Europe - Year-over-year growth 2022-2027 (%)
- Exhibit 66: Data Table on Europe - Year-over-year growth 2022-2027 (%)
- 9.4 North America - Market size and forecast 2022-2027
- Exhibit 67: Chart on North America - Market size and forecast 2022-2027 ($ thousand)
- Exhibit 68: Data Table on North America - Market size and forecast 2022-2027 ($ thousand)
- Exhibit 69: Chart on North America - Year-over-year growth 2022-2027 (%)
- Exhibit 70: Data Table on North America - Year-over-year growth 2022-2027 (%)
- 9.5 APAC - Market size and forecast 2022-2027
- Exhibit 71: Chart on APAC - Market size and forecast 2022-2027 ($ thousand)
- Exhibit 72: Data Table on APAC - Market size and forecast 2022-2027 ($ thousand)
- Exhibit 73: Chart on APAC - Year-over-year growth 2022-2027 (%)
- Exhibit 74: Data Table on APAC - Year-over-year growth 2022-2027 (%)
- 9.6 South America - Market size and forecast 2022-2027
- Exhibit 75: Chart on South America - Market size and forecast 2022-2027 ($ thousand)
- Exhibit 76: Data Table on South America - Market size and forecast 2022-2027 ($ thousand)
- Exhibit 77: Chart on South America - Year-over-year growth 2022-2027 (%)
- Exhibit 78: Data Table on South America - Year-over-year growth 2022-2027 (%)
- 9.7 Middle East and Africa - Market size and forecast 2022-2027
- Exhibit 79: Chart on Middle East and Africa - Market size and forecast 2022-2027 ($ thousand)
- Exhibit 80: Data Table on Middle East and Africa - Market size and forecast 2022-2027 ($ thousand)
- Exhibit 81: Chart on Middle East and Africa - Year-over-year growth 2022-2027 (%)
- Exhibit 82: Data Table on Middle East and Africa - Year-over-year growth 2022-2027 (%)
- 9.8 US - Market size and forecast 2022-2027
- Exhibit 83: Chart on US - Market size and forecast 2022-2027 ($ thousand)
- Exhibit 84: Data Table on US - Market size and forecast 2022-2027 ($ thousand)
- Exhibit 85: Chart on US - Year-over-year growth 2022-2027 (%)
- Exhibit 86: Data Table on US - Year-over-year growth 2022-2027 (%)
- 9.9 France - Market size and forecast 2022-2027
- Exhibit 87: Chart on France - Market size and forecast 2022-2027 ($ thousand)
- Exhibit 88: Data Table on France - Market size and forecast 2022-2027 ($ thousand)
- Exhibit 89: Chart on France - Year-over-year growth 2022-2027 (%)
- Exhibit 90: Data Table on France - Year-over-year growth 2022-2027 (%)
- 9.10 Germany - Market size and forecast 2022-2027
- Exhibit 91: Chart on Germany - Market size and forecast 2022-2027 ($ thousand)
- Exhibit 92: Data Table on Germany - Market size and forecast 2022-2027 ($ thousand)
- Exhibit 93: Chart on Germany - Year-over-year growth 2022-2027 (%)
- Exhibit 94: Data Table on Germany - Year-over-year growth 2022-2027 (%)
- 9.11 UK - Market size and forecast 2022-2027
- Exhibit 95: Chart on UK - Market size and forecast 2022-2027 ($ thousand)
- Exhibit 96: Data Table on UK - Market size and forecast 2022-2027 ($ thousand)
- Exhibit 97: Chart on UK - Year-over-year growth 2022-2027 (%)
- Exhibit 98: Data Table on UK - Year-over-year growth 2022-2027 (%)
- 9.12 China - Market size and forecast 2022-2027
- Exhibit 99: Chart on China - Market size and forecast 2022-2027 ($ thousand)
- Exhibit 100: Data Table on China - Market size and forecast 2022-2027 ($ thousand)
- Exhibit 101: Chart on China - Year-over-year growth 2022-2027 (%)
- Exhibit 102: Data Table on China - Year-over-year growth 2022-2027 (%)
- 9.13 Market opportunity by geography
- Exhibit 103: Market opportunity by geography ($ thousand)
- Exhibit 104: Data Tables on Market opportunity by geography ($ thousand)
10 Drivers, Challenges, and Trends
- 10.1 Market drivers
- 10.2 Market challenges
- 10.3 Impact of drivers and challenges
- Exhibit 105: Impact of drivers and challenges in 2022 and 2027
- 10.4 Market trends
11 Vendor Landscape
- 11.1 Overview
- 11.2 Vendor landscape
- Exhibit 106: Overview on Criticality of inputs and Factors of differentiation
- 11.3 Landscape disruption
- Exhibit 107: Overview on factors of disruption
- 11.4 Industry risks
- Exhibit 108: Impact of key risks on business
12 Vendor Analysis
- 12.1 Vendors covered
- Exhibit 109: Vendors covered
- 12.2 Market positioning of vendors
- Exhibit 110: Matrix on vendor position and classification
- 12.3 Altimategear
- Exhibit 111: Altimategear - Overview
- Exhibit 112: Altimategear - Product / Service
- Exhibit 113: Altimategear - Key offerings
- 12.4 Bayerische Motoren Werke AG
- Exhibit 114: Bayerische Motoren Werke AG - Overview
- Exhibit 115: Bayerische Motoren Werke AG - Business segments
- Exhibit 116: Bayerische Motoren Werke AG - Key news
- Exhibit 117: Bayerische Motoren Werke AG - Key offerings
- Exhibit 118: Bayerische Motoren Werke AG - Segment focus
- 12.5 Borderless Inc.
- Exhibit 119: Borderless Inc. - Overview
- Exhibit 120: Borderless Inc. - Product / Service
- Exhibit 121: Borderless Inc. - Key offerings
- 12.6 CIMA International
- Exhibit 122: CIMA International - Overview
- Exhibit 123: CIMA International - Product / Service
- Exhibit 124: CIMA International - Key offerings
- 12.7 DigiLens Inc.
- Exhibit 125: DigiLens Inc. - Overview
- Exhibit 126: DigiLens Inc. - Product / Service
- Exhibit 127: DigiLens Inc. - Key offerings
- 12.8 EYELIGHTS
- Exhibit 128: EYELIGHTS - Overview
- Exhibit 129: EYELIGHTS - Product / Service
- Exhibit 130: EYELIGHTS - Key offerings
- 12.9 HOLOEYE Photonics AG
- Exhibit 131: HOLOEYE Photonics AG - Overview
- Exhibit 132: HOLOEYE Photonics AG - Product / Service
- Exhibit 133: HOLOEYE Photonics AG - Key offerings
- 12.10 HUDWAY LLC
- Exhibit 134: HUDWAY LLC - Overview
- Exhibit 135: HUDWAY LLC - Product / Service
- Exhibit 136: HUDWAY LLC - Key offerings
- 12.11 Intelligent Cranium Helmets
- Exhibit 137: Intelligent Cranium Helmets - Overview
- Exhibit 138: Intelligent Cranium Helmets - Product / Service
- Exhibit 139: Intelligent Cranium Helmets - Key offerings
- 12.12 JARVISH Inc.
- Exhibit 140: JARVISH Inc. - Overview
- Exhibit 141: JARVISH Inc. - Product / Service
- Exhibit 142: JARVISH Inc. - Key offerings
- 12.13 LiveMap
- Exhibit 143: LiveMap - Overview
- Exhibit 144: LiveMap - Product / Service
- Exhibit 145: LiveMap - Key offerings
- 12.14 Sawo
- Exhibit 146: Sawo - Overview
- Exhibit 147: Sawo - Product / Service
- Exhibit 148: Sawo - Key offerings
- 12.15 Schuberth GmbH
- Exhibit 149: Schuberth GmbH - Overview
- Exhibit 150: Schuberth GmbH - Product / Service
- Exhibit 151: Schuberth GmbH - Key offerings
- 12.16 Sena Technologies Inc.
- Exhibit 152: Sena Technologies Inc. - Overview
- Exhibit 153: Sena Technologies Inc. - Product / Service
- Exhibit 154: Sena Technologies Inc. - Key offerings
- 12.17 SHOEI Co. Ltd.
- Exhibit 155: SHOEI Co. Ltd. - Overview
- Exhibit 156: SHOEI Co. Ltd. - Product / Service
- Exhibit 157: SHOEI Co. Ltd. - Key news
- Exhibit 158: SHOEI Co. Ltd. - Key offerings
13 Appendix
- 13.1 Scope of the report
- 13.2 Inclusions and exclusions checklist
- Exhibit 159: Inclusions checklist
- Exhibit 160: Exclusions checklist
- 13.3 Currency conversion rates for US$
- Exhibit 161: Currency conversion rates for US$
- 13.4 Research methodology
- Exhibit 162: Research methodology
- Exhibit 163: Validation techniques employed for market sizing
- Exhibit 164: Information sources
- 13.5 List of abbreviations
- Exhibit 165: List of abbreviations
Research Framework
Technavio presents a detailed picture of the market by way of study, synthesis, and summation of data from multiple sources. The analysts have presented the various facets of the market with a particular focus on identifying the key industry influencers. The data thus presented is comprehensive, reliable, and the result of extensive research, both primary and secondary.
INFORMATION SOURCES
Primary sources
- Manufacturers and suppliers
- Channel partners
- Industry experts
- Strategic decision makers
Secondary sources
- Industry journals and periodicals
- Government data
- Financial reports of key industry players
- Historical data
- Press releases
DATA ANALYSIS
Data Synthesis
- Collation of data
- Estimation of key figures
- Analysis of derived insights
Data Validation
- Triangulation with data models
- Reference against proprietary databases
- Corroboration with industry experts
REPORT WRITING
Qualitative
- Market drivers
- Market challenges
- Market trends
- Five forces analysis
Quantitative
- Market size and forecast
- Market segmentation
- Geographical insights
- Competitive landscape
PURCHASE FULL REPORT OF
motorcycle helmet heads-up display market market
Key Questions Answered
- What are the key global market and the regional market share?
- What are the revenue-generating key market segments?
- What are the key factors driving and challenging this market’s growth?
- Who are the key market vendors and their growth strategies?
- What are the latest trends influencing the growth of this market?
- What are the variables influencing the market growth in the primary regions?
- What are the factors influencing the growth of the parent market?
Why should you prefer Technavio's market insights report?
- Off-the-shelf research reports
- Reports can be tailored to meet the customer's needs
- Trusted by more than 100 fortune 500 organizations
- Information about the market's key drivers, trends, and challenges
- Parent market analysis
- Every week, 50,000 people visit our subscription platform
- Detailed vendors report with competitive landscape
- Covid-19 impact and recovery analysis
- Data on revenue-generating market segments
- Details on the market shares of various regions
- Five-force market analysis