Myopia and Presbyopia Treatment Market Analysis Asia, North America, Europe, Rest of World (ROW) - US, Canada, Germany, China, Japan - Size and Forecast 2023-2027
| Published: Oct 2023 | Pages: 166 | SKU: IRTNTR74159 |
Myopia and Presbyopia Treatment Market Report 2023-2027
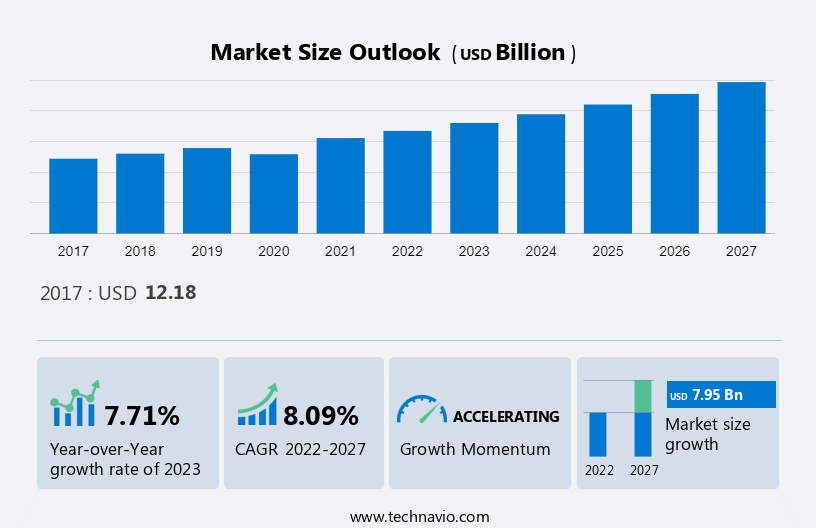
The global myopia and presbyopia treatment market size is estimated to grow by USD 7.95 billion at a compound annual growth rate (CAGR) of 8.09% between 2022 and 2027.
The growing global awareness of vision care is boosting the myopia and presbyopia treatment market. Technological advancements, prolonged screen time, and initiatives in high-prevalence regions like China and South Korea underscore the importance of early intervention. Increased healthcare spending and a heightened understanding of the impact on daily life are driving individuals to seek professional treatment for these vision issues. Recognizing that myopia and presbyopia can significantly affect quality of life, people are actively seeking solutions, contributing to the market's growth.
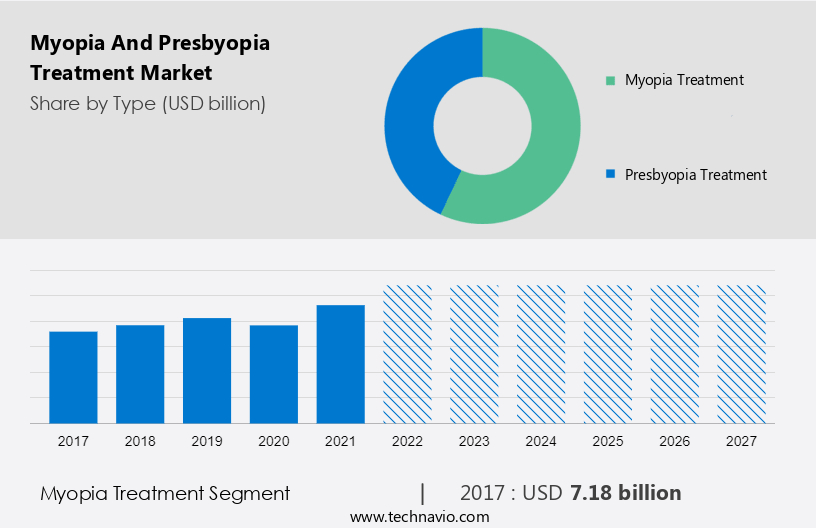
- Technavio has segmented the market into Type (myopia treatment and presbyopia treatment) and Product (lenses and glass, surgery, and drug).
- The geography segment includes key regions such as Asia, North America, Europe, and Rest of World (ROW)
It also includes an in-depth analysis of drivers, market trends and analysis, and challenges. Our report examines historical data from 2017 - 2021 and market forecast besides analyzing the current market scenario.
What will be the Size of the Myopia and Presbyopia Treatment Market During the Forecast Period?
To learn more about this report, Download Report Sample
Segmentation by Type and Geography Analysis
The market share growth of the Myopia treatment segment will be significant during the forecast period. It is pivotal in the global market. Corrective lenses, like eyeglasses or contacts, are commonly used to redirect light onto the retina, improving vision. Refractive surgery, such as LASIK, reshapes the cornea, reducing or eliminating the need for glasses. Orthokeratology involves the overnight use of special lenses for temporary vision correction. Emerging myopia control strategies, like multifocal contact lenses, aim to slow progression, with some showing nearly 50% effectiveness in children according to the NIH. These advancements are expected to drive the demand for myopia treatment, particularly in the market.
The segment was valued at USD 7.18 billion in 2017.
Get a glance at the market contribution of various segments Download PDF Sample
Presbyopia treatment is vital in the global market due to the aging population. Corrective lenses, like bifocals or multifocal contacts, are common options. Advancements from companies like Zeiss and Alcon offer improved visual performance with multiple focal points. LASIK has evolved to address presbyopia, creating a multifocal corneal surface for clear vision at different distances, reducing dependence on lenses. Pharmaceutical developments in presbyopia treatment further contribute to the expanding market.
Regional Analysis
For more insights about the market share of various regions Download PDF Sample now!
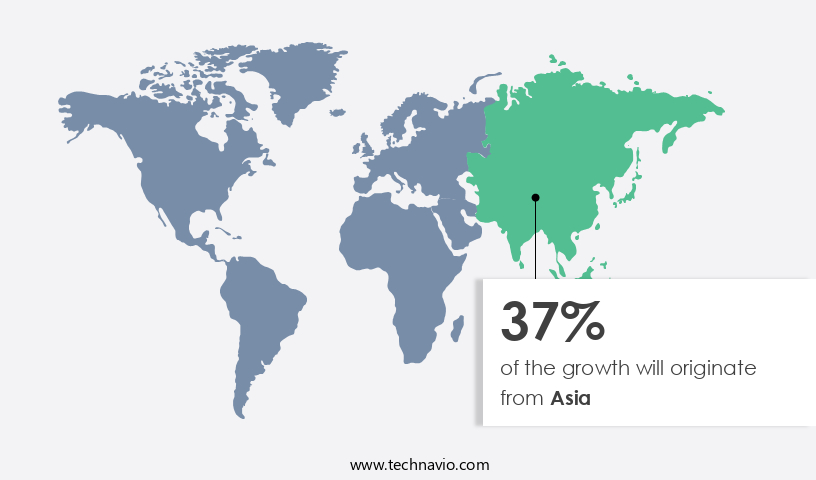
Asia is estimated to contribute 37% to the growth of the global market during the forecast period. Technavio’s analysts have elaborately explained the regional trends and drivers will shape the market during the forecast period.
Asia's eye care market showes growth despite challenges such as high therapeutic costs and limited healthcare infrastructure. Marginal growth is expected due to the approval of treatments and increased initiatives to raise awareness of eye disorders, like myopia and presbyopia. The region's primary driver is the growing awareness of eye diseases. Initiatives like World Sight Day and myopia awareness campaigns in India contribute to overcoming the lack of awareness. EssilorLuxottica's participation in Vision China 2022 and Zhaoke Ophthalmology's collaboration with Visus Therapeutics are examples of efforts to promote eye health in the region. Collaborations for the development of eye disease therapies, such as Arctic Vision's partnership with Eyenovia, indicate the region's commitment to advancing eye care. Approvals for therapeutics, like Entod Pharmaceuticals' phase 3 trials for atropine eye drops, signal a positive trajectory for Asia's eye care market during the forecast period.
Key Market Players
Companies are implementing various strategies, such as strategic alliances,market forecasting, partnerships, mergers and acquisitions, geographical expansion, and product/service launches, to enhance their presence in the market. The market growth and forecasting report also includes detailed analyses of the competitive landscape of the market and information about 20 market companies, including:
AbbVie Inc., Alcon Inc., Arctic Vision, Bausch Health Companies Inc., BVI Holdings Ltd., Carl Zeiss AG, ENTOD INTERNATIONAL, EssilorLuxottica, F. Hoffmann La Roche Ltd., Johnson and Johnson, Metall Zug AG, NIDEK Co. Ltd., Ophtec BV, Orasis Pharmaceuticals Inc., Regeneron Pharmaceuticals Inc., Sanjeevan School For Perfect Eyesight, Sydnexis Inc., The Cooper Companies Inc., Topcon Corp., Vision Care Group, Visus Therapeutics Inc., Ziemer Ophthalmic Systems AG, and Evotec SE
Qualitative and quantitative analysis of companies has been conducted to help clients understand the wider business environment as well as the strengths and weaknesses of key market players. Data is qualitatively analyzed to categorize companies as pure play, category-focused, industry-focused, and diversified; it is quantitatively analyzed to categorize companies as dominant, leading, strong, tentative, and weak.
Key Drivers, Trends, Challenges, and Customer Landscape
There are multiple factors influencing to the market growth analysis. Our researchers analyzed the data with 2022 as the base year, along with the key drivers, trends, and challenges.
Key Drivers
The market is seeing a significant uptick in demand, primarily driven by the aging population seeking vision correction. Lifestyle changes, technology advancements, and increased awareness of vision disorders contribute to this surge. The aging global population is prone to myopia and presbyopia, fueling the need for treatment options. Modern lifestyles, characterized by prolonged screen time, amplify vision issues, prompting more people to seek corrective measures. Advancements in technology, such as laser surgeries and implantable lenses, provide effective and convenient solutions, contributing to the rising demand. Additionally, increased awareness campaigns by governments and healthcare organizations encourage early detection and treatment, further boosting market growth.
Significant Trends
The market is undergoing a significant transformation with the introduction of multifocal intraocular lenses. These lenses, exemplified by Alcon's AcrySof IQ ReSTOR, offer a revolutionary approach by addressing both myopia and presbyopia simultaneously. Unlike traditional lenses, multifocal intraocular lenses provide clear vision at various distances, eliminating the need for additional correction like glasses or contacts. Their approval by regulatory authorities globally reflects their effectiveness. With the increasing prevalence of myopia and presbyopia, these lenses offer a comprehensive and cost-effective solution, driving their adoption and contributing to the market's growth.
Major Challenges
The high cost of treatment poses a significant challenge in the global market. Corrective lenses, including specialized options, can be costly, impacting patients, particularly those in low-income communities. Refractive surgeries like LASIK or PRK offer long-term solutions but come with high price tags, making them inaccessible for many. The financial burden affects healthcare providers as well, limiting their investment in advanced technologies and equipment. This, in turn, restricts access to treatment options and may deter individuals from seeking early intervention. The high cost of treatment is expected to negatively impact market growth during the forecast period.
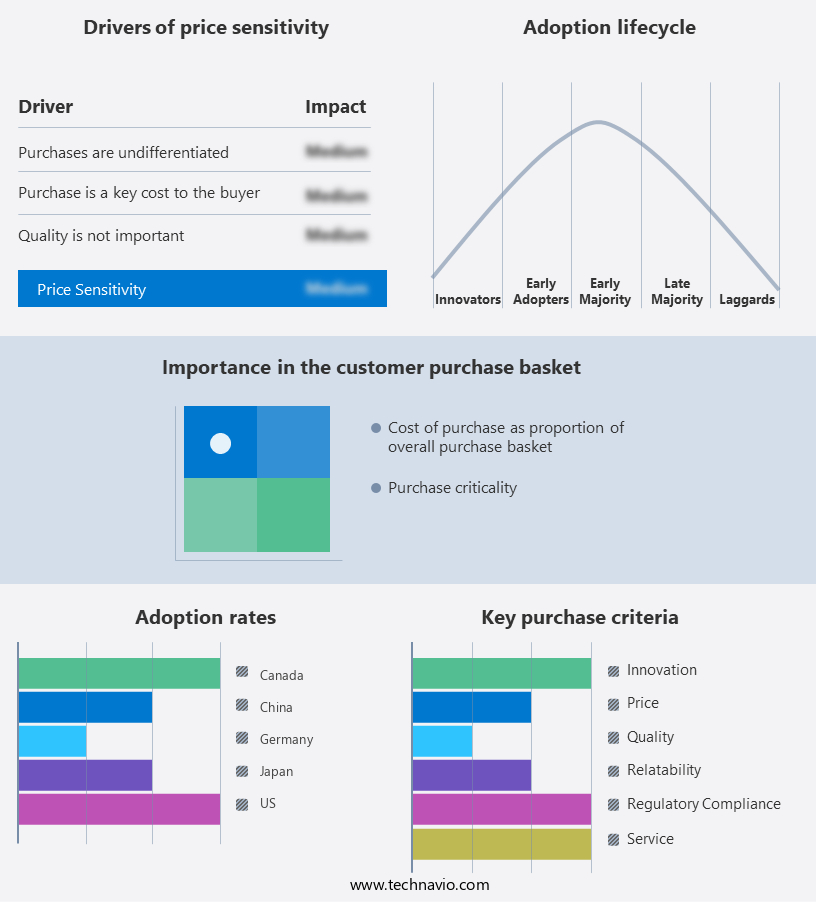
Key Market Customer Landscape
The market research and growth report includes the adoption lifecycle of the market, covering from the innovator’s stage to the laggard’s stage. It focuses on adoption rates in different regions based on penetration. Furthermore, the report also includes key purchase criteria and drivers of price sensitivity to help companies evaluate and develop their growth strategies.
Customer Landscape
Market Dynamics
The Myopia and Presbyopia Treatment Market is witnessing a surge due to rising cases of vision loss, particularly in individuals aged over 50, affecting 128 million people in regions like East Asia, South Asia, and Southeast Asia. Developing countries with a growing geriatric population face challenges of age and lifestyle-associated vision impairments. Undiagnosed presbyopia and late myopia diagnosis contribute to treatment costs. Advanced solutions, including intraocular phakic presbyopic lenses and implantable contact lenses, offer benefits like accuracy and speed in ophthalmic surgeries.
Ongoing studies focus on technologically advanced products, such as corneal inlays and multifocal lenses, addressing nearsightedness and dry eyes. Minimally invasive techniques like PresbyLASIK and Conductive Keratoplasty provide alternatives for non-LASIK patients. The market is characterized by a diverse product pipeline, emphasizing the preference for progressive multifocals with innovations like anti-reflexive coating and photochromic lenses, ensuring improved image clarity and reducing image jumping during eye movements.
Segment Overview
The market report forecasts market growth by revenue at global, regional & country levels and provides an analysis of the latest trends and growth opportunities from 2017 to 2027.
- Deployment Outlook
- Myopia treatment
- Presbyopia treatment
- Application Outlook
- Lenses and glass
- Surgery
- Drug
- Region Outlook
- North America
- The U.S.
- Canada
- Europe
- U.K.
- Germany
- France
- Rest of Europe
- APAC
- China
- India
- Middle East & Africa
- Saudi Arabia
- South Africa
- Rest of the Middle East & Africa
- North America
|
Myopia and Presbyopia Treatment Market Scope |
|
|
Report Coverage |
Details |
|
Page number |
166 |
|
Base year |
2022 |
|
Historic period |
2017 - 2021 |
|
Forecast period |
2023-2027 |
|
Growth momentum & CAGR |
Accelerate at a CAGR of 8.09% |
|
Market growth 2023-2027 |
USD 7.94 billion |
|
Market structure |
Fragmented |
|
YoY growth 2022-2023(%) |
7.71 |
|
Regional analysis |
Asia, North America, Europe, and Rest of World (ROW) |
|
Performing market contribution |
Asia at 37% |
|
Key countries |
US, Canada, Germany, China, and Japan |
|
Competitive landscape |
Leading Vendors, Market Positioning of Vendors, Competitive Strategies, and Industry Risks |
|
Key companies profiled |
AbbVie Inc., Alcon Inc., Arctic Vision, Bausch Health Companies Inc., BVI Holdings Ltd., Carl Zeiss AG, ENTOD INTERNATIONAL, EssilorLuxottica, F. Hoffmann La Roche Ltd., Johnson and Johnson, Metall Zug AG, NIDEK Co. Ltd., Ophtec BV, Orasis Pharmaceuticals Inc., Regeneron Pharmaceuticals Inc., Sanjeevan School For Perfect Eyesight, Sydnexis Inc., The Cooper Companies Inc., Topcon Corp., Vision Care Group, Visus Therapeutics Inc., Ziemer Ophthalmic Systems AG, and Evotec SE |
|
Market dynamics |
Parent market analysis, Market growth inducers and obstacles, Fast-growing and slow-growing segment analysis, COVID 19 impact and recovery analysis and future consumer dynamics, Market condition analysis for forecast period |
|
Customization purview |
If our report has not included the data that you are looking for, you can reach out to our analysts and get segments customized. |
Download Sample PDF at your Fingertips
What are the Key Data Covered in this Market Research Report?
- CAGR of the market during the forecast period
- Detailed information on factors that will drive the growth of the between 2023 and 2027
- Precise estimation of the size of the size and its contribution n of the market in focus to the parent market
- Detailed analysis of customer landscape covering Diver of price sensitivity, Adoption of the lifecycle, and key purchase criteria
- Companies landscape comparing criticality of inputs and factors of differentiation
- Exclusive Matrix on companies position and classification
- Accurate predictions about upcoming market growth and trends and changes in consumer behavior
- Growth of the market industry across Asia, North America, Europe, and Rest of World (ROW)
- Thorough analysis of the market’s competitive landscape and detailed information about companies
- Comprehensive analysis of factors that will challenge the growth of companies
We can help! Our analysts can customize this market research report to meet your requirements. Get in touch
1 Executive Summary
- 1.1 Market overview
- Exhibit 01: Executive Summary – Chart on Market Overview
- Exhibit 02: Executive Summary – Data Table on Market Overview
- Exhibit 03: Executive Summary – Chart on Global Market Characteristics
- Exhibit 04: Executive Summary – Chart on Market by Geography
- Exhibit 05: Executive Summary – Chart on Market Segmentation by Type
- Exhibit 06: Executive Summary – Chart on Market Segmentation by Product
- Exhibit 07: Executive Summary – Chart on Incremental Growth
- Exhibit 08: Executive Summary – Data Table on Incremental Growth
- Exhibit 09: Executive Summary – Chart on Vendor Market Positioning
2 Market Landscape
- 2.1 Market ecosystem
- Exhibit 10: Parent market
- Exhibit 11: Market Characteristics
3 Market Sizing
- 3.1 Market definition
- Exhibit 12: Offerings of vendors included in the market definition
- 3.2 Market segment analysis
- Exhibit 13: Market segments
- 3.3 Market size 2022
- 3.4 Market outlook: Forecast for 2022-2027
- Exhibit 14: Chart on Global - Market size and forecast 2022-2027 ($ billion)
- Exhibit 15: Data Table on Global - Market size and forecast 2022-2027 ($ billion)
- Exhibit 16: Chart on Global Market: Year-over-year growth 2022-2027 (%)
- Exhibit 17: Data Table on Global Market: Year-over-year growth 2022-2027 (%)
4 Historic Market Size
- 4.1 Global myopia and presbyopia treatment market 2017 - 2021
- Exhibit 18: Historic Market Size – Data Table on global myopia and presbyopia treatment market 2017 - 2021 ($ billion)
- 4.2 Type Segment Analysis 2017 - 2021
- Exhibit 19: Historic Market Size – Type Segment 2017 - 2021 ($ billion)
- 4.3 Product Segment Analysis 2017 - 2021
- Exhibit 20: Historic Market Size – Product Segment 2017 - 2021 ($ billion)
- 4.4 Geography Segment Analysis 2017 - 2021
- Exhibit 21: Historic Market Size – Geography Segment 2017 - 2021 ($ billion)
- 4.5 Country Segment Analysis 2017 - 2021
- Exhibit 22: Historic Market Size – Country Segment 2017 - 2021 ($ billion)
5 Five Forces Analysis
- 5.1 Five forces summary
- Exhibit 23: Five forces analysis - Comparison between 2022 and 2027
- 5.2 Bargaining power of buyers
- Exhibit 24: Chart on Bargaining power of buyers – Impact of key factors 2022 and 2027
- 5.3 Bargaining power of suppliers
- Exhibit 25: Bargaining power of suppliers – Impact of key factors in 2022 and 2027
- 5.4 Threat of new entrants
- Exhibit 26: Threat of new entrants – Impact of key factors in 2022 and 2027
- 5.5 Threat of substitutes
- Exhibit 27: Threat of substitutes – Impact of key factors in 2022 and 2027
- 5.6 Threat of rivalry
- Exhibit 28: Threat of rivalry – Impact of key factors in 2022 and 2027
- 5.7 Market condition
- Exhibit 29: Chart on Market condition - Five forces 2022 and 2027
6 Market Segmentation by Type
- 6.1 Market segments
- Exhibit 30: Chart on Type - Market share 2022-2027 (%)
- Exhibit 31: Data Table on Type - Market share 2022-2027 (%)
- 6.2 Comparison by Type
- Exhibit 32: Chart on Comparison by Type
- Exhibit 33: Data Table on Comparison by Type
- 6.3 Myopia treatment - Market size and forecast 2022-2027
- Exhibit 34: Chart on Myopia treatment - Market size and forecast 2022-2027 ($ billion)
- Exhibit 35: Data Table on Myopia treatment - Market size and forecast 2022-2027 ($ billion)
- Exhibit 36: Chart on Myopia treatment - Year-over-year growth 2022-2027 (%)
- Exhibit 37: Data Table on Myopia treatment - Year-over-year growth 2022-2027 (%)
- 6.4 Presbyopia treatment - Market size and forecast 2022-2027
- Exhibit 38: Chart on Presbyopia treatment - Market size and forecast 2022-2027 ($ billion)
- Exhibit 39: Data Table on Presbyopia treatment - Market size and forecast 2022-2027 ($ billion)
- Exhibit 40: Chart on Presbyopia treatment - Year-over-year growth 2022-2027 (%)
- Exhibit 41: Data Table on Presbyopia treatment - Year-over-year growth 2022-2027 (%)
- 6.5 Market opportunity by Type
- Exhibit 42: Market opportunity by Type ($ billion)
- Exhibit 43: Data Table on Market opportunity by Type ($ billion)
7 Market Segmentation by Product
- 7.1 Market segments
- Exhibit 44: Chart on Product - Market share 2022-2027 (%)
- Exhibit 45: Data Table on Product - Market share 2022-2027 (%)
- 7.2 Comparison by Product
- Exhibit 46: Chart on Comparison by Product
- Exhibit 47: Data Table on Comparison by Product
- 7.3 Lenses and glass - Market size and forecast 2022-2027
- Exhibit 48: Chart on Lenses and glass - Market size and forecast 2022-2027 ($ billion)
- Exhibit 49: Data Table on Lenses and glass - Market size and forecast 2022-2027 ($ billion)
- Exhibit 50: Chart on Lenses and glass - Year-over-year growth 2022-2027 (%)
- Exhibit 51: Data Table on Lenses and glass - Year-over-year growth 2022-2027 (%)
- 7.4 Surgery - Market size and forecast 2022-2027
- Exhibit 52: Chart on Surgery - Market size and forecast 2022-2027 ($ billion)
- Exhibit 53: Data Table on Surgery - Market size and forecast 2022-2027 ($ billion)
- Exhibit 54: Chart on Surgery - Year-over-year growth 2022-2027 (%)
- Exhibit 55: Data Table on Surgery - Year-over-year growth 2022-2027 (%)
- 7.5 Drug - Market size and forecast 2022-2027
- Exhibit 56: Chart on Drug - Market size and forecast 2022-2027 ($ billion)
- Exhibit 57: Data Table on Drug - Market size and forecast 2022-2027 ($ billion)
- Exhibit 58: Chart on Drug - Year-over-year growth 2022-2027 (%)
- Exhibit 59: Data Table on Drug - Year-over-year growth 2022-2027 (%)
- 7.6 Market opportunity by Product
- Exhibit 60: Market opportunity by Product ($ billion)
- Exhibit 61: Data Table on Market opportunity by Product ($ billion)
8 Customer Landscape
- 8.1 Customer landscape overview
- Exhibit 62: Analysis of price sensitivity, lifecycle, customer purchase basket, adoption rates, and purchase criteria
9 Geographic Landscape
- 9.1 Geographic segmentation
- Exhibit 63: Chart on Market share by geography 2022-2027 (%)
- Exhibit 64: Data Table on Market share by geography 2022-2027 (%)
- 9.2 Geographic comparison
- Exhibit 65: Chart on Geographic comparison
- Exhibit 66: Data Table on Geographic comparison
- 9.3 Asia - Market size and forecast 2022-2027
- Exhibit 67: Chart on Asia - Market size and forecast 2022-2027 ($ billion)
- Exhibit 68: Data Table on Asia - Market size and forecast 2022-2027 ($ billion)
- Exhibit 69: Chart on Asia - Year-over-year growth 2022-2027 (%)
- Exhibit 70: Data Table on Asia - Year-over-year growth 2022-2027 (%)
- 9.4 North America - Market size and forecast 2022-2027
- Exhibit 71: Chart on North America - Market size and forecast 2022-2027 ($ billion)
- Exhibit 72: Data Table on North America - Market size and forecast 2022-2027 ($ billion)
- Exhibit 73: Chart on North America - Year-over-year growth 2022-2027 (%)
- Exhibit 74: Data Table on North America - Year-over-year growth 2022-2027 (%)
- 9.5 Europe - Market size and forecast 2022-2027
- Exhibit 75: Chart on Europe - Market size and forecast 2022-2027 ($ billion)
- Exhibit 76: Data Table on Europe - Market size and forecast 2022-2027 ($ billion)
- Exhibit 77: Chart on Europe - Year-over-year growth 2022-2027 (%)
- Exhibit 78: Data Table on Europe - Year-over-year growth 2022-2027 (%)
- 9.6 Rest of World (ROW) - Market size and forecast 2022-2027
- Exhibit 79: Chart on Rest of World (ROW) - Market size and forecast 2022-2027 ($ billion)
- Exhibit 80: Data Table on Rest of World (ROW) - Market size and forecast 2022-2027 ($ billion)
- Exhibit 81: Chart on Rest of World (ROW) - Year-over-year growth 2022-2027 (%)
- Exhibit 82: Data Table on Rest of World (ROW) - Year-over-year growth 2022-2027 (%)
- 9.7 US - Market size and forecast 2022-2027
- Exhibit 83: Chart on US - Market size and forecast 2022-2027 ($ billion)
- Exhibit 84: Data Table on US - Market size and forecast 2022-2027 ($ billion)
- Exhibit 85: Chart on US - Year-over-year growth 2022-2027 (%)
- Exhibit 86: Data Table on US - Year-over-year growth 2022-2027 (%)
- 9.8 China - Market size and forecast 2022-2027
- Exhibit 87: Chart on China - Market size and forecast 2022-2027 ($ billion)
- Exhibit 88: Data Table on China - Market size and forecast 2022-2027 ($ billion)
- Exhibit 89: Chart on China - Year-over-year growth 2022-2027 (%)
- Exhibit 90: Data Table on China - Year-over-year growth 2022-2027 (%)
- 9.9 Germany - Market size and forecast 2022-2027
- Exhibit 91: Chart on Germany - Market size and forecast 2022-2027 ($ billion)
- Exhibit 92: Data Table on Germany - Market size and forecast 2022-2027 ($ billion)
- Exhibit 93: Chart on Germany - Year-over-year growth 2022-2027 (%)
- Exhibit 94: Data Table on Germany - Year-over-year growth 2022-2027 (%)
- 9.10 Canada - Market size and forecast 2022-2027
- Exhibit 95: Chart on Canada - Market size and forecast 2022-2027 ($ billion)
- Exhibit 96: Data Table on Canada - Market size and forecast 2022-2027 ($ billion)
- Exhibit 97: Chart on Canada - Year-over-year growth 2022-2027 (%)
- Exhibit 98: Data Table on Canada - Year-over-year growth 2022-2027 (%)
- 9.11 Japan - Market size and forecast 2022-2027
- Exhibit 99: Chart on Japan - Market size and forecast 2022-2027 ($ billion)
- Exhibit 100: Data Table on Japan - Market size and forecast 2022-2027 ($ billion)
- Exhibit 101: Chart on Japan - Year-over-year growth 2022-2027 (%)
- Exhibit 102: Data Table on Japan - Year-over-year growth 2022-2027 (%)
- 9.12 Market opportunity by geography
- Exhibit 103: Market opportunity by geography ($ billion)
- Exhibit 104: Data Tables on Market opportunity by geography ($ billion)
10 Drivers, Challenges, and Trends
- 10.1 Market drivers
- 10.2 Market challenges
- 10.3 Impact of drivers and challenges
- Exhibit 105: Impact of drivers and challenges in 2022 and 2027
- 10.4 Market trends
11 Vendor Landscape
- 11.1 Overview
- 11.2 Vendor landscape
- Exhibit 106: Overview on Criticality of inputs and Factors of differentiation
- 11.3 Landscape disruption
- Exhibit 107: Overview on factors of disruption
- 11.4 Industry risks
- Exhibit 108: Impact of key risks on business
12 Vendor Analysis
- 12.1 Vendors covered
- Exhibit 109: Vendors covered
- 12.2 Market positioning of vendors
- Exhibit 110: Matrix on vendor position and classification
- 12.3 AbbVie Inc.
- Exhibit 111: AbbVie Inc. - Overview
- Exhibit 112: AbbVie Inc. - Product / Service
- Exhibit 113: AbbVie Inc. - Key news
- Exhibit 114: AbbVie Inc. - Key offerings
- 12.4 Alcon Inc.
- Exhibit 115: Alcon Inc. - Overview
- Exhibit 116: Alcon Inc. - Business segments
- Exhibit 117: Alcon Inc. - Key offerings
- Exhibit 118: Alcon Inc. - Segment focus
- 12.5 Bausch Health Companies Inc.
- Exhibit 119: Bausch Health Companies Inc. - Overview
- Exhibit 120: Bausch Health Companies Inc. - Business segments
- Exhibit 121: Bausch Health Companies Inc. - Key news
- Exhibit 122: Bausch Health Companies Inc. - Key offerings
- Exhibit 123: Bausch Health Companies Inc. - Segment focus
- 12.6 BVI Holdings Ltd.
- Exhibit 124: BVI Holdings Ltd. - Overview
- Exhibit 125: BVI Holdings Ltd. - Product / Service
- Exhibit 126: BVI Holdings Ltd. - Key offerings
- 12.7 Carl Zeiss AG
- Exhibit 127: Carl Zeiss AG - Overview
- Exhibit 128: Carl Zeiss AG - Business segments
- Exhibit 129: Carl Zeiss AG - Key offerings
- Exhibit 130: Carl Zeiss AG - Segment focus
- 12.8 EssilorLuxottica
- Exhibit 131: EssilorLuxottica - Overview
- Exhibit 132: EssilorLuxottica - Business segments
- Exhibit 133: EssilorLuxottica - Key offerings
- Exhibit 134: EssilorLuxottica - Segment focus
- 12.9 Johnson and Johnson
- Exhibit 135: Johnson and Johnson - Overview
- Exhibit 136: Johnson and Johnson - Business segments
- Exhibit 137: Johnson and Johnson - Key news
- Exhibit 138: Johnson and Johnson - Key offerings
- Exhibit 139: Johnson and Johnson - Segment focus
- 12.10 Metall Zug AG
- Exhibit 140: Metall Zug AG - Overview
- Exhibit 141: Metall Zug AG - Business segments
- Exhibit 142: Metall Zug AG - Key offerings
- Exhibit 143: Metall Zug AG - Segment focus
- 12.11 NIDEK Co. Ltd.
- Exhibit 144: NIDEK Co. Ltd. - Overview
- Exhibit 145: NIDEK Co. Ltd. - Business segments
- Exhibit 146: NIDEK Co. Ltd. - Key offerings
- Exhibit 147: NIDEK Co. Ltd. - Segment focus
- 12.12 Ophtec BV
- Exhibit 148: Ophtec BV - Overview
- Exhibit 149: Ophtec BV - Product / Service
- Exhibit 150: Ophtec BV - Key offerings
- 12.13 Orasis Pharmaceuticals Inc.
- Exhibit 151: Orasis Pharmaceuticals Inc. - Overview
- Exhibit 152: Orasis Pharmaceuticals Inc. - Product / Service
- Exhibit 153: Orasis Pharmaceuticals Inc. - Key offerings
- 12.14 Regeneron Pharmaceuticals Inc.
- Exhibit 154: Regeneron Pharmaceuticals Inc. - Overview
- Exhibit 155: Regeneron Pharmaceuticals Inc. - Product / Service
- Exhibit 156: Regeneron Pharmaceuticals Inc. - Key offerings
- 12.15 Sydnexis Inc.
- Exhibit 157: Sydnexis Inc. - Overview
- Exhibit 158: Sydnexis Inc. - Product / Service
- Exhibit 159: Sydnexis Inc. - Key offerings
- 12.16 Topcon Corp.
- Exhibit 160: Topcon Corp. - Overview
- Exhibit 161: Topcon Corp. - Business segments
- Exhibit 162: Topcon Corp. - Key news
- Exhibit 163: Topcon Corp. - Key offerings
- Exhibit 164: Topcon Corp. - Segment focus
- 12.17 Ziemer Ophthalmic Systems AG
- Exhibit 165: Ziemer Ophthalmic Systems AG - Overview
- Exhibit 166: Ziemer Ophthalmic Systems AG - Product / Service
- Exhibit 167: Ziemer Ophthalmic Systems AG - Key offerings
13 Appendix
- 13.1 Scope of the report
- 13.2 Inclusions and exclusions checklist
- Exhibit 168: Inclusions checklist
- Exhibit 169: Exclusions checklist
- 13.3 Currency conversion rates for US$
- Exhibit 170: Currency conversion rates for US$
- 13.4 Research methodology
- Exhibit 171: Research methodology
- Exhibit 172: Validation techniques employed for market sizing
- Exhibit 173: Information sources
- 13.5 List of abbreviations
- Exhibit 174: List of abbreviations
Research Framework
Technavio presents a detailed picture of the market by way of study, synthesis, and summation of data from multiple sources. The analysts have presented the various facets of the market with a particular focus on identifying the key industry influencers. The data thus presented is comprehensive, reliable, and the result of extensive research, both primary and secondary.
INFORMATION SOURCES
Primary sources
- Manufacturers and suppliers
- Channel partners
- Industry experts
- Strategic decision makers
Secondary sources
- Industry journals and periodicals
- Government data
- Financial reports of key industry players
- Historical data
- Press releases
DATA ANALYSIS
Data Synthesis
- Collation of data
- Estimation of key figures
- Analysis of derived insights
Data Validation
- Triangulation with data models
- Reference against proprietary databases
- Corroboration with industry experts
REPORT WRITING
Qualitative
- Market drivers
- Market challenges
- Market trends
- Five forces analysis
Quantitative
- Market size and forecast
- Market segmentation
- Geographical insights
- Competitive landscape
PURCHASE FULL REPORT OF
myopia and presbyopia treatment market market
Key Questions Answered
- What are the key global market and the regional market share?
- What are the revenue-generating key market segments?
- What are the key factors driving and challenging this market’s growth?
- Who are the key market vendors and their growth strategies?
- What are the latest trends influencing the growth of this market?
- What are the variables influencing the market growth in the primary regions?
- What are the factors influencing the growth of the parent market?
Why should you prefer Technavio's market insights report?
- Off-the-shelf research reports
- Reports can be tailored to meet the customer's needs
- Trusted by more than 100 fortune 500 organizations
- Information about the market's key drivers, trends, and challenges
- Parent market analysis
- Every week, 50,000 people visit our subscription platform
- Detailed vendors report with competitive landscape
- Covid-19 impact and recovery analysis
- Data on revenue-generating market segments
- Details on the market shares of various regions
- Five-force market analysis