Naphtha Market Analysis APAC, North America, Europe, Middle East and Africa, South America - US, China, India, Japan, Germany - Size and Forecast 2023-2027
| Published: Oct 2023 | Pages: 157 | SKU: IRTNTR75194 |
Naphtha Market Analysis and Growth Opportunities
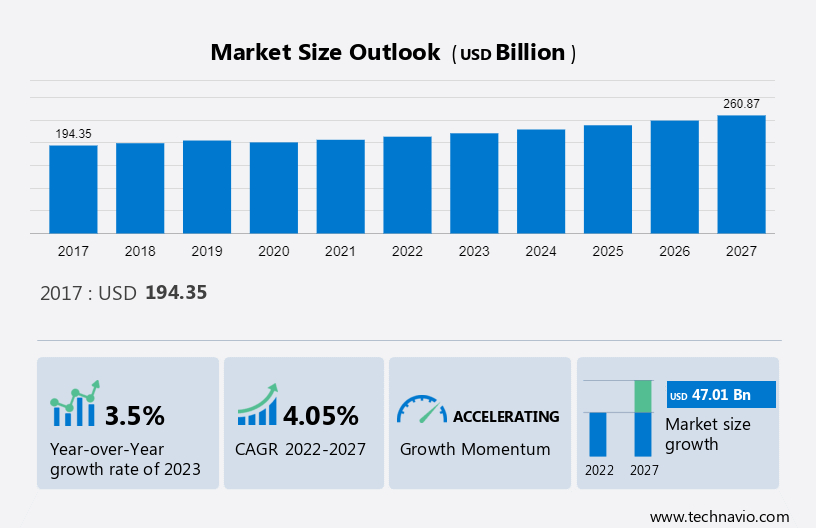
The global naphtha market is projected to reach a value of USD 260.87 billion in 2027, at a CAGR of 4.05% between 2023 and 2027. The naphtha market refers to the global trade and consumption of naphtha, a flammable liquid hydrocarbons mixture. It is commonly used as a feedstock in the petrochemical industry for producing plastics, chemicals, and synthetic fibers.
| Analysis Period | 2017-2027 |
| Market Size (2017) Historic Year | USD 194.35 billion |
| Market Size (2027) - Forecasted Year | USD 260.87 billion |
| Historic Opportunity (2017-2021) | USD 12.70 billion |
| Historic CAGR | 1.60 % |
| Forecasted Opportunity (2023-2027) | USD 47.01 billion |
| Market Opportunity Transformation Growth | 34.23 % |
| Market Opportunity Capitalization | USD 59.71 billion |
Market Overview
The petrochemical industry is the largest consumer of naphtha, accounting for around 75% of total demand. The demand for light naphtha, which is used as a feedstock in gasoline production, is expected to grow. Asia-Pacific region dominates the market in terms of production and consumption. Asia-Pacific region dominates the naphtha industry, with over 31% market share. The price is influenced by factors such as crude oil prices, supply and demand dynamics, and geopolitical events. It can be produced from various sources including crude oil refining, natural gas processing, and coal-to-chemicals technology.
Market Size
Market Drivers and Restraints
The increase in demand in the petrochemical industry is notably driving market growth. A vital feedstock for the production of many petrochemicals, including olefins, aromatics, and other chemicals. The petrochemical industry's explosive expansion is one of the main causes of the increase in demand for naphtha. As more nations around the world are relying on petrochemical products, demand for them has grown exponentially in recent years. The petrochemical sector has therefore been increasing its production capabilities, which has resulted in a corresponding rise in demand.
The petrochemical sector's transition to lighter feedstocks is another factor boosting demand. It is an easy-to-use replacement for heavier feedstocks like crude oil or liquefied petroleum gas (LPG) petroleum products as it typically has a higher boiling point than lighter feedstocks like ethane or propane. Additionally, it is a more cost-effective feedstock for the petrochemical industry than crude oil because it produces more chemicals per barrel. The rising demand for plastics and other polymers has also contributed to the rise in demand. Thus, the abovementioned factors are expected to drive the growth of the global market during the projection years.
Stringent regulations on the usage is the major challenges impeding market expansion. A common feedstock for many industrial processes, including the creation of chemicals, solvent naphtha and fuel, is a colorless liquid hydrocarbon mixture. However, frequent use also carries potential risks to both human health and the environment, which is why governments and regulatory bodies around the world have put strict guidelines into place. The potential to emit volatile organic compounds (VOCs), which aid in the formation of smog and may be harmful to people's health, is one of the main causes of concern.
Another problem is that it could contaminate soil and groundwater if it leaks or spills while being transported or stored. To avoid situations like this, rules have been established for the production, handling, storing, and transportation. Regulatory organizations may also audit and inspect to make sure that the companies are dealing with and operating according to the correct procedures. Thus, such factors are expected to hinder the growth of the global market during the forecast duration.
Significant Market Trends and Analysis
The increase in investment in the extraction is an emerging trend in market development. The petrochemical industry currently views increasing investment as a profitable move. It is being considered by investors as a viable option for constructing new petrochemical plants as well as for expanding existing ones. When compared to other feedstocks, naphtha is less expensive, making it a popular option for businesses looking to minimize their manufacturing costs. Additionally, compared to other feedstocks, naphtha has a higher yield per ton, which increases its appeal.
Moreover, turning into the feedstock of choice for petrochemical producers due to the rising demand for petrochemicals and the requirement for a safe and reliable supply of feedstocks. APAC nations including China, India, and Japan, have significantly invested in infrastructure. For instance, Exxon Mobil Corp. (Exxon Mobil) recently announced an investment in Huizhou, Guangdong Province's Dayawan Petrochemical Industrial Park. It will increase the company's 1.6 million ton annual production. Thus, the above-mentioned factors are expected to drive market growth during the forecast time.
Regulatory Framework and Environmental Impact
The market faces a multitude of government regulations amid evolving global dynamics, prices and industrial landscapes. Key players like Reliance Industries Limited, Exxon Mobil Corporation, and SABIC encounter various hurdles in the production and distribution of naphtha-derived products. Russia and Italy, along with other major economies, confront challenges related to urbanization and shifting demands in various sectors. The fluctuating availability and pricing of key components such as toluene, benzene, propylene, ethylene, and butadiene pose significant hurdles in the production process, affecting downstream industries including coatings and other applications. The process of distillation faces and steam crackers complexities, impacting the overall supply chain of naphtha-based products.
Environmental concerns regarding aircraft emissions, natural gas liquids, and the need for additives underscore the sector's responsibility to address its impact. Collaborations between key end-user industry members like China Petrochemical Corporation, Formosa Petrochemical Corporation, and PDV LLC are crucial for sustainable advancements. Additionally, the sector grapples with challenges related to the maintenance of steam cracking and furnace materials, affecting production and construction activities. Ensuring quality and meeting the demands of diverse end-user industries while addressing environmental threats remains a significant challenge.
Future Outlook of the Market
The market for power stoves in regions like Indonesia, Israel, and Taiwan witnesses a growing demand as consumers seek efficient and innovative cooking solutions. The market dynamics also witness new entrants seeking to establish their image and capture a share by leveraging Japanese technological advancements. As they enter this section of the market, their success hinges on providing a seamless experience and staying updated with the latest renewable price trends.
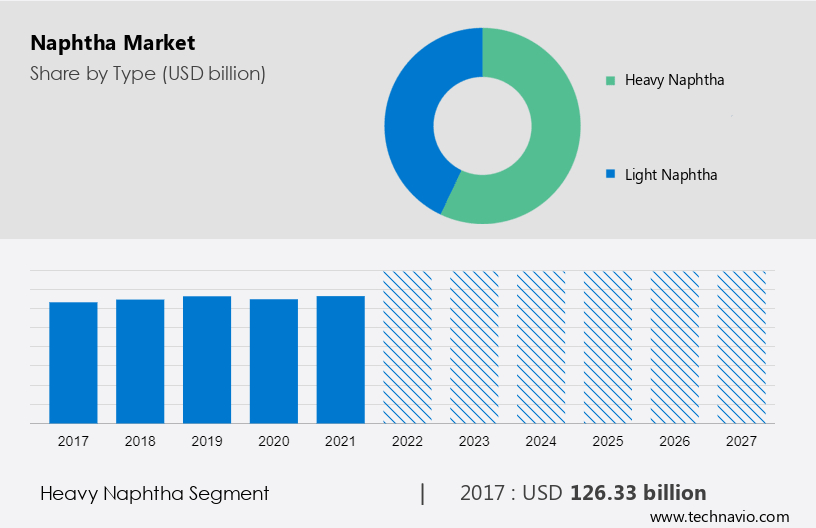
Market Segmentation by Type
The market share growth by the heavy segment will be significant during the forecast years. Due to its adaptable qualities and wide range of uses, heavy segment has attracted a lot of attention in the global market. The demand for heavy segments has significantly increased over the past few years, making it one of the most sought-after products.
Get a glance at the market contribution of the End User segment Request Free Sample
The heavy segment was valued at USD 126.33 billion in 2017 and continued to grow until 2021. The use of heavy in the manufacture of petrochemicals is one of the main factors contributing to its high demand. It is a crucial raw material for the manufacture of many petrochemical goods, including resins, synthetic rubber, and plastics. It plays a vital role in producing fuel products, particularly meeting the gasoline demand. Additionally, the increased popularity of shale gas has led to a growing demand for solvent naphtha as a diluent in the transportation of crude oil. The automotive sector is another important factor boosting the market for heavy segment. Thus, the above-mentioned factors are expected to drive the growth of the segment in the global market during the forecast years.
Naphtha Uses and Applications
The byproduct of crude oil refining is crucial in petrochemical production of petroleum naphtha, gasoline blending, and as a solvent. It's utilized in agriculture and synthetic material manufacturing, with growing interest in its renewable naphtha price.
Regional Analysis
APAC is estimated to contribute 31% to the growth of the global market during the projection period. Technavio’s analysts have elaborately explained the regional trends and drivers that shape the market analysis and report during the forecast duration.
For more insights on the market share of various regions Request Free Sample
In APAC, demand for various petrochemicals is rising, which also increases the demand. The petrochemical industry's explosive growth in the APAC region is one of the main factors supporting demand. Numerous significant chemical producers are located in the region, and they heavily rely on it as a feedstock to create a variety of goods, such as plastics, solvents, and synthetic fibers. The need is anticipated to grow alongside the expansion of these industries. APAC is also seeing an increase in the demand for transportation fuels, that need a blending ingredient to improve their performance characteristics. With the growing number of cars on the roads in countries such as India and China, the demand from the transportation sector is also expected to continue to rise during the projection period.
With several countries in the region having a sizable production capacity, the APAC region is also a significant producer of this fuel. South Korea, Japan, and China are some of the biggest producers, and all three have made significant investments recently to increase their refining capacity. The APAC region is less dependent on imports from other regions as a result of its increased production capacity, which allows it to meet most of its own demand. Hence, such factors will boost regional market growth during the projection period.
Key Players in the Market
Companies are implementing various strategies by analyzing factors such as strategic alliances, partnerships, mergers and acquisitions, geographical expansion, and product or service launches, to enhance their presence in the market growth and forecasting.
2M Holdings Ltd. - The key offerings of the company include the distribution through its subsidiary Banner Chemicals Ltd.
The market growth analysis report also includes detailed analyses of the competitive landscape of the market and information about 15 market companies, including:
2M Holdings Ltd., Alexandria Mineral Oils Co., Bajrang Petrochemicals Pvt. Ltd., Basin Electric Power Cooperative, Chevron Corp., China Petrochemical Corp., Exxon Mobil Corp., Formosa Petrochemical Corp., Ganga Rasayanie Pvt. Ltd., Indian Oil Corp. Ltd., LG Chem Ltd., PAO NOVATEK, Pyroplast Energy Ltd., QatarEnergy, Reliance Industries Ltd., Sasol Ltd., Saudi Arabian Oil Co., Shell plc, UPM Kymmene Corp., and Mitsubishi Chemical Corp.
The ongoing focus on research and development by various research teams globally aims to leverage derivatives, exploring ways to mitigate market volatility and enhance the availability of naphtha-based products. These initiatives play a pivotal role in shaping the future trajectory of the market, influencing not only market dynamics but also industrial competition and strategy. The evolving consumption trends and the exploration of bionaphtha-based and renewable substitutes underscore the industry's commitment to addressing environmental concerns while meeting diverse industrial demands and market growth and trends.
Market Dynamic
With the dynamic developments in global markets, the Naphtha market is a focal point, impacting key players like Reliance Industries Limited. The market, involving the trade and consumption of the flammable liquid hydrocarbon mixture, extends its influence across diverse sectors. With a close relationship to toluene, benzene, propylene, ethylene, and butadiene, the market's consumption trends reflect the evolving needs of economies worldwide. Urbanization and development drive the demand for coatings in regions like Mexico, emphasizing the pivotal role of energy derived from naphtha's distillation. Safety remains paramount given its volatile nature, warranting attention in the context of global Naphtha markets and solvent applications.
Segment Overview
The market research report forecasts market research and growth by revenue at global, regional & country levels and provides an analysis of the latest trends and growth opportunities from 2017 - 2021.
- Type Outlook (USD Billion, 2017 - 2027)
- Heavy
- Light
- Application Outlook (USD Billion, 2017 - 2027)
- Chemicals
- Energy/fuel
- Others
- Region Outlook (USD Billion, 2017 - 2027)
- North America
- The U.S.
- Canada
- Europe
- The U.K.
- Germany
- France
- Rest of Europe
- APAC
- China
- India
- Middle East & Africa
- Saudi Arabia
- South Africa
- Rest of the Middle East & Africa
- South America
- Chile
- Brazil
- Argentina
- North America
|
Naphtha Market Scope |
|
|
Report Coverage |
Details |
|
Page number |
157 |
|
Base year |
2022 |
|
Historic period |
2017 - 2021 |
|
Forecast period |
2023-2027 |
|
Growth momentum & CAGR |
Accelerate at a CAGR of 4.05% |
|
Market growth 2023-2027 |
USD 47.01 billion |
|
Market structure |
Fragmented |
|
YoY growth 2022-2023(%) |
3.5 |
|
Regional analysis |
APAC, North America, Europe, Middle East and Africa, and South America |
|
Performing market contribution |
APAC at 31% |
|
Key countries |
US, China, India, Japan, and Germany |
|
Competitive landscape |
Leading Companies, Market Positioning of Companies, Competitive Strategies, and Industry Risks |
|
Key companies profiled |
2M Holdings Ltd., Alexandria Mineral Oils Co., Bajrang Petrochemicals Pvt. Ltd., Basin Electric Power Cooperative, Chevron Corp., China Petrochemical Corp., Exxon Mobil Corp., Formosa Petrochemical Corp., Ganga Rasayanie Pvt. Ltd., Indian Oil Corp. Ltd., LG Chem Ltd., PAO NOVATEK, Pyroplast Energy Ltd., QatarEnergy, Reliance Industries Ltd., Sasol Ltd., Saudi Arabian Oil Co., Shell plc, UPM Kymmene Corp., and Mitsubishi Chemical Corp. |
|
Market dynamics |
Parent market analysis, Market growth inducers and obstacles, Fast-growing and slow-growing segment analysis, Market forecasting COVID 19 impact and recovery analysis and future consumer dynamics, Market condition analysis for forecast period |
|
Customization purview |
If our report has not included the data that you are looking for, you can reach out to our analysts and get segments customized. |
What are the Key Data Covered in this Market Research Report?
- CAGR of the market during the projection period
- Detailed information on factors that will drive the growth of the market between 2023 and 2027
- Precise estimation of the size of the market size and its contribution of the market in focus to the parent market
- Accurate predictions of market report about upcoming trends and changes in consumer behavior
- Growth of the market industry across APAC, North America, Europe, Middle East and Africa, and South America
- Thorough analysis of the market’s competitive landscape and detailed information about companies
- Comprehensive analysis of factors that will challenge the growth of market companies
We can help! Our analysts can customize this report to meet your requirements. Get in touch
1 Executive Summary
- 1.1 Market overview
- Exhibit 01: Executive Summary – Chart on Market Overview
- Exhibit 02: Executive Summary – Data Table on Market Overview
- Exhibit 03: Executive Summary – Chart on Global Market Characteristics
- Exhibit 04: Executive Summary – Chart on Market by Geography
- Exhibit 05: Executive Summary – Chart on Market Segmentation by Type
- Exhibit 06: Executive Summary – Chart on Market Segmentation by Application
- Exhibit 07: Executive Summary – Chart on Incremental Growth
- Exhibit 08: Executive Summary – Data Table on Incremental Growth
- Exhibit 09: Executive Summary – Chart on Vendor Market Positioning
2 Market Landscape
- 2.1 Market ecosystem
- Exhibit 10: Parent market
- Exhibit 11: Market Characteristics
3 Market Sizing
- 3.1 Market definition
- Exhibit 12: Offerings of vendors included in the market definition
- 3.2 Market segment analysis
- Exhibit 13: Market segments
- 3.3 Market size 2022
- 3.4 Market outlook: Forecast for 2022-2027
- Exhibit 14: Chart on Global - Market size and forecast 2022-2027 ($ billion)
- Exhibit 15: Data Table on Global - Market size and forecast 2022-2027 ($ billion)
- Exhibit 16: Chart on Global Market: Year-over-year growth 2022-2027 (%)
- Exhibit 17: Data Table on Global Market: Year-over-year growth 2022-2027 (%)
4 Historic Market Size
- 4.1 Global naphtha market 2017 - 2021
- Exhibit 18: Historic Market Size – Data Table on Global naphtha market 2017 - 2021 ($ billion)
- 4.2 Type Segment Analysis 2017 - 2021
- Exhibit 19: Historic Market Size – Type Segment 2017 - 2021 ($ billion)
- 4.3 Application Segment Analysis 2017 - 2021
- Exhibit 20: Historic Market Size – Application Segment 2017 - 2021 ($ billion)
- 4.4 Geography Segment Analysis 2017 - 2021
- Exhibit 21: Historic Market Size – Geography Segment 2017 - 2021 ($ billion)
- 4.5 Country Segment Analysis 2017 - 2021
- Exhibit 22: Historic Market Size – Country Segment 2017 - 2021 ($ billion)
5 Five Forces Analysis
- 5.1 Five forces summary
- Exhibit 23: Five forces analysis - Comparison between 2022 and 2027
- 5.2 Bargaining power of buyers
- Exhibit 24: Chart on Bargaining power of buyers – Impact of key factors 2022 and 2027
- 5.3 Bargaining power of suppliers
- Exhibit 25: Bargaining power of suppliers – Impact of key factors in 2022 and 2027
- 5.4 Threat of new entrants
- Exhibit 26: Threat of new entrants – Impact of key factors in 2022 and 2027
- 5.5 Threat of substitutes
- Exhibit 27: Threat of substitutes – Impact of key factors in 2022 and 2027
- 5.6 Threat of rivalry
- Exhibit 28: Threat of rivalry – Impact of key factors in 2022 and 2027
- 5.7 Market condition
- Exhibit 29: Chart on Market condition - Five forces 2022 and 2027
6 Market Segmentation by Type
- 6.1 Market segments
- Exhibit 30: Chart on Type - Market share 2022-2027 (%)
- Exhibit 31: Data Table on Type - Market share 2022-2027 (%)
- 6.2 Comparison by Type
- Exhibit 32: Chart on Comparison by Type
- Exhibit 33: Data Table on Comparison by Type
- 6.3 Heavy naphtha - Market size and forecast 2022-2027
- Exhibit 34: Chart on Heavy naphtha - Market size and forecast 2022-2027 ($ billion)
- Exhibit 35: Data Table on Heavy naphtha - Market size and forecast 2022-2027 ($ billion)
- Exhibit 36: Chart on Heavy naphtha - Year-over-year growth 2022-2027 (%)
- Exhibit 37: Data Table on Heavy naphtha - Year-over-year growth 2022-2027 (%)
- 6.4 Light naphtha - Market size and forecast 2022-2027
- Exhibit 38: Chart on Light naphtha - Market size and forecast 2022-2027 ($ billion)
- Exhibit 39: Data Table on Light naphtha - Market size and forecast 2022-2027 ($ billion)
- Exhibit 40: Chart on Light naphtha - Year-over-year growth 2022-2027 (%)
- Exhibit 41: Data Table on Light naphtha - Year-over-year growth 2022-2027 (%)
- 6.5 Market opportunity by Type
- Exhibit 42: Market opportunity by Type ($ billion)
- Exhibit 43: Data Table on Market opportunity by Type ($ billion)
7 Market Segmentation by Application
- 7.1 Market segments
- Exhibit 44: Chart on Application - Market share 2022-2027 (%)
- Exhibit 45: Data Table on Application - Market share 2022-2027 (%)
- 7.2 Comparison by Application
- Exhibit 46: Chart on Comparison by Application
- Exhibit 47: Data Table on Comparison by Application
- 7.3 Chemicals - Market size and forecast 2022-2027
- Exhibit 48: Chart on Chemicals - Market size and forecast 2022-2027 ($ billion)
- Exhibit 49: Data Table on Chemicals - Market size and forecast 2022-2027 ($ billion)
- Exhibit 50: Chart on Chemicals - Year-over-year growth 2022-2027 (%)
- Exhibit 51: Data Table on Chemicals - Year-over-year growth 2022-2027 (%)
- 7.4 Energy/fuel - Market size and forecast 2022-2027
- Exhibit 52: Chart on Energy/fuel - Market size and forecast 2022-2027 ($ billion)
- Exhibit 53: Data Table on Energy/fuel - Market size and forecast 2022-2027 ($ billion)
- Exhibit 54: Chart on Energy/fuel - Year-over-year growth 2022-2027 (%)
- Exhibit 55: Data Table on Energy/fuel - Year-over-year growth 2022-2027 (%)
- 7.5 Others - Market size and forecast 2022-2027
- Exhibit 56: Chart on Others - Market size and forecast 2022-2027 ($ billion)
- Exhibit 57: Data Table on Others - Market size and forecast 2022-2027 ($ billion)
- Exhibit 58: Chart on Others - Year-over-year growth 2022-2027 (%)
- Exhibit 59: Data Table on Others - Year-over-year growth 2022-2027 (%)
- 7.6 Market opportunity by Application
- Exhibit 60: Market opportunity by Application ($ billion)
- Exhibit 61: Data Table on Market opportunity by Application ($ billion)
8 Customer Landscape
- 8.1 Customer landscape overview
- Exhibit 62: Analysis of price sensitivity, lifecycle, customer purchase basket, adoption rates, and purchase criteria
9 Geographic Landscape
- 9.1 Geographic segmentation
- Exhibit 63: Chart on Market share by geography 2022-2027 (%)
- Exhibit 64: Data Table on Market share by geography 2022-2027 (%)
- 9.2 Geographic comparison
- Exhibit 65: Chart on Geographic comparison
- Exhibit 66: Data Table on Geographic comparison
- 9.3 APAC - Market size and forecast 2022-2027
- Exhibit 67: Chart on APAC - Market size and forecast 2022-2027 ($ billion)
- Exhibit 68: Data Table on APAC - Market size and forecast 2022-2027 ($ billion)
- Exhibit 69: Chart on APAC - Year-over-year growth 2022-2027 (%)
- Exhibit 70: Data Table on APAC - Year-over-year growth 2022-2027 (%)
- 9.4 North America - Market size and forecast 2022-2027
- Exhibit 71: Chart on North America - Market size and forecast 2022-2027 ($ billion)
- Exhibit 72: Data Table on North America - Market size and forecast 2022-2027 ($ billion)
- Exhibit 73: Chart on North America - Year-over-year growth 2022-2027 (%)
- Exhibit 74: Data Table on North America - Year-over-year growth 2022-2027 (%)
- 9.5 Europe - Market size and forecast 2022-2027
- Exhibit 75: Chart on Europe - Market size and forecast 2022-2027 ($ billion)
- Exhibit 76: Data Table on Europe - Market size and forecast 2022-2027 ($ billion)
- Exhibit 77: Chart on Europe - Year-over-year growth 2022-2027 (%)
- Exhibit 78: Data Table on Europe - Year-over-year growth 2022-2027 (%)
- 9.6 Middle East and Africa - Market size and forecast 2022-2027
- Exhibit 79: Chart on Middle East and Africa - Market size and forecast 2022-2027 ($ billion)
- Exhibit 80: Data Table on Middle East and Africa - Market size and forecast 2022-2027 ($ billion)
- Exhibit 81: Chart on Middle East and Africa - Year-over-year growth 2022-2027 (%)
- Exhibit 82: Data Table on Middle East and Africa - Year-over-year growth 2022-2027 (%)
- 9.7 South America - Market size and forecast 2022-2027
- Exhibit 83: Chart on South America - Market size and forecast 2022-2027 ($ billion)
- Exhibit 84: Data Table on South America - Market size and forecast 2022-2027 ($ billion)
- Exhibit 85: Chart on South America - Year-over-year growth 2022-2027 (%)
- Exhibit 86: Data Table on South America - Year-over-year growth 2022-2027 (%)
- 9.8 US - Market size and forecast 2022-2027
- Exhibit 87: Chart on US - Market size and forecast 2022-2027 ($ billion)
- Exhibit 88: Data Table on US - Market size and forecast 2022-2027 ($ billion)
- Exhibit 89: Chart on US - Year-over-year growth 2022-2027 (%)
- Exhibit 90: Data Table on US - Year-over-year growth 2022-2027 (%)
- 9.9 China - Market size and forecast 2022-2027
- Exhibit 91: Chart on China - Market size and forecast 2022-2027 ($ billion)
- Exhibit 92: Data Table on China - Market size and forecast 2022-2027 ($ billion)
- Exhibit 93: Chart on China - Year-over-year growth 2022-2027 (%)
- Exhibit 94: Data Table on China - Year-over-year growth 2022-2027 (%)
- 9.10 Germany - Market size and forecast 2022-2027
- Exhibit 95: Chart on Germany - Market size and forecast 2022-2027 ($ billion)
- Exhibit 96: Data Table on Germany - Market size and forecast 2022-2027 ($ billion)
- Exhibit 97: Chart on Germany - Year-over-year growth 2022-2027 (%)
- Exhibit 98: Data Table on Germany - Year-over-year growth 2022-2027 (%)
- 9.11 India - Market size and forecast 2022-2027
- Exhibit 99: Chart on India - Market size and forecast 2022-2027 ($ billion)
- Exhibit 100: Data Table on India - Market size and forecast 2022-2027 ($ billion)
- Exhibit 101: Chart on India - Year-over-year growth 2022-2027 (%)
- Exhibit 102: Data Table on India - Year-over-year growth 2022-2027 (%)
- 9.12 Japan - Market size and forecast 2022-2027
- Exhibit 103: Chart on Japan - Market size and forecast 2022-2027 ($ billion)
- Exhibit 104: Data Table on Japan - Market size and forecast 2022-2027 ($ billion)
- Exhibit 105: Chart on Japan - Year-over-year growth 2022-2027 (%)
- Exhibit 106: Data Table on Japan - Year-over-year growth 2022-2027 (%)
- 9.13 Market opportunity by geography
- Exhibit 107: Market opportunity by geography ($ billion)
- Exhibit 108: Data Tables on Market opportunity by geography ($ billion)
10 Drivers, Challenges, and Trends
- 10.1 Market drivers
- 10.2 Market challenges
- 10.3 Impact of drivers and challenges
- Exhibit 109: Impact of drivers and challenges in 2022 and 2027
- 10.4 Market trends
11 Vendor Landscape
- 11.1 Overview
- 11.2 Vendor landscape
- Exhibit 110: Overview on Criticality of inputs and Factors of differentiation
- 11.3 Landscape disruption
- Exhibit 111: Overview on factors of disruption
- 11.4 Industry risks
- Exhibit 112: Impact of key risks on business
12 Vendor Analysis
- 12.1 Vendors covered
- Exhibit 113: Vendors covered
- 12.2 Market positioning of vendors
- Exhibit 114: Matrix on vendor position and classification
- 12.3 2M Holdings Ltd.
- Exhibit 115: 2M Holdings Ltd. - Overview
- Exhibit 116: 2M Holdings Ltd. - Product / Service
- Exhibit 117: 2M Holdings Ltd. - Key offerings
- 12.4 Bajrang Petrochemicals Pvt. Ltd.
- Exhibit 118: Bajrang Petrochemicals Pvt. Ltd. - Overview
- Exhibit 119: Bajrang Petrochemicals Pvt. Ltd. - Product / Service
- Exhibit 120: Bajrang Petrochemicals Pvt. Ltd. - Key offerings
- 12.5 China Petrochemical Corp.
- Exhibit 121: China Petrochemical Corp. - Overview
- Exhibit 122: China Petrochemical Corp. - Business segments
- Exhibit 123: China Petrochemical Corp. - Key offerings
- Exhibit 124: China Petrochemical Corp. - Segment focus
- 12.6 Exxon Mobil Corp.
- Exhibit 125: Exxon Mobil Corp. - Overview
- Exhibit 126: Exxon Mobil Corp. - Business segments
- Exhibit 127: Exxon Mobil Corp. - Key offerings
- Exhibit 128: Exxon Mobil Corp. - Segment focus
- 12.7 Formosa Petrochemical Corp.
- Exhibit 129: Formosa Petrochemical Corp. - Overview
- Exhibit 130: Formosa Petrochemical Corp. - Product / Service
- Exhibit 131: Formosa Petrochemical Corp. - Key offerings
- 12.8 Ganga Rasayanie Pvt. Ltd.
- Exhibit 132: Ganga Rasayanie Pvt. Ltd. - Overview
- Exhibit 133: Ganga Rasayanie Pvt. Ltd. - Product / Service
- Exhibit 134: Ganga Rasayanie Pvt. Ltd. - Key offerings
- 12.9 Indian Oil Corp. Ltd.
- Exhibit 135: Indian Oil Corp. Ltd. - Overview
- Exhibit 136: Indian Oil Corp. Ltd. - Business segments
- Exhibit 137: Indian Oil Corp. Ltd. - Key offerings
- Exhibit 138: Indian Oil Corp. Ltd. - Segment focus
- 12.10 LG Chem Ltd.
- Exhibit 139: LG Chem Ltd. - Overview
- Exhibit 140: LG Chem Ltd. - Business segments
- Exhibit 141: LG Chem Ltd. - Key news
- Exhibit 142: LG Chem Ltd. - Key offerings
- Exhibit 143: LG Chem Ltd. - Segment focus
- 12.11 Mitsubishi Chemical Corp.
- Exhibit 144: Mitsubishi Chemical Corp. - Overview
- Exhibit 145: Mitsubishi Chemical Corp. - Business segments
- Exhibit 146: Mitsubishi Chemical Corp. - Key news
- Exhibit 147: Mitsubishi Chemical Corp. - Key offerings
- Exhibit 148: Mitsubishi Chemical Corp. - Segment focus
- 12.12 PAO NOVATEK
- Exhibit 149: PAO NOVATEK - Overview
- Exhibit 150: PAO NOVATEK - Product / Service
- Exhibit 151: PAO NOVATEK - Key offerings
- 12.13 Pyroplast Energy Ltd.
- Exhibit 152: Pyroplast Energy Ltd. - Overview
- Exhibit 153: Pyroplast Energy Ltd. - Product / Service
- Exhibit 154: Pyroplast Energy Ltd. - Key offerings
- 12.14 Reliance Industries Ltd.
- Exhibit 155: Reliance Industries Ltd. - Overview
- Exhibit 156: Reliance Industries Ltd. - Business segments
- Exhibit 157: Reliance Industries Ltd. - Key news
- Exhibit 158: Reliance Industries Ltd. - Key offerings
- Exhibit 159: Reliance Industries Ltd. - Segment focus
- 12.15 Saudi Arabian Oil Co.
- Exhibit 160: Saudi Arabian Oil Co. - Overview
- Exhibit 161: Saudi Arabian Oil Co. - Product / Service
- Exhibit 162: Saudi Arabian Oil Co. - Key offerings
- 12.16 Shell plc
- Exhibit 163: Shell plc - Overview
- Exhibit 164: Shell plc - Business segments
- Exhibit 165: Shell plc - Key offerings
- Exhibit 166: Shell plc - Segment focus
- 12.17 UPM Kymmene Corp.
- Exhibit 167: UPM Kymmene Corp. - Overview
- Exhibit 168: UPM Kymmene Corp. - Business segments
- Exhibit 169: UPM Kymmene Corp. - Key news
- Exhibit 170: UPM Kymmene Corp. - Key offerings
- Exhibit 171: UPM Kymmene Corp. - Segment focus
13 Appendix
- 13.1 Scope of the report
- 13.2 Inclusions and exclusions checklist
- Exhibit 172: Inclusions checklist
- Exhibit 173: Exclusions checklist
- 13.3 Currency conversion rates for US$
- Exhibit 174: Currency conversion rates for US$
- 13.4 Research methodology
- Exhibit 175: Research methodology
- Exhibit 176: Validation techniques employed for market sizing
- Exhibit 177: Information sources
- 13.5 List of abbreviations
- Exhibit 178: List of abbreviations
- in crude oil prices: The volatility of crude oil prices is one of the key challenges in the global commodity chemicals market. The volatility of crude oil prices impacts the pricing strategies and margins of adhesives, sealants, lubricants, oilfield cleaners, polymers, as well as plastic additives. The margins of the commodity chemicals are inherently dependent on the global prices of crude oil, which is one of the key raw materials. Any volatility in the prices of crude oil causes uncertainty in end-use markets and eventually influences the margins of all the key stakeholders, including the vendors in the global commodity chemicals market. These fluctuations adversely affect the profitability, cost of sales, and the ability of vendors to effectively address the demands of consumers.
Research Framework
Technavio presents a detailed picture of the market by way of study, synthesis, and summation of data from multiple sources. The analysts have presented the various facets of the market with a particular focus on identifying the key industry influencers. The data thus presented is comprehensive, reliable, and the result of extensive research, both primary and secondary.
INFORMATION SOURCES
Primary sources
- Manufacturers and suppliers
- Channel partners
- Industry experts
- Strategic decision makers
Secondary sources
- Industry journals and periodicals
- Government data
- Financial reports of key industry players
- Historical data
- Press releases
DATA ANALYSIS
Data Synthesis
- Collation of data
- Estimation of key figures
- Analysis of derived insights
Data Validation
- Triangulation with data models
- Reference against proprietary databases
- Corroboration with industry experts
REPORT WRITING
Qualitative
- Market drivers
- Market challenges
- Market trends
- Five forces analysis
Quantitative
- Market size and forecast
- Market segmentation
- Geographical insights
- Competitive landscape
PURCHASE FULL REPORT OF
naphtha market market
Key Questions Answered
- What are the key global market and the regional market share?
- What are the revenue-generating key market segments?
- What are the key factors driving and challenging this market’s growth?
- Who are the key market vendors and their growth strategies?
- What are the latest trends influencing the growth of this market?
- What are the variables influencing the market growth in the primary regions?
- What are the factors influencing the growth of the parent market?
Why should you prefer Technavio's market insights report?
- Off-the-shelf research reports
- Reports can be tailored to meet the customer's needs
- Trusted by more than 100 fortune 500 organizations
- Information about the market's key drivers, trends, and challenges
- Parent market analysis
- Every week, 50,000 people visit our subscription platform
- Detailed vendors report with competitive landscape
- Covid-19 impact and recovery analysis
- Data on revenue-generating market segments
- Details on the market shares of various regions
- Five-force market analysis