Natural Language Processing (NLP) Market - North America, Europe, EMEA, APAC : US, Canada, China, Germany, UK - Forecast 2023-2027
| Published: Oct 2023 | Pages: 166 | SKU: IRTNTR75680 |
Natural Language Processing Market by Component, Deployment and Geography - Forecast 2023-2027
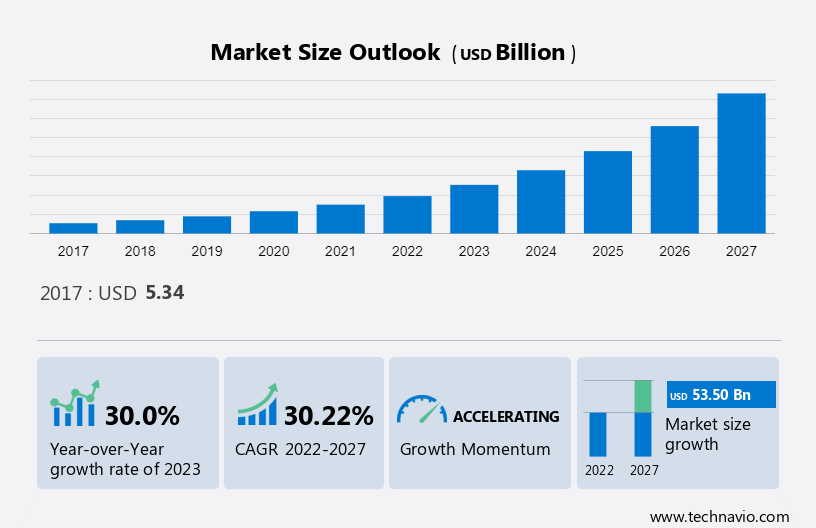
The natural language processing market size is forecast to increase by USD 53.50 billion between 2022 and 2027, accelerating at a CAGR of 30.22%. In 2017, the US held the largest market share, projecting an annual revenue of USD 1.33 billion. The report offers extensive research analysis on the Natural Language Processing Market, with a categorization based on Component, including Solution and Services. It further segments the market by Deployment, encompassing On-premises and Cloud. Additionally, the report provides geographical segmentation, covering North America, APAC, Europe, South America, and Middle East and Africa. Market size, historical data (2017-2021), and future projections are presented in terms of value (in USD billion) for all the mentioned segments.
What will be the Size of the Natural Language Processing Market During the Forecast Period?
To learn more about this report, Download Report Sample
Natural Language Processing Market Analysis
The growing demand for NLP applications is a key factor driving the market growth. The global NLP market is experiencing significant growth due to the rising demand for NLP applications in healthcare, e-commerce, and customer services. In healthcare, NLP assists in analyzing clinical notes, patient records, and medical literature for better diagnosis, treatment planning, and research. E-commerce platforms use NLP for improved user experiences, sales, and personalized suggestions. In customer services, NLP powers virtual assistants and chat systems, offering tailored interactions with customers. This growing adoption of NLP is driven by the desire to automate operations, enhance customer engagement, and improve decision-making in various sectors, leading to increased demand for NLP applications and fueling market growth.
Natural Language Processing Market Segment Trends
Deployment Segment Dominates the Market
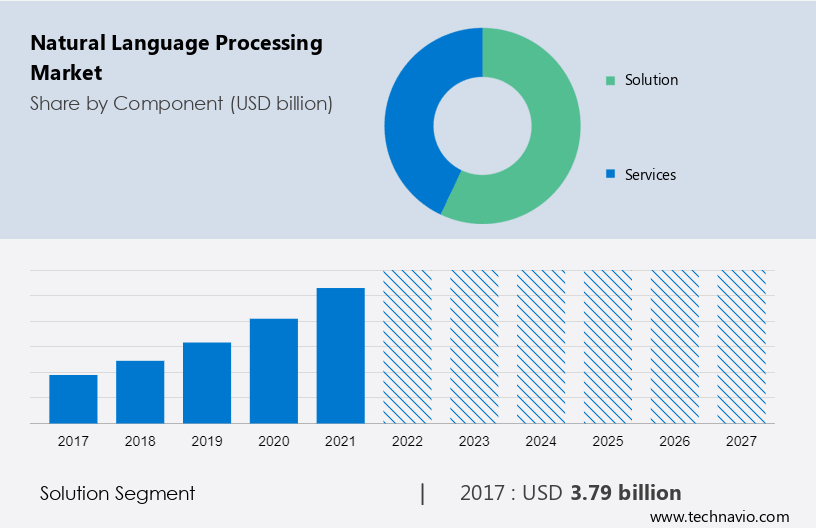
The deployment segment showed a gradual increase in the market share of USD 3.79 billion in 2017 and continued to grow by 2021. In 2022, the global NLP market saw a strong demand for on-premises deployment, which involves installing NLP systems within an organization's premises for better control, data privacy, and security. Businesses in sectors like finance, healthcare, and government opt for on-premises NLP due to regulatory compliance and data management needs. Despite the rising popularity of cloud-based solutions, on-premises deployment remains preferred by end-users, especially when data control and security are vital. This trend is expected to drive steady growth in the on-premises NLP deployment market and the overall market during the forecast period.
Natural Language Processing Market - Revenue Share by Deployment Segment, 2017 - 2027.
For more details on other segments, Download Sample Report
APAC Holds a Prominent Position in the Natural Language Processing Market
APAC is estimated to contribute 27% to the growth of the global market during the forecast period. The NLP market is expanding significantly in North America. Due to the dominance of the region in the global NLP market, many leading technology corporations and cutting-edge research institutions are headquartered in the region. Due to the presence of major industrial companies and the widespread use of NLP in a variety of industry verticals, including healthcare, banking, and customer services, the US, in particular, has a sizable market share. NLP solutions that provide enhanced language comprehension, sentiment analysis, and chatbot skills are in high demand globally, including in North America. The optimistic market outlook for NLP in North America is influenced by variables such as advances in technology, increased investments in artificial intelligence, and the growing demand for effective language processing in data-driven businesses.
Natural Language Processing Market Size, By Region, Global, 2017 - 2027.
To understand geographic trends Download Report Sample
Natural Language Processing Market Companies Overview
The Natural Language Processing Market is fragmented in nature. Some significant players include 3M Co., Alphabet Inc., Amazon.com Inc., Apple Inc., Baidu Inc.
The research report also includes detailed analyses of the competitive landscape of the market and information about 15 market companies, including:
Cerebras Systems Inc., Edifecs Inc., Hewlett Packard Enterprise Co., Inbenta Holdings Inc., International Business Machines Corp., IQVIA Inc., Liveperson Inc., Meta Platforms Inc., Microsoft Corp., NetBase Solutions Inc., OpenAI L.L.C., Oracle Corp., SAP SE, SAS Institute Inc., and SoundHound Inc.
Segment Overview
The natural language processing market report forecasts market growth by revenue at global, regional & country levels and provides an analysis of the latest trends and growth opportunities from 2017 - 2027.
- Component Outlook (USD Billion, 2017 - 2027)
- Solution
- Services
- Deployment Outlook (USD Billion, 2017 - 2027)
- On-premises
- Cloud
- Region Outlook (USD Billion, 2017 - 2027)
- North America
- The U.S.
- Canada
- Europe
- The U.K.
- Germany
- France
- Rest of Europe
- APAC
- China
- India
- Middle East & Africa
- Saudi Arabia
- South Africa
- Rest of the Middle East & Africa
- South America
- Chili
- Brazil
- Argentina
- North America
|
Natural Language Processing Market Scope |
|
|
Report Coverage |
Details |
|
Page number |
166 |
|
Base year |
2022 |
|
Historic period |
2017 - 2021 |
|
Forecast period |
2023-2027 |
|
Growth momentum & CAGR |
Accelerate at a CAGR of 30.22% |
|
Market growth 2023-2027 |
USD 53.50 billion |
|
Market structure |
Fragmented |
|
YoY growth 2022-2023(%) |
30.0 |
|
Regional analysis |
North America, APAC, Europe, South America, and Middle East and Africa |
|
Performing market contribution |
APAC at 27% |
|
Key countries |
US, China, India, Germany, and UK |
|
Competitive landscape |
Leading Companies, Market Positioning of Companies, Competitive Strategies, and Industry Risks |
|
Key companies profiled |
3M Co., Alphabet Inc., Amazon.com Inc., Apple Inc., Baidu Inc., Cerebras Systems Inc., Edifecs Inc., Hewlett Packard Enterprise Co., Inbenta Holdings Inc., International Business Machines Corp., IQVIA Inc., Liveperson Inc., Meta Platforms Inc., Microsoft Corp., NetBase Solutions Inc., OpenAI L.L.C., Oracle Corp., SAP SE, SAS Institute Inc., and SoundHound Inc. |
|
Market dynamics |
Parent market analysis, Market growth inducers and obstacles, Fast-growing and slow-growing segment analysis, COVID 19 impact and recovery analysis and future consumer dynamics, Market condition analysis for forecast period |
|
Customization purview |
If our report has not included the data that you are looking for, you can reach out to our analysts and get segments customized. |
What are the Key Data Covered in this Natural Language Processing Market Research Report?
- CAGR of the market during the forecast period
- Detailed information on factors that will drive the growth of the market between 2023 and 2027
- Precise estimation of the size of the market size and its contribution of the market in focus to the parent market
- Accurate predictions about upcoming trends and changes in consumer behaviour
- Growth of the market industry across North America, APAC, Europe, South America, and Middle East and Africa
- Thorough analysis of the market’s competitive landscape and detailed information about companies
- Comprehensive analysis of factors that will challenge the growth of market companies
We can help! Our analysts can customize this market research report to meet your requirements.
1 Executive Summary
- 1.1 Market overview
- Exhibit 01: Executive Summary – Chart on Market Overview
- Exhibit 02: Executive Summary – Data Table on Market Overview
- Exhibit 03: Executive Summary – Chart on Global Market Characteristics
- Exhibit 04: Executive Summary – Chart on Market by Geography
- Exhibit 05: Executive Summary – Chart on Market Segmentation by Component
- Exhibit 06: Executive Summary – Chart on Market Segmentation by Deployment
- Exhibit 07: Executive Summary – Chart on Incremental Growth
- Exhibit 08: Executive Summary – Data Table on Incremental Growth
- Exhibit 09: Executive Summary – Chart on Vendor Market Positioning
2 Market Landscape
- 2.1 Market ecosystem
- Exhibit 10: Parent market
- Exhibit 11: Market Characteristics
3 Market Sizing
- 3.1 Market definition
- Exhibit 12: Offerings of vendors included in the market definition
- 3.2 Market segment analysis
- Exhibit 13: Market segments
- 3.3 Market size 2022
- 3.4 Market outlook: Forecast for 2022-2027
- Exhibit 14: Chart on Global - Market size and forecast 2022-2027 ($ billion)
- Exhibit 15: Data Table on Global - Market size and forecast 2022-2027 ($ billion)
- Exhibit 16: Chart on Global Market: Year-over-year growth 2022-2027 (%)
- Exhibit 17: Data Table on Global Market: Year-over-year growth 2022-2027 (%)
4 Historic Market Size
- 4.1 Global natural language processing market 2017 - 2021
- Exhibit 18: Historic Market Size – Data Table on global natural language processing market 2017 - 2021 ($ billion)
- 4.2 Component Segment Analysis 2017 - 2021
- Exhibit 19: Historic Market Size – Component Segment 2017 - 2021 ($ billion)
- 4.3 Deployment Segment Analysis 2017 - 2021
- Exhibit 20: Historic Market Size – Deployment Segment 2017 - 2021 ($ billion)
- 4.4 Geography Segment Analysis 2017 - 2021
- Exhibit 21: Historic Market Size – Geography Segment 2017 - 2021 ($ billion)
- 4.5 Country Segment Analysis 2017 - 2021
- Exhibit 22: Historic Market Size – Country Segment 2017 - 2021 ($ billion)
5 Five Forces Analysis
- 5.1 Five forces summary
- Exhibit 23: Five forces analysis - Comparison between 2022 and 2027
- 5.2 Bargaining power of buyers
- Exhibit 24: Chart on Bargaining power of buyers – Impact of key factors 2022 and 2027
- 5.3 Bargaining power of suppliers
- Exhibit 25: Bargaining power of suppliers – Impact of key factors in 2022 and 2027
- 5.4 Threat of new entrants
- Exhibit 26: Threat of new entrants – Impact of key factors in 2022 and 2027
- 5.5 Threat of substitutes
- Exhibit 27: Threat of substitutes – Impact of key factors in 2022 and 2027
- 5.6 Threat of rivalry
- Exhibit 28: Threat of rivalry – Impact of key factors in 2022 and 2027
- 5.7 Market condition
- Exhibit 29: Chart on Market condition - Five forces 2022 and 2027
6 Market Segmentation by Component
- 6.1 Market segments
- Exhibit 30: Chart on Component - Market share 2022-2027 (%)
- Exhibit 31: Data Table on Component - Market share 2022-2027 (%)
- 6.2 Comparison by Component
- Exhibit 32: Chart on Comparison by Component
- Exhibit 33: Data Table on Comparison by Component
- 6.3 Solution - Market size and forecast 2022-2027
- Exhibit 34: Chart on Solution - Market size and forecast 2022-2027 ($ billion)
- Exhibit 35: Data Table on Solution - Market size and forecast 2022-2027 ($ billion)
- Exhibit 36: Chart on Solution - Year-over-year growth 2022-2027 (%)
- Exhibit 37: Data Table on Solution - Year-over-year growth 2022-2027 (%)
- 6.4 Services - Market size and forecast 2022-2027
- Exhibit 38: Chart on Services - Market size and forecast 2022-2027 ($ billion)
- Exhibit 39: Data Table on Services - Market size and forecast 2022-2027 ($ billion)
- Exhibit 40: Chart on Services - Year-over-year growth 2022-2027 (%)
- Exhibit 41: Data Table on Services - Year-over-year growth 2022-2027 (%)
- 6.5 Market opportunity by Component
- Exhibit 42: Market opportunity by Component ($ billion)
- Exhibit 43: Data Table on Market opportunity by Component ($ billion)
7 Market Segmentation by Deployment
- 7.1 Market segments
- Exhibit 44: Chart on Deployment - Market share 2022-2027 (%)
- Exhibit 45: Data Table on Deployment - Market share 2022-2027 (%)
- 7.2 Comparison by Deployment
- Exhibit 46: Chart on Comparison by Deployment
- Exhibit 47: Data Table on Comparison by Deployment
- 7.3 On-premises - Market size and forecast 2022-2027
- Exhibit 48: Chart on On-premises - Market size and forecast 2022-2027 ($ billion)
- Exhibit 49: Data Table on On-premises - Market size and forecast 2022-2027 ($ billion)
- Exhibit 50: Chart on On-premises - Year-over-year growth 2022-2027 (%)
- Exhibit 51: Data Table on On-premises - Year-over-year growth 2022-2027 (%)
- 7.4 Cloud - Market size and forecast 2022-2027
- Exhibit 52: Chart on Cloud - Market size and forecast 2022-2027 ($ billion)
- Exhibit 53: Data Table on Cloud - Market size and forecast 2022-2027 ($ billion)
- Exhibit 54: Chart on Cloud - Year-over-year growth 2022-2027 (%)
- Exhibit 55: Data Table on Cloud - Year-over-year growth 2022-2027 (%)
- 7.5 Market opportunity by Deployment
- Exhibit 56: Market opportunity by Deployment ($ billion)
- Exhibit 57: Data Table on Market opportunity by Deployment ($ billion)
8 Customer Landscape
- 8.1 Customer landscape overview
- Exhibit 58: Analysis of price sensitivity, lifecycle, customer purchase basket, adoption rates, and purchase criteria
9 Geographic Landscape
- 9.1 Geographic segmentation
- Exhibit 59: Chart on Market share by geography 2022-2027 (%)
- Exhibit 60: Data Table on Market share by geography 2022-2027 (%)
- 9.2 Geographic comparison
- Exhibit 61: Chart on Geographic comparison
- Exhibit 62: Data Table on Geographic comparison
- 9.3 North America - Market size and forecast 2022-2027
- Exhibit 63: Chart on North America - Market size and forecast 2022-2027 ($ billion)
- Exhibit 64: Data Table on North America - Market size and forecast 2022-2027 ($ billion)
- Exhibit 65: Chart on North America - Year-over-year growth 2022-2027 (%)
- Exhibit 66: Data Table on North America - Year-over-year growth 2022-2027 (%)
- 9.4 APAC - Market size and forecast 2022-2027
- Exhibit 67: Chart on APAC - Market size and forecast 2022-2027 ($ billion)
- Exhibit 68: Data Table on APAC - Market size and forecast 2022-2027 ($ billion)
- Exhibit 69: Chart on APAC - Year-over-year growth 2022-2027 (%)
- Exhibit 70: Data Table on APAC - Year-over-year growth 2022-2027 (%)
- 9.5 Europe - Market size and forecast 2022-2027
- Exhibit 71: Chart on Europe - Market size and forecast 2022-2027 ($ billion)
- Exhibit 72: Data Table on Europe - Market size and forecast 2022-2027 ($ billion)
- Exhibit 73: Chart on Europe - Year-over-year growth 2022-2027 (%)
- Exhibit 74: Data Table on Europe - Year-over-year growth 2022-2027 (%)
- 9.6 South America - Market size and forecast 2022-2027
- Exhibit 75: Chart on South America - Market size and forecast 2022-2027 ($ billion)
- Exhibit 76: Data Table on South America - Market size and forecast 2022-2027 ($ billion)
- Exhibit 77: Chart on South America - Year-over-year growth 2022-2027 (%)
- Exhibit 78: Data Table on South America - Year-over-year growth 2022-2027 (%)
- 9.7 Middle East and Africa - Market size and forecast 2022-2027
- Exhibit 79: Chart on Middle East and Africa - Market size and forecast 2022-2027 ($ billion)
- Exhibit 80: Data Table on Middle East and Africa - Market size and forecast 2022-2027 ($ billion)
- Exhibit 81: Chart on Middle East and Africa - Year-over-year growth 2022-2027 (%)
- Exhibit 82: Data Table on Middle East and Africa - Year-over-year growth 2022-2027 (%)
- 9.8 US - Market size and forecast 2022-2027
- Exhibit 83: Chart on US - Market size and forecast 2022-2027 ($ billion)
- Exhibit 84: Data Table on US - Market size and forecast 2022-2027 ($ billion)
- Exhibit 85: Chart on US - Year-over-year growth 2022-2027 (%)
- Exhibit 86: Data Table on US - Year-over-year growth 2022-2027 (%)
- 9.9 China - Market size and forecast 2022-2027
- Exhibit 87: Chart on China - Market size and forecast 2022-2027 ($ billion)
- Exhibit 88: Data Table on China - Market size and forecast 2022-2027 ($ billion)
- Exhibit 89: Chart on China - Year-over-year growth 2022-2027 (%)
- Exhibit 90: Data Table on China - Year-over-year growth 2022-2027 (%)
- 9.10 Germany - Market size and forecast 2022-2027
- Exhibit 91: Chart on Germany - Market size and forecast 2022-2027 ($ billion)
- Exhibit 92: Data Table on Germany - Market size and forecast 2022-2027 ($ billion)
- Exhibit 93: Chart on Germany - Year-over-year growth 2022-2027 (%)
- Exhibit 94: Data Table on Germany - Year-over-year growth 2022-2027 (%)
- 9.11 India - Market size and forecast 2022-2027
- Exhibit 95: Chart on India - Market size and forecast 2022-2027 ($ billion)
- Exhibit 96: Data Table on India - Market size and forecast 2022-2027 ($ billion)
- Exhibit 97: Chart on India - Year-over-year growth 2022-2027 (%)
- Exhibit 98: Data Table on India - Year-over-year growth 2022-2027 (%)
- 9.12 UK - Market size and forecast 2022-2027
- Exhibit 99: Chart on UK - Market size and forecast 2022-2027 ($ billion)
- Exhibit 100: Data Table on UK - Market size and forecast 2022-2027 ($ billion)
- Exhibit 101: Chart on UK - Year-over-year growth 2022-2027 (%)
- Exhibit 102: Data Table on UK - Year-over-year growth 2022-2027 (%)
- 9.13 Market opportunity by geography
- Exhibit 103: Market opportunity by geography ($ billion)
- Exhibit 104: Data Tables on Market opportunity by geography ($ billion)
10 Drivers, Challenges, and Trends
- 10.1 Market drivers
- 10.2 Market challenges
- 10.3 Impact of drivers and challenges
- Exhibit 105: Impact of drivers and challenges in 2022 and 2027
- 10.4 Market trends
11 Vendor Landscape
- 11.1 Overview
- 11.2 Vendor landscape
- Exhibit 106: Overview on Criticality of inputs and Factors of differentiation
- 11.3 Landscape disruption
- Exhibit 107: Overview on factors of disruption
- 11.4 Industry risks
- Exhibit 108: Impact of key risks on business
12 Vendor Analysis
- 12.1 Vendors covered
- Exhibit 109: Vendors covered
- 12.2 Market positioning of vendors
- Exhibit 110: Matrix on vendor position and classification
- 12.3 3M Co.
- Exhibit 111: 3M Co. - Overview
- Exhibit 112: 3M Co. - Business segments
- Exhibit 113: 3M Co. - Key news
- Exhibit 114: 3M Co. - Key offerings
- Exhibit 115: 3M Co. - Segment focus
- 12.4 Alphabet Inc.
- Exhibit 116: Alphabet Inc. - Overview
- Exhibit 117: Alphabet Inc. - Business segments
- Exhibit 118: Alphabet Inc. - Key news
- Exhibit 119: Alphabet Inc. - Key offerings
- Exhibit 120: Alphabet Inc. - Segment focus
- 12.5 Amazon.com Inc.
- Exhibit 121: Amazon.com Inc. - Overview
- Exhibit 122: Amazon.com Inc. - Business segments
- Exhibit 123: Amazon.com Inc. - Key news
- Exhibit 124: Amazon.com Inc. - Key offerings
- Exhibit 125: Amazon.com Inc. - Segment focus
- 12.6 Apple Inc.
- Exhibit 126: Apple Inc. - Overview
- Exhibit 127: Apple Inc. - Business segments
- Exhibit 128: Apple Inc. - Key news
- Exhibit 129: Apple Inc. - Key offerings
- Exhibit 130: Apple Inc. - Segment focus
- 12.7 Baidu Inc.
- Exhibit 131: Baidu Inc. - Overview
- Exhibit 132: Baidu Inc. - Business segments
- Exhibit 133: Baidu Inc. - Key offerings
- Exhibit 134: Baidu Inc. - Segment focus
- 12.8 Cerebras Systems Inc.
- Exhibit 135: Cerebras Systems Inc. - Overview
- Exhibit 136: Cerebras Systems Inc. - Product / Service
- Exhibit 137: Cerebras Systems Inc. - Key offerings
- 12.9 Hewlett Packard Enterprise Co.
- Exhibit 138: Hewlett Packard Enterprise Co. - Overview
- Exhibit 139: Hewlett Packard Enterprise Co. - Business segments
- Exhibit 140: Hewlett Packard Enterprise Co. - Key news
- Exhibit 141: Hewlett Packard Enterprise Co. - Key offerings
- Exhibit 142: Hewlett Packard Enterprise Co. - Segment focus
- 12.10 Inbenta Holdings Inc.
- Exhibit 143: Inbenta Holdings Inc. - Overview
- Exhibit 144: Inbenta Holdings Inc. - Product / Service
- Exhibit 145: Inbenta Holdings Inc. - Key offerings
- 12.11 International Business Machines Corp.
- Exhibit 146: International Business Machines Corp. - Overview
- Exhibit 147: International Business Machines Corp. - Business segments
- Exhibit 148: International Business Machines Corp. - Key news
- Exhibit 149: International Business Machines Corp. - Key offerings
- Exhibit 150: International Business Machines Corp. - Segment focus
- 12.12 IQVIA Inc.
- Exhibit 151: IQVIA Inc. - Overview
- Exhibit 152: IQVIA Inc. - Business segments
- Exhibit 153: IQVIA Inc. - Key news
- Exhibit 154: IQVIA Inc. - Key offerings
- Exhibit 155: IQVIA Inc. - Segment focus
- 12.13 Meta Platforms Inc.
- Exhibit 156: Meta Platforms Inc. - Overview
- Exhibit 157: Meta Platforms Inc. - Product / Service
- Exhibit 158: Meta Platforms Inc. - Key offerings
- 12.14 Microsoft Corp.
- Exhibit 159: Microsoft Corp. - Overview
- Exhibit 160: Microsoft Corp. - Business segments
- Exhibit 161: Microsoft Corp. - Key news
- Exhibit 162: Microsoft Corp. - Key offerings
- Exhibit 163: Microsoft Corp. - Segment focus
- 12.15 NetBase Solutions Inc.
- Exhibit 164: NetBase Solutions Inc. - Overview
- Exhibit 165: NetBase Solutions Inc. - Product / Service
- Exhibit 166: NetBase Solutions Inc. - Key offerings
- 12.16 Oracle Corp.
- Exhibit 167: Oracle Corp. - Overview
- Exhibit 168: Oracle Corp. - Business segments
- Exhibit 169: Oracle Corp. - Key news
- Exhibit 170: Oracle Corp. - Key offerings
- Exhibit 171: Oracle Corp. - Segment focus
- 12.17 SAS Institute Inc.
- Exhibit 172: SAS Institute Inc. - Overview
- Exhibit 173: SAS Institute Inc. - Product / Service
- Exhibit 174: SAS Institute Inc. - Key news
- Exhibit 175: SAS Institute Inc. - Key offerings
13 Appendix
- 13.1 Scope of the report
- 13.2 Inclusions and exclusions checklist
- Exhibit 176: Inclusions checklist
- Exhibit 177: Exclusions checklist
- 13.3 Currency conversion rates for US$
- Exhibit 178: Currency conversion rates for US$
- 13.4 Research methodology
- Exhibit 179: Research methodology
- Exhibit 180: Validation techniques employed for market sizing
- Exhibit 181: Information sources
- 13.5 List of abbreviations
- Exhibit 182: List of abbreviations
- development and management: They include systems software that is used for developing, testing, deploying, and managing enterprise applications. Application development and management include the following solutions:
Research Framework
Technavio presents a detailed picture of the market by way of study, synthesis, and summation of data from multiple sources. The analysts have presented the various facets of the market with a particular focus on identifying the key industry influencers. The data thus presented is comprehensive, reliable, and the result of extensive research, both primary and secondary.
INFORMATION SOURCES
Primary sources
- Manufacturers and suppliers
- Channel partners
- Industry experts
- Strategic decision makers
Secondary sources
- Industry journals and periodicals
- Government data
- Financial reports of key industry players
- Historical data
- Press releases
DATA ANALYSIS
Data Synthesis
- Collation of data
- Estimation of key figures
- Analysis of derived insights
Data Validation
- Triangulation with data models
- Reference against proprietary databases
- Corroboration with industry experts
REPORT WRITING
Qualitative
- Market drivers
- Market challenges
- Market trends
- Five forces analysis
Quantitative
- Market size and forecast
- Market segmentation
- Geographical insights
- Competitive landscape
PURCHASE FULL REPORT OF
natural language processing market market
Key Questions Answered
- What are the key global market and the regional market share?
- What are the revenue-generating key market segments?
- What are the key factors driving and challenging this market’s growth?
- Who are the key market vendors and their growth strategies?
- What are the latest trends influencing the growth of this market?
- What are the variables influencing the market growth in the primary regions?
- What are the factors influencing the growth of the parent market?
Why should you prefer Technavio's market insights report?
- Off-the-shelf research reports
- Reports can be tailored to meet the customer's needs
- Trusted by more than 100 fortune 500 organizations
- Information about the market's key drivers, trends, and challenges
- Parent market analysis
- Every week, 50,000 people visit our subscription platform
- Detailed vendors report with competitive landscape
- Covid-19 impact and recovery analysis
- Data on revenue-generating market segments
- Details on the market shares of various regions
- Five-force market analysis