Plant-based Meat Market by Foodservice System, Type, and Geography- Forecast and Analysis 2023-2027
| Published: Dec 2022 | Pages: 162 | SKU: IRTNTR40724 |
Plant-based Meat Market Forecast 2023- 2027
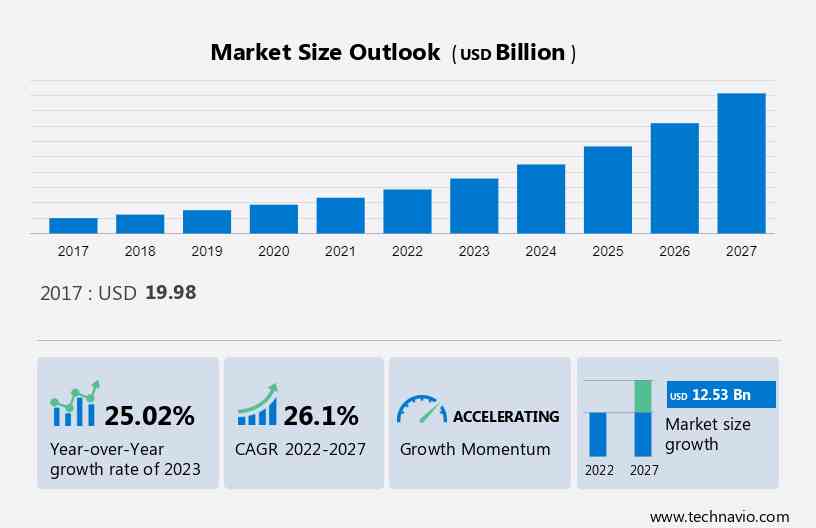
The Plant-based Meat Market is projected to increase by USD 12.53 billion and the market size is estimated to grow at a CAGR of 26.1% between 2022 and 2027.
The new product launches are notably driving the market growth. Due to the growing health awareness of consumers and environmental concerns, the demand for products is increasing. Animal meat production causes a significant amount of greenhouse gases. For example, for every gram of beef produced, 221 grams of carbon dioxide are released.To meet the growing demand for products, vendors around the world are launching new products. Successful new product launches increase suppliers' revenue streams and market share. One such new product launch includes two new iterations of its plant-based burger, with one version offering a more meaty experience and the other being a more nutritious version of its burger, by Beyond Meat. Such factors will drive the market growth during the forecast period. It also includes an in-depth analysis of drivers, trends, and challenges.
Plant-based Meat Market: Overview
To get additional information about the market, Request Free Sample
Major Trends
Changing consumer demographics is an emerging trend in the market. The growing health consciousness of consumers is increasing the demand for healthier food and beverages. In recent years, the incidence of chronic health problems such as diabetes, indigestion, allergies, and obesity has increased among consumers worldwide. Therefore, people have become health conscious and want to follow a healthier diet that prevents or reduces the risks of these diseases.
A health-conscious population is looking for foods that contain fewer calories but the right combination of essential nutrients. Thus, the growing popularity of healthy eating has increased the demand for healthy food ingredients, which is expected to drive the growth of the global market during the forecast period.
Significant Challenge
Increasing consumption of animal meat is a major challenge impeding market growth. Consumption of animal meat and related products is expected to increase during the forecast period due to population growth, an increase in disposable income, and an increase in demand for protein-rich foods. Consumption of meat such as pork, beef, and chicken is increasing in several countries such as the United States, China, India, and Russia.
In quantitative terms, the US was the largest beef market in 2020. Beef consumption in the US grew significantly between 2019 and 2020. Quantitatively, chicken consumption increased by more than 2% in the United States and 1% in China in 2019-2020. Thus, increasing consumption of animal meat products will negatively affect the growth of the global market during the forecast period.
Market Segmentation by Food Services System
Frozen Based - Freezing is an excellent method to preserve animal products like meat, extending their shelf life and providing nutritional benefits to consumers. The increasing demand for protein-rich diets is driving the popularity of frozen meat products. Vendors are responding to this demand by expanding their production facilities and introducing new frozen meat product lines. For example, Continental Coffee, ltd. launched its plant-based frozen meat brand Continental Greenbird, featuring various chicken and mutton-like products. These expansions are expected to boost sales and drive market growth in the forecast period.
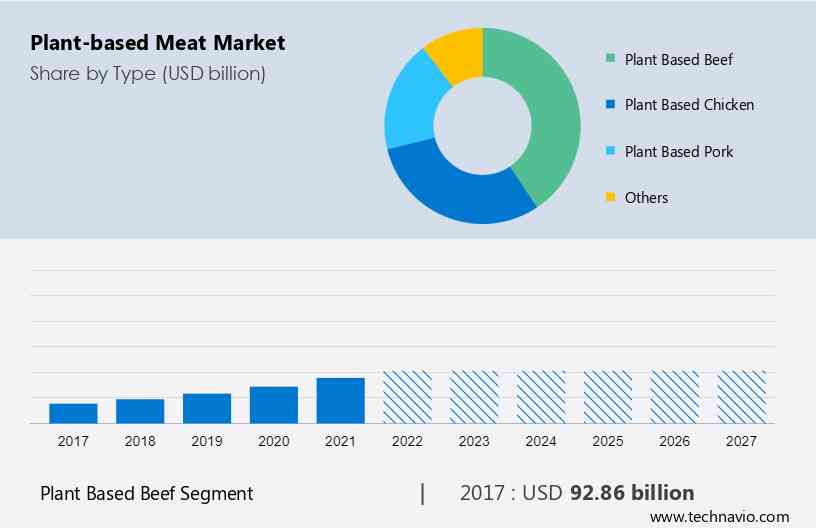
Market Segmentation by Type
The demand for plant-based protein products, including plant-based beef, is on the rise due to growing health consciousness among consumers. Vendors are launching new plant-based beef products to meet this demand. For instance, Beyond Meat introduced its Beyond Steak plant-based beef, and Nestle collaborated with Nomoo to develop vegan beef products. However, competition from traditional beef and cell-based meat products may pose challenges to the segment's growth. Nevertheless, the increasing launch of new plant-based beef products is expected to drive growth during the forecast period.
The Plant-Based Beef Segment was valued at USD 92.86 Billion in 2017 and continued to grow until 2021.
For a detailed summary of the market segments Request for Sample Report
The rise in health consciousness among consumers will boost the demand for plant-based food products, especially plant-based chicken products, in the forecast period. Additionally, the segment will witness growth due to new product introductions and increased investments from vendors. Kellogg Co. launched plant-based chicken tenders and nuggets in September 2020, reflecting the industry's interest. Major players in the food and beverage industry are actively entering the global market and investing in vendors.
Key Regions for the Market
North America is estimated to contribute 41% to the growth of the global market during the forecast period
Get a glance at the market share of various regions View PDF Sample
Technavio’s analysts have elaborately explained the regional market trends and drivers that shape the market during the forecast period.
The demand for these products is increasing among consumers in North America, owing to their health consciousness and growing concern about the environmental impacts of production. The increasing number of new product launches, investments, and the popularity of these products among millennials will also drive the growth of the market in North America during the forecast period.
Vendors are coming up with new products to meet the rising demand from consumers. Vendors operating in the market in North America are partnering with major fast-food chains and quick-service restaurants to launch their products. Thus, the increasing number of new product launches and the formation of new strategic partnerships will drive the growth of the market in North America during the forecast period.
The market in North America was challenged by the spread of COVID-19 in 2020. However in 2021, with the initiation of the vaccination drives, lifting of lockdowns, and other restrictions the supply chain of the market has been restored, and the demand for the product gradually increased due to the sales of frozen and refrigerated products from online channels in the region. This is expected to support the growth of the regional market during the forecast period.
Plant-based Meat Market Company Overview
Companies are implementing various strategies, such as strategic alliances, partnerships, mergers and acquisitions, geographical expansion, and product/service launches, to enhance their presence in the market.
- Albertsons Co. Inc - The company offers grocery products, general merchandise, health and beauty care products, pharmacy, fuel, and other items and services in stores or through digital channels. The key offerings of the company include various plant-based meat
The market report also includes detailed analyses of the competitive landscape of the market and information about 15 market companies, including:
- Albertsons Co. Inc
- Beyond Meat Inc.
- Conagra Brands Inc.
- Ecozone
- Gathered Foods Corp.
- Green Monday
- Hormel Foods Corp.
- Impossible Foods Inc.
- Jensen Meat Co.
- Kellogg Co
- Kerry Group Plc
- Kroger Co.
- Maple Leaf Foods Inc.
- Monde Nissin Corp.
- Nestle SA
- New Wave Foods
- The Kraft Heinz Co.
- The Tofurky Co. Inc.
- Tyson Foods Inc.
- Unilever PLC
Qualitative and quantitative market growth and forecasting of companies has been conducted to help clients understand the wider business environment as well as the strengths and weaknesses of key market players. Data is qualitatively analyzed to categorize companies as pure play, category-focused, industry-focused, and diversified; it is quantitatively analyzed to categorize companies as dominant, leading, strong, tentative, and weak.
Segment Overview
The market report forecasts market growth by revenue at global, regional & country levels and provides market trends and analysis and growth opportunities from 2017 to 2027.
- Foodservice System Outlook (USD Billion, 2017 - 2027)
- Frozen
- Refrigerated
- Shelf-stable
- Type Outlook (USD Billion, 2017 - 2027)
- Plant-based beef
- Plant-based chicken
- Plant-based pork
- Others
- Region Outlook (USD Billion, 2017 - 2027)
- North America
- The U.S.
- Canada
- Europe
- The U.K.
- Germany
- France
- Rest of Europe
- APAC
- China
- India
- Middle East & Africa
- Saudi Arabia
- South Africa
- Rest of the Middle East & Africa
- South America
- Chile
- Brazil
- North America
Market Analyst Overview
The market is driven by growing consumer interest in vegan diets and vegetarian lifestyles, supported by concerns for animal rights and the environment. Key ingredients like soy, known for its high protein content and essential amino acids, are crucial for the human body, aiding in muscle mass development and offering benefits like water absorption, solubility, and emulsification.
Plant-based alternatives offer similar texture and aroma to animal-based products, enhancing their appeal. Products like refrigerated plant-based meat and pea-based patties cater to different segments, including chilled and ambient, addressing concerns over meat shortages and food sustainability. The market emphasizes the health benefits of a vegan diet, highlighting nutritious profiles with added fiber, Vitamin C, and other essential nutrients. Despite challenges like carbon footprint and concerns over genetically modified forms, the plant-based meat market is witnessing rapid growth, driven by increasing demand for sustainable and ethical food choices.
|
Plant-based Meat Market Scope |
|
|
Report Coverage |
Details |
|
Page number |
162 |
|
Base year |
2022 |
|
Historic period |
2017-2021 |
|
Forecast period |
2023-2027 |
|
Growth momentum & CAGR |
Accelerate at a CAGR of 26.1% |
|
Market growth 2023-2027 |
USD 12.53 billion |
|
Market structure |
USD Fragmented |
|
YoY growth 2022-2023(%) |
25.02 |
|
Regional analysis |
North America, Europe, APAC, South America, and Middle East and Africa |
|
Performing market contribution |
North America at 41% |
|
Key countries |
US, UK, Germany, Italy, and France |
|
Competitive landscape |
Leading Companies, Market Positioning of Companies, Competitive Strategies, and Industry Risks |
|
Key companies profiled |
Albertsons Co. Inc, Beyond Meat Inc., Conagra Brands Inc., Ecozone, Gathered Foods Corp., Green Monday, Hormel Foods Corp., Impossible Foods Inc., Jensen Meat Co., Kellogg Co, Kerry Group Plc, Kroger Co., Maple Leaf Foods Inc., Monde Nissin Corp., Nestle SA, New Wave Foods, The Kraft Heinz Co., The Tofurky Co. Inc., Tyson Foods Inc., and Unilever PLC |
|
Market dynamics |
Parent market analysis, Market forecasting, Market growth inducers and obstacles, Fast-growing and slow-growing segment analysis, COVID-19 impact and recovery analysis and future consumer dynamics, market growth analysis for the market forecast period. |
|
Customization purview |
If our report has not included the data that you are looking for, you can reach out to our analysts and get segments customized. |
BUY NOW Full Report and Discover more
What are the Key Data Covered in this Market Research Report?
- CAGR of the market during the forecast period
- Detailed information on factors that will drive the growth of the market between 2023 and 2027
- Precise estimation of the size of the market size and its contribution of the market in focus to the parent market
- Accurate predictions about market growth and trends and changes in consumer behavior
- market research and growth across North America, Europe, APAC, South America, and Middle East and Africa
- Thorough analysis of the market’s competitive landscape and detailed information about companies
- Comprehensive market analysis and report on the factors that will challenge the growth of market companies
We can help! Our analysts can customize this market research report to meet your requirements. Get in touch
1 Executive Summary
- 1.1 Market overview
- Exhibit 01: Executive Summary – Chart on Market Overview
- Exhibit 02: Executive Summary – Data Table on Market Overview
- Exhibit 03: Executive Summary – Chart on Global Market Characteristics
- Exhibit 04: Executive Summary – Chart on Market by Geography
- Exhibit 05: Executive Summary – Chart on Market Segmentation by Foodservice System
- Exhibit 06: Executive Summary – Chart on Market Segmentation by Type
- Exhibit 07: Executive Summary – Chart on Incremental Growth
- Exhibit 08: Executive Summary – Data Table on Incremental Growth
- Exhibit 09: Executive Summary – Chart on Vendor Market Positioning
2 Market Landscape
- 2.1 Market ecosystem
- Exhibit 10: Parent market
- Exhibit 11: Market Characteristics
3 Market Sizing
- 3.1 Market definition
- Exhibit 12: Offerings of vendors included in the market definition
- 3.2 Market segment analysis
- Exhibit 13: Market segments
- 3.3 Market size 2022
- 3.4 Market outlook: Forecast for 2022-2027
- Exhibit 14: Chart on Global - Market size and forecast 2022-2027 ($ billion)
- Exhibit 15: Data Table on Global - Market size and forecast 2022-2027 ($ billion)
- Exhibit 16: Chart on Global Market: Year-over-year growth 2022-2027 (%)
- Exhibit 17: Data Table on Global Market: Year-over-year growth 2022-2027 (%)
4 Historic Market Size
- 4.1 Global plant-based meat market 2017 - 2021
- Exhibit 18: Historic Market Size – Data Table on Global plant-based meat market 2017 - 2021 ($ billion)
- 4.2 By Foodservice System Segment Analysis 2017 - 2021
- Exhibit 19: Historic Market Size – By Foodservice System Segment 2017 - 2021 ($ billion)
- 4.3 By Type Segment Analysis 2017 - 2021
- Exhibit 20: Historic Market Size – By Type Segment 2017 - 2021 ($ billion)
- 4.4 Geography Segment Analysis 2017 - 2021
- Exhibit 21: Historic Market Size – Geography Segment 2017 - 2021 ($ billion)
- 4.5 Country Segment Analysis 2017 - 2021
- Exhibit 22: Historic Market Size – Country Segment 2017 - 2021 ($ billion)
5 Five Forces Analysis
- 5.1 Five forces summary
- Exhibit 23: Five forces analysis - Comparison between 2022 and 2027
- 5.2 Bargaining power of buyers
- Exhibit 24: Chart on Bargaining power of buyers – Impact of key factors 2022 and 2027
- 5.3 Bargaining power of suppliers
- Exhibit 25: Bargaining power of suppliers – Impact of key factors in 2022 and 2027
- 5.4 Threat of new entrants
- Exhibit 26: Threat of new entrants – Impact of key factors in 2022 and 2027
- 5.5 Threat of substitutes
- Exhibit 27: Threat of substitutes – Impact of key factors in 2022 and 2027
- 5.6 Threat of rivalry
- Exhibit 28: Threat of rivalry – Impact of key factors in 2022 and 2027
- 5.7 Market condition
- Exhibit 29: Chart on Market condition - Five forces 2022 and 2027
6 Market Segmentation by Foodservice System
- 6.1 Market segments
- Exhibit 30: Chart on Foodservice System - Market share 2022-2027 (%)
- Exhibit 31: Data Table on Foodservice System - Market share 2022-2027 (%)
- 6.2 Comparison by Foodservice System
- Exhibit 32: Chart on Comparison by Foodservice System
- Exhibit 33: Data Table on Comparison by Foodservice System
- 6.3 Frozen - Market size and forecast 2022-2027
- Exhibit 34: Chart on Frozen - Market size and forecast 2022-2027 ($ billion)
- Exhibit 35: Data Table on Frozen - Market size and forecast 2022-2027 ($ billion)
- Exhibit 36: Chart on Frozen - Year-over-year growth 2022-2027 (%)
- Exhibit 37: Data Table on Frozen - Year-over-year growth 2022-2027 (%)
- 6.4 Refrigerated - Market size and forecast 2022-2027
- Exhibit 38: Chart on Refrigerated - Market size and forecast 2022-2027 ($ billion)
- Exhibit 39: Data Table on Refrigerated - Market size and forecast 2022-2027 ($ billion)
- Exhibit 40: Chart on Refrigerated - Year-over-year growth 2022-2027 (%)
- Exhibit 41: Data Table on Refrigerated - Year-over-year growth 2022-2027 (%)
- 6.5 Shelf-stable - Market size and forecast 2022-2027
- Exhibit 42: Chart on Shelf-stable - Market size and forecast 2022-2027 ($ billion)
- Exhibit 43: Data Table on Shelf-stable - Market size and forecast 2022-2027 ($ billion)
- Exhibit 44: Chart on Shelf-stable - Year-over-year growth 2022-2027 (%)
- Exhibit 45: Data Table on Shelf-stable - Year-over-year growth 2022-2027 (%)
- 6.6 Market opportunity by Foodservice System
- Exhibit 46: Market opportunity by Foodservice System ($ billion)
7 Market Segmentation by Type
- 7.1 Market segments
- Exhibit 47: Chart on Type - Market share 2022-2027 (%)
- Exhibit 48: Data Table on Type - Market share 2022-2027 (%)
- 7.2 Comparison by Type
- Exhibit 49: Chart on Comparison by Type
- Exhibit 50: Data Table on Comparison by Type
- 7.3 Plant based beef - Market size and forecast 2022-2027
- Exhibit 51: Chart on Plant based beef - Market size and forecast 2022-2027 ($ billion)
- Exhibit 52: Data Table on Plant based beef - Market size and forecast 2022-2027 ($ billion)
- Exhibit 53: Chart on Plant based beef - Year-over-year growth 2022-2027 (%)
- Exhibit 54: Data Table on Plant based beef - Year-over-year growth 2022-2027 (%)
- 7.4 Plant based chicken - Market size and forecast 2022-2027
- Exhibit 55: Chart on Plant based chicken - Market size and forecast 2022-2027 ($ billion)
- Exhibit 56: Data Table on Plant based chicken - Market size and forecast 2022-2027 ($ billion)
- Exhibit 57: Chart on Plant based chicken - Year-over-year growth 2022-2027 (%)
- Exhibit 58: Data Table on Plant based chicken - Year-over-year growth 2022-2027 (%)
- 7.5 Plant based pork - Market size and forecast 2022-2027
- Exhibit 59: Chart on Plant based pork - Market size and forecast 2022-2027 ($ billion)
- Exhibit 60: Data Table on Plant based pork - Market size and forecast 2022-2027 ($ billion)
- Exhibit 61: Chart on Plant based pork - Year-over-year growth 2022-2027 (%)
- Exhibit 62: Data Table on Plant based pork - Year-over-year growth 2022-2027 (%)
- 7.6 Others - Market size and forecast 2022-2027
- Exhibit 63: Chart on Others - Market size and forecast 2022-2027 ($ billion)
- Exhibit 64: Data Table on Others - Market size and forecast 2022-2027 ($ billion)
- Exhibit 65: Chart on Others - Year-over-year growth 2022-2027 (%)
- Exhibit 66: Data Table on Others - Year-over-year growth 2022-2027 (%)
- 7.7 Market opportunity by Type
- Exhibit 67: Market opportunity by Type ($ billion)
8 Customer Landscape
- 8.1 Customer landscape overview
- Exhibit 68: Analysis of price sensitivity, lifecycle, customer purchase basket, adoption rates, and purchase criteria
9 Geographic Landscape
- 9.1 Geographic segmentation
- Exhibit 69: Chart on Market share by geography 2022-2027 (%)
- Exhibit 70: Data Table on Market share by geography 2022-2027 (%)
- 9.2 Geographic comparison
- Exhibit 71: Chart on Geographic comparison
- Exhibit 72: Data Table on Geographic comparison
- 9.3 North America - Market size and forecast 2022-2027
- Exhibit 73: Chart on North America - Market size and forecast 2022-2027 ($ billion)
- Exhibit 74: Data Table on North America - Market size and forecast 2022-2027 ($ billion)
- Exhibit 75: Chart on North America - Year-over-year growth 2022-2027 (%)
- Exhibit 76: Data Table on North America - Year-over-year growth 2022-2027 (%)
- 9.4 Europe - Market size and forecast 2022-2027
- Exhibit 77: Chart on Europe - Market size and forecast 2022-2027 ($ billion)
- Exhibit 78: Data Table on Europe - Market size and forecast 2022-2027 ($ billion)
- Exhibit 79: Chart on Europe - Year-over-year growth 2022-2027 (%)
- Exhibit 80: Data Table on Europe - Year-over-year growth 2022-2027 (%)
- 9.5 APAC - Market size and forecast 2022-2027
- Exhibit 81: Chart on APAC - Market size and forecast 2022-2027 ($ billion)
- Exhibit 82: Data Table on APAC - Market size and forecast 2022-2027 ($ billion)
- Exhibit 83: Chart on APAC - Year-over-year growth 2022-2027 (%)
- Exhibit 84: Data Table on APAC - Year-over-year growth 2022-2027 (%)
- 9.6 South America - Market size and forecast 2022-2027
- Exhibit 85: Chart on South America - Market size and forecast 2022-2027 ($ billion)
- Exhibit 86: Data Table on South America - Market size and forecast 2022-2027 ($ billion)
- Exhibit 87: Chart on South America - Year-over-year growth 2022-2027 (%)
- Exhibit 88: Data Table on South America - Year-over-year growth 2022-2027 (%)
- 9.7 Middle East and Africa - Market size and forecast 2022-2027
- Exhibit 89: Chart on Middle East and Africa - Market size and forecast 2022-2027 ($ billion)
- Exhibit 90: Data Table on Middle East and Africa - Market size and forecast 2022-2027 ($ billion)
- Exhibit 91: Chart on Middle East and Africa - Year-over-year growth 2022-2027 (%)
- Exhibit 92: Data Table on Middle East and Africa - Year-over-year growth 2022-2027 (%)
- 9.8 US - Market size and forecast 2022-2027
- Exhibit 93: Chart on US - Market size and forecast 2022-2027 ($ billion)
- Exhibit 94: Data Table on US - Market size and forecast 2022-2027 ($ billion)
- Exhibit 95: Chart on US - Year-over-year growth 2022-2027 (%)
- Exhibit 96: Data Table on US - Year-over-year growth 2022-2027 (%)
- 9.9 UK - Market size and forecast 2022-2027
- Exhibit 97: Chart on UK - Market size and forecast 2022-2027 ($ billion)
- Exhibit 98: Data Table on UK - Market size and forecast 2022-2027 ($ billion)
- Exhibit 99: Chart on UK - Year-over-year growth 2022-2027 (%)
- Exhibit 100: Data Table on UK - Year-over-year growth 2022-2027 (%)
- 9.10 Germany - Market size and forecast 2022-2027
- Exhibit 101: Chart on Germany - Market size and forecast 2022-2027 ($ billion)
- Exhibit 102: Data Table on Germany - Market size and forecast 2022-2027 ($ billion)
- Exhibit 103: Chart on Germany - Year-over-year growth 2022-2027 (%)
- Exhibit 104: Data Table on Germany - Year-over-year growth 2022-2027 (%)
- 9.11 Italy - Market size and forecast 2022-2027
- Exhibit 105: Chart on Italy - Market size and forecast 2022-2027 ($ billion)
- Exhibit 106: Data Table on Italy - Market size and forecast 2022-2027 ($ billion)
- Exhibit 107: Chart on Italy - Year-over-year growth 2022-2027 (%)
- Exhibit 108: Data Table on Italy - Year-over-year growth 2022-2027 (%)
- 9.12 France - Market size and forecast 2022-2027
- Exhibit 109: Chart on France - Market size and forecast 2022-2027 ($ billion)
- Exhibit 110: Data Table on France - Market size and forecast 2022-2027 ($ billion)
- Exhibit 111: Chart on France - Year-over-year growth 2022-2027 (%)
- Exhibit 112: Data Table on France - Year-over-year growth 2022-2027 (%)
- 9.13 Market opportunity by geography
- Exhibit 113: Market opportunity by geography ($ billion)
10 Drivers, Challenges, and Trends
- 10.1 Market drivers
- 10.2 Market challenges
- 10.3 Impact of drivers and challenges
- Exhibit 114: Impact of drivers and challenges in 2022 and 2027
- 10.4 Market trends
11 Vendor Landscape
- 11.1 Overview
- 11.2 Vendor landscape
- Exhibit 115: Overview on Criticality of inputs and Factors of differentiation
- 11.3 Landscape disruption
- Exhibit 116: Overview on factors of disruption
- 11.4 Industry risks
- Exhibit 117: Impact of key risks on business
12 Vendor Analysis
- 12.1 Vendors covered
- Exhibit 118: Vendors covered
- 12.2 Market positioning of vendors
- Exhibit 119: Matrix on vendor position and classification
- 12.3 Albertsons Co. Inc
- Exhibit 120: Albertsons Co. Inc - Overview
- Exhibit 121: Albertsons Co. Inc - Product / Service
- Exhibit 122: Albertsons Co. Inc - Key offerings
- 12.4 Beyond Meat Inc.
- Exhibit 123: Beyond Meat Inc. - Overview
- Exhibit 124: Beyond Meat Inc. - Product / Service
- Exhibit 125: Beyond Meat Inc. - Key offerings
- 12.5 Conagra Brands Inc.
- Exhibit 126: Conagra Brands Inc. - Overview
- Exhibit 127: Conagra Brands Inc. - Business segments
- Exhibit 128: Conagra Brands Inc. - Key news
- Exhibit 129: Conagra Brands Inc. - Key offerings
- Exhibit 130: Conagra Brands Inc. - Segment focus
- 12.6 Ecozone
- Exhibit 131: Ecozone - Overview
- Exhibit 132: Ecozone - Product / Service
- Exhibit 133: Ecozone - Key offerings
- 12.7 Gathered Foods Corp.
- Exhibit 134: Gathered Foods Corp. - Overview
- Exhibit 135: Gathered Foods Corp. - Product / Service
- Exhibit 136: Gathered Foods Corp. - Key offerings
- 12.8 Green Monday
- Exhibit 137: Green Monday - Overview
- Exhibit 138: Green Monday - Product / Service
- Exhibit 139: Green Monday - Key offerings
- 12.9 Hormel Foods Corp.
- Exhibit 140: Hormel Foods Corp. - Overview
- Exhibit 141: Hormel Foods Corp. - Business segments
- Exhibit 142: Hormel Foods Corp. - Key news
- Exhibit 143: Hormel Foods Corp. - Key offerings
- Exhibit 144: Hormel Foods Corp. - Segment focus
- 12.10 Impossible Foods Inc.
- Exhibit 145: Impossible Foods Inc. - Overview
- Exhibit 146: Impossible Foods Inc. - Product / Service
- Exhibit 147: Impossible Foods Inc. - Key offerings
- 12.11 Jensen Meat Co.
- Exhibit 148: Jensen Meat Co. - Overview
- Exhibit 149: Jensen Meat Co. - Product / Service
- Exhibit 150: Jensen Meat Co. - Key offerings
- 12.12 Kellogg Co
- Exhibit 151: Kellogg Co - Overview
- Exhibit 152: Kellogg Co - Business segments
- Exhibit 153: Kellogg Co - Key news
- Exhibit 154: Kellogg Co - Key offerings
- Exhibit 155: Kellogg Co - Segment focus
- 12.13 Kerry Group Plc
- Exhibit 156: Kerry Group Plc - Overview
- Exhibit 157: Kerry Group Plc - Business segments
- Exhibit 158: Kerry Group Plc - Key offerings
- Exhibit 159: Kerry Group Plc - Segment focus
- 12.14 Maple Leaf Foods Inc.
- Exhibit 160: Maple Leaf Foods Inc. - Overview
- Exhibit 161: Maple Leaf Foods Inc. - Business segments
- Exhibit 162: Maple Leaf Foods Inc. - Key offerings
- Exhibit 163: Maple Leaf Foods Inc. - Segment focus
- 12.15 Monde Nissin Corp.
- Exhibit 164: Monde Nissin Corp. - Overview
- Exhibit 165: Monde Nissin Corp. - Product / Service
- Exhibit 166: Monde Nissin Corp. - Key offerings
- 12.16 The Kraft Heinz Co.
- Exhibit 167: The Kraft Heinz Co. - Overview
- Exhibit 168: The Kraft Heinz Co. - Business segments
- Exhibit 169: The Kraft Heinz Co. - Key offerings
- Exhibit 170: The Kraft Heinz Co. - Segment focus
- 12.17 The Tofurky Co. Inc.
- Exhibit 171: The Tofurky Co. Inc. - Overview
- Exhibit 172: The Tofurky Co. Inc. - Product / Service
- Exhibit 173: The Tofurky Co. Inc. - Key offerings
13 Appendix
- 13.1 Scope of the report
- 13.2 Inclusions and exclusions checklist
- Exhibit 174: Inclusions checklist
- Exhibit 175: Exclusions checklist
- 13.3 Currency conversion rates for US$
- Exhibit 176: Currency conversion rates for US$
- 13.4 Research methodology
- Exhibit 177: Research methodology
- Exhibit 178: Validation techniques employed for market sizing
- Exhibit 179: Information sources
- 13.5 List of abbreviations
- Exhibit 180: List of abbreviations
Research Framework
Technavio presents a detailed picture of the market by way of study, synthesis, and summation of data from multiple sources. The analysts have presented the various facets of the market with a particular focus on identifying the key industry influencers. The data thus presented is comprehensive, reliable, and the result of extensive research, both primary and secondary.
INFORMATION SOURCES
Primary sources
- Manufacturers and suppliers
- Channel partners
- Industry experts
- Strategic decision makers
Secondary sources
- Industry journals and periodicals
- Government data
- Financial reports of key industry players
- Historical data
- Press releases
DATA ANALYSIS
Data Synthesis
- Collation of data
- Estimation of key figures
- Analysis of derived insights
Data Validation
- Triangulation with data models
- Reference against proprietary databases
- Corroboration with industry experts
REPORT WRITING
Qualitative
- Market drivers
- Market challenges
- Market trends
- Five forces analysis
Quantitative
- Market size and forecast
- Market segmentation
- Geographical insights
- Competitive landscape
PURCHASE FULL REPORT OF
plant-based meat market
Key Questions Answered
- What are the key global market and the regional market share?
- What are the revenue-generating key market segments?
- What are the key factors driving and challenging this market’s growth?
- Who are the key market vendors and their growth strategies?
- What are the latest trends influencing the growth of this market?
- What are the variables influencing the market growth in the primary regions?
- What are the factors influencing the growth of the parent market?
Why should you prefer Technavio's market insights report?
- Off-the-shelf research reports
- Reports can be tailored to meet the customer's needs
- Trusted by more than 100 fortune 500 organizations
- Information about the market's key drivers, trends, and challenges
- Parent market analysis
- Every week, 50,000 people visit our subscription platform
- Detailed vendors report with competitive landscape
- Covid-19 impact and recovery analysis
- Data on revenue-generating market segments
- Details on the market shares of various regions
- Five-force market analysis