Portable Generator Market Analysis APAC, Europe, North America, South America, Middle East and Africa - US, China, Japan, Germany, UK - Size and Forecast 2023-2027
| Published: Oct 2023 | Pages: 174 | SKU: IRTNTR44940 |
Portable Generator Market by Type , End-User and Geography Segments - Forecast 2023-2027
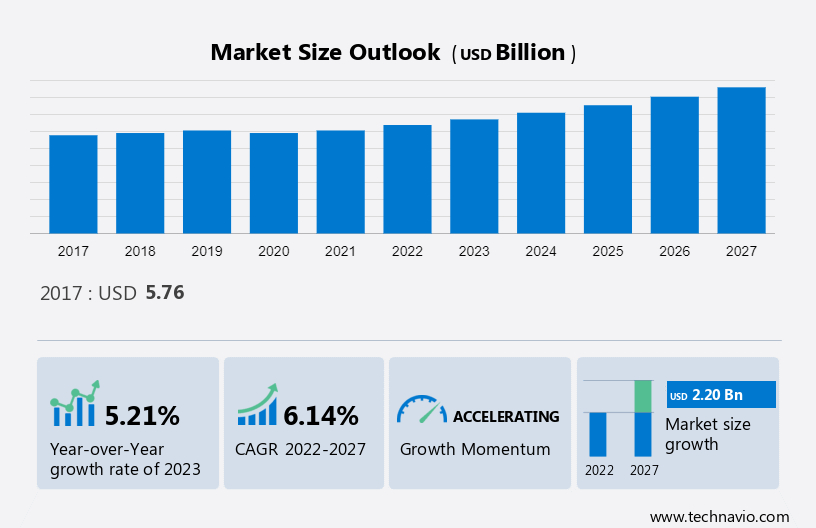
The portable generator market size is forecast to increase by USD 2.20 billion between 2022 and 2027, accelerating at a CAGR of 6.14%. In 2017, China held the largest market share, projecting an annual revenue of USD 0.83 billion.The report includes a comprehensive outlook on the Portable Generator Market, offering forecasts for the industry segmented by Type , which comprises Diesel and Gas. Additionally, it categorizes End-user into Residential, Commercial, and Industrial and infrastructure and covers geographical regions, including APAC, Europe, North America, South America, and Middle East and Africa. The report provides market size, historical data spanning from 2017 to 2021, and future projections, all presented in terms of value in (USD Billion/billion) for each of the mentioned segments..
What will be the Size of the Portable Generator Market During the Forecast Period?
To learn more about this report, Download Report Sample
Portable Generator Market Analysis
Growing instances of power grid failure is a key factor boosting market growth. The global use of portable generators is on the rise due to increased power grid failures. In today's world, electricity is vital for various applications, from transportation and computers to everyday household devices. Rapid urbanization in developing countries has led to higher power consumption, straining older infrastructure and causing grid overloads, resulting in blackouts.
To counter these issues, industrial consumers are increasingly turning to portable generators for backup power during outages. These generators support smooth operations across various applications. The rising occurrence of power grid failures is expected to drive growth in the global portable generator market in the forecast period.
Portable Generator Market Segment Trends
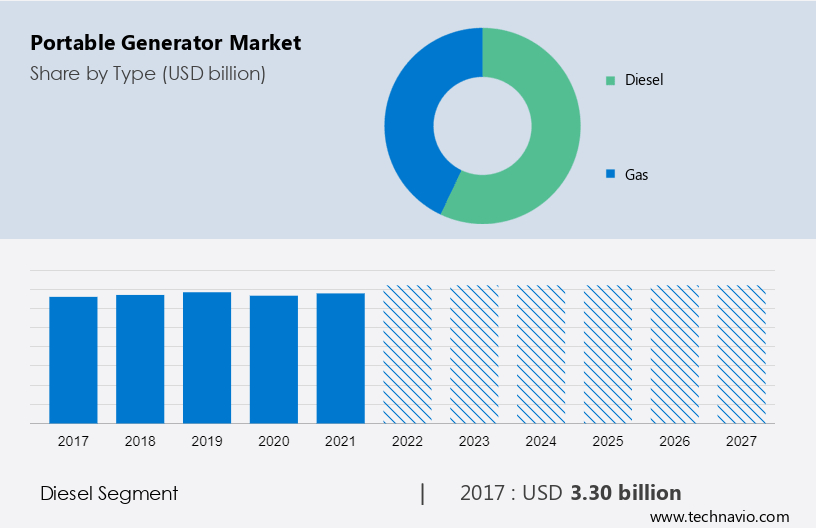
Diesel is the Leading Segment to Dominate the Market
The diesel segment will account for a major share of the market's growth during the forecast period and was valued at USD 3,304.54 Billion in 2017. Portable generators powered by diesel offer the best performance in power fluctuations due to their high-torque performance characteristic. Diesel is the most commonly used fuel in portable generators because it is cost-effective and readily available. It can be stored in containers up to a certain time. Natural gas is supplied through pipeline infrastructure and cannot be stored like diesel. The increasing stringency of regulations regarding fuel emissions, particularly from diesel, has resulted in end-users switching to gas generators or other power supply alternatives, such as UPS. However, due to the cost-effectiveness and availability of diesel and the ease of use of portable diesel generators, the portable diesel generators type segment is expected to show growth and boost the growth of the market in focus during the forecast period.
Portable Generator Market - Revenue Share by Type Segment, 2017 - 2021 - 2027.
For more details on other segments, Download Sample Report
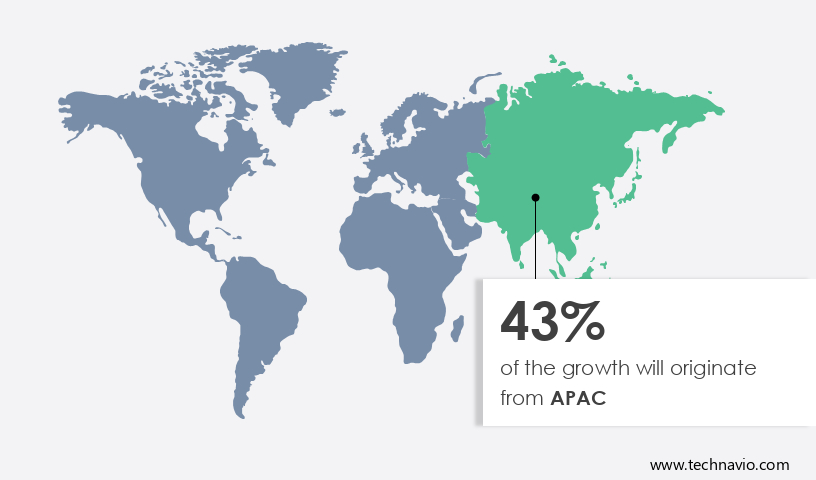
APAC Holds a Prominent Position in the Portable Generator Market
APAC is estimated to contribute 43% to the growth of the global market during the forecast period. Technavio’s analysts have elaborately explained the regional trends and drivers that shape the market during the forecast period.
Developing countries in APAC, such as India, China, and South Korea, are showing rapid industrialization and urbanization. The population in this region is rising at a higher rate compared to the developed countries. Electricity demand is rising due to the ever-rising population. Poor power infrastructure in Asian countries causes power outages, which increases the demand for portable generators for power backup. The growth of the portable generator market in APAC can be shown due to the rising demand from the residential, commercial, and several small-scale industries. Owing to power shortages and lack of access to the grid, backup power sources have become a necessity in the region. The market in focus in the region is expected to register significant growth during the forecast period. z
Portable Generator Market Size, By Region, Global, 2017 - 2021 - 2027.
To understand geographic trends Download Report Sample
Portable Generator Market Companies Overview
The Portable Generator Market is fragmented in nature. Some significant players include Caterpillar and Atlas Copco AB,
The research report also includes detailed analyses of the competitive landscape of the market and information about 15 market companies, including:
Briggs and Stratton LLC, Caterpillar Inc., Cummins Inc., Deere and Co., Doosan Corp., Eaton Corp. Plc, Generac Holdings Inc., H.S. ENGINEERS, Himalayan Power Machines Co., Honda Motor Co. Ltd., Honeywell International Inc., ITOCHU Corp., KAZANCI HOLDING, Kirloskar Oil Engines Ltd., Siemens AG, Skyline Power Solutions, Wacker Neuson SE, Yamaha Motor Co. Ltd., and Yanmar Holdings Co. Ltd.
Segment Overview
The portable generator market report forecasts market growth by revenue at global, regional & country levels and provides an analysis of the latest trends and growth opportunities from 2017 - 2027.
- Type Outlook (USD Billion, 2017 - 2027)
- Diesel
- Gas
- End-user Outlook (USD Billion, 2017 - 2027)
- Residential
- Commercial
- Industrial and infrastructure
- Region Outlook (USD Billion, 2017 - 2027)
- North America
- The U.S.
- Canada
- Europe
- U.K.
- Germany
- France
- Rest of Europe
- APAC
- China
- India
- South America
- Chile
- Argentina
- Brazil
- Middle East & Africa
- Saudi Arabia
- South Africa
- Rest of the Middle East & Africa
- North America
|
Portable Generator Market Scope |
|
|
Report Coverage |
Details |
|
Page number |
174 |
|
Base year |
2022 |
|
Historic period |
2017 - 2021 |
|
Forecast period |
2023-2027 |
|
Growth momentum & CAGR |
Accelerate at a CAGR of 6.14% |
|
Market growth 2023-2027 |
USD 2.20 billion |
|
Market structure |
Fragmented |
|
YoY growth 2022-2023(%) |
5.21 |
|
Regional analysis |
APAC, Europe, North America, South America, and Middle East and Africa |
|
Performing market contribution |
APAC at 43% |
|
Key countries |
US, China, Japan, Germany, and UK |
|
Competitive landscape |
Leading Companies, Market Positioning of Companies, Competitive Strategies, and Industry Risks |
|
Key companies profiled |
Atlas Copco AB, Briggs and Stratton LLC, Caterpillar Inc., Cummins Inc., Deere and Co., Doosan Corp., Eaton Corp. Plc, Generac Holdings Inc., H.S. ENGINEERS, Himalayan Power Machines Co., Honda Motor Co. Ltd., Honeywell International Inc., ITOCHU Corp., KAZANCI HOLDING, Kirloskar Oil Engines Ltd., Siemens AG, Skyline Power Solutions, Wacker Neuson SE, Yamaha Motor Co. Ltd., and Yanmar Holdings Co. Ltd. |
|
Market dynamics |
Parent market analysis, Market growth inducers and obstacles, Fast-growing and slow-growing segment analysis, COVID 19 impact and recovery analysis and future consumer dynamics, Market condition analysis for forecast period |
|
Customization purview |
If our report has not included the data that you are looking for, you can reach out to our analysts and get segments customized. |
What are the Key Data Covered in this Portable Generator Market Research Report?
- CAGR of the market during the forecast period
- Detailed information on factors that will drive the growth of the market between 2023 and 2027
- Precise estimation of the size of the market size and its contribution of the market in focus to the parent market
- Accurate predictions about upcoming trends and changes in consumer behaviour
- Growth of the market industry across APAC, Europe, North America, South America, and Middle East and Africa
- Thorough analysis of the market’s competitive landscape and detailed information about companies
- Comprehensive analysis of factors that will challenge the growth of market companies
We can help! Our analysts can customize this market research report to meet your requirements.
1 Executive Summary
- 1.1 Market overview
- Exhibit 01: Executive Summary – Chart on Market Overview
- Exhibit 02: Executive Summary – Data Table on Market Overview
- Exhibit 03: Executive Summary – Chart on Global Market Characteristics
- Exhibit 04: Executive Summary – Chart on Market by Geography
- Exhibit 05: Executive Summary – Chart on Market Segmentation by Type
- Exhibit 06: Executive Summary – Chart on Market Segmentation by End-user
- Exhibit 07: Executive Summary – Chart on Incremental Growth
- Exhibit 08: Executive Summary – Data Table on Incremental Growth
- Exhibit 09: Executive Summary – Chart on Vendor Market Positioning
2 Market Landscape
- 2.1 Market ecosystem
- Exhibit 10: Parent market
- Exhibit 11: Market Characteristics
3 Market Sizing
- 3.1 Market definition
- Exhibit 12: Offerings of vendors included in the market definition
- 3.2 Market segment analysis
- Exhibit 13: Market segments
- 3.3 Market size 2022
- 3.4 Market outlook: Forecast for 2022-2027
- Exhibit 14: Chart on Global - Market size and forecast 2022-2027 ($ million)
- Exhibit 15: Data Table on Global - Market size and forecast 2022-2027 ($ million)
- Exhibit 16: Chart on Global Market: Year-over-year growth 2022-2027 (%)
- Exhibit 17: Data Table on Global Market: Year-over-year growth 2022-2027 (%)
4 Historic Market Size
- 4.1 Global portable generator market 2017 - 2021
- Exhibit 18: Historic Market Size – Data Table on global portable generator market 2017 - 2021 ($ million)
- 4.2 Type Segment Analysis 2017 - 2021
- Exhibit 19: Historic Market Size – Type Segment 2017 - 2021 ($ million)
- 4.3 End-user Segment Analysis 2017 - 2021
- Exhibit 20: Historic Market Size – End-user Segment 2017 - 2021 ($ million)
- 4.4 Geography Segment Analysis 2017 - 2021
- Exhibit 21: Historic Market Size – Geography Segment 2017 - 2021 ($ million)
- 4.5 Country Segment Analysis 2017 - 2021
- Exhibit 22: Historic Market Size – Country Segment 2017 - 2021 ($ million)
5 Five Forces Analysis
- 5.1 Five forces summary
- Exhibit 23: Five forces analysis - Comparison between 2022 and 2027
- 5.2 Bargaining power of buyers
- Exhibit 24: Chart on Bargaining power of buyers – Impact of key factors 2022 and 2027
- 5.3 Bargaining power of suppliers
- Exhibit 25: Bargaining power of suppliers – Impact of key factors in 2022 and 2027
- 5.4 Threat of new entrants
- Exhibit 26: Threat of new entrants – Impact of key factors in 2022 and 2027
- 5.5 Threat of substitutes
- Exhibit 27: Threat of substitutes – Impact of key factors in 2022 and 2027
- 5.6 Threat of rivalry
- Exhibit 28: Threat of rivalry – Impact of key factors in 2022 and 2027
- 5.7 Market condition
- Exhibit 29: Chart on Market condition - Five forces 2022 and 2027
6 Market Segmentation by Type
- 6.1 Market segments
- Exhibit 30: Chart on Type - Market share 2022-2027 (%)
- Exhibit 31: Data Table on Type - Market share 2022-2027 (%)
- 6.2 Comparison by Type
- Exhibit 32: Chart on Comparison by Type
- Exhibit 33: Data Table on Comparison by Type
- 6.3 Diesel - Market size and forecast 2022-2027
- Exhibit 34: Chart on Diesel - Market size and forecast 2022-2027 ($ million)
- Exhibit 35: Data Table on Diesel - Market size and forecast 2022-2027 ($ million)
- Exhibit 36: Chart on Diesel - Year-over-year growth 2022-2027 (%)
- Exhibit 37: Data Table on Diesel - Year-over-year growth 2022-2027 (%)
- 6.4 Gas - Market size and forecast 2022-2027
- Exhibit 38: Chart on Gas - Market size and forecast 2022-2027 ($ million)
- Exhibit 39: Data Table on Gas - Market size and forecast 2022-2027 ($ million)
- Exhibit 40: Chart on Gas - Year-over-year growth 2022-2027 (%)
- Exhibit 41: Data Table on Gas - Year-over-year growth 2022-2027 (%)
- 6.5 Market opportunity by Type
- Exhibit 42: Market opportunity by Type ($ million)
- Exhibit 43: Data Table on Market opportunity by Type ($ million)
7 Market Segmentation by End-user
- 7.1 Market segments
- Exhibit 44: Chart on End-user - Market share 2022-2027 (%)
- Exhibit 45: Data Table on End-user - Market share 2022-2027 (%)
- 7.2 Comparison by End-user
- Exhibit 46: Chart on Comparison by End-user
- Exhibit 47: Data Table on Comparison by End-user
- 7.3 Residential - Market size and forecast 2022-2027
- Exhibit 48: Chart on Residential - Market size and forecast 2022-2027 ($ million)
- Exhibit 49: Data Table on Residential - Market size and forecast 2022-2027 ($ million)
- Exhibit 50: Chart on Residential - Year-over-year growth 2022-2027 (%)
- Exhibit 51: Data Table on Residential - Year-over-year growth 2022-2027 (%)
- 7.4 Commercial - Market size and forecast 2022-2027
- Exhibit 52: Chart on Commercial - Market size and forecast 2022-2027 ($ million)
- Exhibit 53: Data Table on Commercial - Market size and forecast 2022-2027 ($ million)
- Exhibit 54: Chart on Commercial - Year-over-year growth 2022-2027 (%)
- Exhibit 55: Data Table on Commercial - Year-over-year growth 2022-2027 (%)
- 7.5 Industrial and infrastructure - Market size and forecast 2022-2027
- Exhibit 56: Chart on Industrial and infrastructure - Market size and forecast 2022-2027 ($ million)
- Exhibit 57: Data Table on Industrial and infrastructure - Market size and forecast 2022-2027 ($ million)
- Exhibit 58: Chart on Industrial and infrastructure - Year-over-year growth 2022-2027 (%)
- Exhibit 59: Data Table on Industrial and infrastructure - Year-over-year growth 2022-2027 (%)
- 7.6 Market opportunity by End-user
- Exhibit 60: Market opportunity by End-user ($ million)
- Exhibit 61: Data Table on Market opportunity by End-user ($ million)
8 Customer Landscape
- 8.1 Customer landscape overview
- Exhibit 62: Analysis of price sensitivity, lifecycle, customer purchase basket, adoption rates, and purchase criteria
9 Geographic Landscape
- 9.1 Geographic segmentation
- Exhibit 63: Chart on Market share by geography 2022-2027 (%)
- Exhibit 64: Data Table on Market share by geography 2022-2027 (%)
- 9.2 Geographic comparison
- Exhibit 65: Chart on Geographic comparison
- Exhibit 66: Data Table on Geographic comparison
- 9.3 APAC - Market size and forecast 2022-2027
- Exhibit 67: Chart on APAC - Market size and forecast 2022-2027 ($ million)
- Exhibit 68: Data Table on APAC - Market size and forecast 2022-2027 ($ million)
- Exhibit 69: Chart on APAC - Year-over-year growth 2022-2027 (%)
- Exhibit 70: Data Table on APAC - Year-over-year growth 2022-2027 (%)
- 9.4 Europe - Market size and forecast 2022-2027
- Exhibit 71: Chart on Europe - Market size and forecast 2022-2027 ($ million)
- Exhibit 72: Data Table on Europe - Market size and forecast 2022-2027 ($ million)
- Exhibit 73: Chart on Europe - Year-over-year growth 2022-2027 (%)
- Exhibit 74: Data Table on Europe - Year-over-year growth 2022-2027 (%)
- 9.5 North America - Market size and forecast 2022-2027
- Exhibit 75: Chart on North America - Market size and forecast 2022-2027 ($ million)
- Exhibit 76: Data Table on North America - Market size and forecast 2022-2027 ($ million)
- Exhibit 77: Chart on North America - Year-over-year growth 2022-2027 (%)
- Exhibit 78: Data Table on North America - Year-over-year growth 2022-2027 (%)
- 9.6 South America - Market size and forecast 2022-2027
- Exhibit 79: Chart on South America - Market size and forecast 2022-2027 ($ million)
- Exhibit 80: Data Table on South America - Market size and forecast 2022-2027 ($ million)
- Exhibit 81: Chart on South America - Year-over-year growth 2022-2027 (%)
- Exhibit 82: Data Table on South America - Year-over-year growth 2022-2027 (%)
- 9.7 Middle East and Africa - Market size and forecast 2022-2027
- Exhibit 83: Chart on Middle East and Africa - Market size and forecast 2022-2027 ($ million)
- Exhibit 84: Data Table on Middle East and Africa - Market size and forecast 2022-2027 ($ million)
- Exhibit 85: Chart on Middle East and Africa - Year-over-year growth 2022-2027 (%)
- Exhibit 86: Data Table on Middle East and Africa - Year-over-year growth 2022-2027 (%)
- 9.8 China - Market size and forecast 2022-2027
- Exhibit 87: Chart on China - Market size and forecast 2022-2027 ($ million)
- Exhibit 88: Data Table on China - Market size and forecast 2022-2027 ($ million)
- Exhibit 89: Chart on China - Year-over-year growth 2022-2027 (%)
- Exhibit 90: Data Table on China - Year-over-year growth 2022-2027 (%)
- 9.9 US - Market size and forecast 2022-2027
- Exhibit 91: Chart on US - Market size and forecast 2022-2027 ($ million)
- Exhibit 92: Data Table on US - Market size and forecast 2022-2027 ($ million)
- Exhibit 93: Chart on US - Year-over-year growth 2022-2027 (%)
- Exhibit 94: Data Table on US - Year-over-year growth 2022-2027 (%)
- 9.10 Germany - Market size and forecast 2022-2027
- Exhibit 95: Chart on Germany - Market size and forecast 2022-2027 ($ million)
- Exhibit 96: Data Table on Germany - Market size and forecast 2022-2027 ($ million)
- Exhibit 97: Chart on Germany - Year-over-year growth 2022-2027 (%)
- Exhibit 98: Data Table on Germany - Year-over-year growth 2022-2027 (%)
- 9.11 Japan - Market size and forecast 2022-2027
- Exhibit 99: Chart on Japan - Market size and forecast 2022-2027 ($ million)
- Exhibit 100: Data Table on Japan - Market size and forecast 2022-2027 ($ million)
- Exhibit 101: Chart on Japan - Year-over-year growth 2022-2027 (%)
- Exhibit 102: Data Table on Japan - Year-over-year growth 2022-2027 (%)
- 9.12 UK - Market size and forecast 2022-2027
- Exhibit 103: Chart on UK - Market size and forecast 2022-2027 ($ million)
- Exhibit 104: Data Table on UK - Market size and forecast 2022-2027 ($ million)
- Exhibit 105: Chart on UK - Year-over-year growth 2022-2027 (%)
- Exhibit 106: Data Table on UK - Year-over-year growth 2022-2027 (%)
- 9.13 Market opportunity by geography
- Exhibit 107: Market opportunity by geography ($ million)
- Exhibit 108: Data Tables on Market opportunity by geography ($ million)
10 Drivers, Challenges, and Trends
- 10.1 Market drivers
- 10.2 Market challenges
- 10.3 Impact of drivers and challenges
- Exhibit 109: Impact of drivers and challenges in 2022 and 2027
- 10.4 Market trends
11 Vendor Landscape
- 11.1 Overview
- 11.2 Vendor landscape
- Exhibit 110: Overview on Criticality of inputs and Factors of differentiation
- 11.3 Landscape disruption
- Exhibit 111: Overview on factors of disruption
- 11.4 Industry risks
- Exhibit 112: Impact of key risks on business
12 Vendor Analysis
- 12.1 Vendors covered
- Exhibit 113: Vendors covered
- 12.2 Market positioning of vendors
- Exhibit 114: Matrix on vendor position and classification
- 12.3 Atlas Copco AB
- Exhibit 115: Atlas Copco AB - Overview
- Exhibit 116: Atlas Copco AB - Business segments
- Exhibit 117: Atlas Copco AB - Key news
- Exhibit 118: Atlas Copco AB - Key offerings
- Exhibit 119: Atlas Copco AB - Segment focus
- 12.4 Briggs and Stratton LLC
- Exhibit 120: Briggs and Stratton LLC - Overview
- Exhibit 121: Briggs and Stratton LLC - Product / Service
- Exhibit 122: Briggs and Stratton LLC - Key offerings
- 12.5 Caterpillar Inc.
- Exhibit 123: Caterpillar Inc. - Overview
- Exhibit 124: Caterpillar Inc. - Business segments
- Exhibit 125: Caterpillar Inc. - Key offerings
- Exhibit 126: Caterpillar Inc. - Segment focus
- 12.6 Cummins Inc.
- Exhibit 127: Cummins Inc. - Overview
- Exhibit 128: Cummins Inc. - Business segments
- Exhibit 129: Cummins Inc. - Key offerings
- Exhibit 130: Cummins Inc. - Segment focus
- 12.7 Deere and Co.
- Exhibit 131: Deere and Co. - Overview
- Exhibit 132: Deere and Co. - Business segments
- Exhibit 133: Deere and Co. - Key news
- Exhibit 134: Deere and Co. - Key offerings
- Exhibit 135: Deere and Co. - Segment focus
- 12.8 Doosan Corp.
- Exhibit 136: Doosan Corp. - Overview
- Exhibit 137: Doosan Corp. - Business segments
- Exhibit 138: Doosan Corp. - Key offerings
- Exhibit 139: Doosan Corp. - Segment focus
- 12.9 Generac Holdings Inc.
- Exhibit 140: Generac Holdings Inc. - Overview
- Exhibit 141: Generac Holdings Inc. - Business segments
- Exhibit 142: Generac Holdings Inc. - Key news
- Exhibit 143: Generac Holdings Inc. - Key offerings
- Exhibit 144: Generac Holdings Inc. - Segment focus
- 12.10 Honda Motor Co. Ltd.
- Exhibit 145: Honda Motor Co. Ltd. - Overview
- Exhibit 146: Honda Motor Co. Ltd. - Business segments
- Exhibit 147: Honda Motor Co. Ltd. - Key news
- Exhibit 148: Honda Motor Co. Ltd. - Key offerings
- Exhibit 149: Honda Motor Co. Ltd. - Segment focus
- 12.11 ITOCHU Corp.
- Exhibit 150: ITOCHU Corp. - Overview
- Exhibit 151: ITOCHU Corp. - Business segments
- Exhibit 152: ITOCHU Corp. - Key offerings
- Exhibit 153: ITOCHU Corp. - Segment focus
- 12.12 KAZANCI HOLDING
- Exhibit 154: KAZANCI HOLDING - Overview
- Exhibit 155: KAZANCI HOLDING - Product / Service
- Exhibit 156: KAZANCI HOLDING - Key offerings
- 12.13 Kirloskar Oil Engines Ltd.
- Exhibit 157: Kirloskar Oil Engines Ltd. - Overview
- Exhibit 158: Kirloskar Oil Engines Ltd. - Product / Service
- Exhibit 159: Kirloskar Oil Engines Ltd. - Key offerings
- 12.14 Siemens AG
- Exhibit 160: Siemens AG - Overview
- Exhibit 161: Siemens AG - Business segments
- Exhibit 162: Siemens AG - Key news
- Exhibit 163: Siemens AG - Key offerings
- Exhibit 164: Siemens AG - Segment focus
- 12.15 Wacker Neuson SE
- Exhibit 165: Wacker Neuson SE - Overview
- Exhibit 166: Wacker Neuson SE - Product / Service
- Exhibit 167: Wacker Neuson SE - Key offerings
- 12.16 Yamaha Motor Co. Ltd.
- Exhibit 168: Yamaha Motor Co. Ltd. - Overview
- Exhibit 169: Yamaha Motor Co. Ltd. - Business segments
- Exhibit 170: Yamaha Motor Co. Ltd. - Key news
- Exhibit 171: Yamaha Motor Co. Ltd. - Key offerings
- Exhibit 172: Yamaha Motor Co. Ltd. - Segment focus
- 12.17 Yanmar Holdings Co. Ltd.
- Exhibit 173: Yanmar Holdings Co. Ltd. - Overview
- Exhibit 174: Yanmar Holdings Co. Ltd. - Product / Service
- Exhibit 175: Yanmar Holdings Co. Ltd. - Key news
- Exhibit 176: Yanmar Holdings Co. Ltd. - Key offerings
13 Appendix
- 13.1 Scope of the report
- 13.2 Inclusions and exclusions checklist
- Exhibit 177: Inclusions checklist
- Exhibit 178: Exclusions checklist
- 13.3 Currency conversion rates for US$
- Exhibit 179: Currency conversion rates for US$
- 13.4 Research methodology
- Exhibit 180: Research methodology
- Exhibit 181: Validation techniques employed for market sizing
- Exhibit 182: Information sources
- 13.5 List of abbreviations
- Exhibit 183: List of abbreviations
- demand for uninterrupted power: The increasing demand for energy, rising population, and aging power infrastructure have increased the strain on power grids, which are the main reasons for power blackouts in most countries, such as India, China, and other Asian countries. Even some countries, such as the UAE and Saudi Arabia, have also observed an increase in power outages, which are usually caused by the lack of fuel spurred by the failure of a deal to deliver natural gas. Some of the other causes of power failure in these counties include distribution station failure, load shedding, maintenance shutdown, vandalism, and cyber-attacks.
Research Framework
Technavio presents a detailed picture of the market by way of study, synthesis, and summation of data from multiple sources. The analysts have presented the various facets of the market with a particular focus on identifying the key industry influencers. The data thus presented is comprehensive, reliable, and the result of extensive research, both primary and secondary.
INFORMATION SOURCES
Primary sources
- Manufacturers and suppliers
- Channel partners
- Industry experts
- Strategic decision makers
Secondary sources
- Industry journals and periodicals
- Government data
- Financial reports of key industry players
- Historical data
- Press releases
DATA ANALYSIS
Data Synthesis
- Collation of data
- Estimation of key figures
- Analysis of derived insights
Data Validation
- Triangulation with data models
- Reference against proprietary databases
- Corroboration with industry experts
REPORT WRITING
Qualitative
- Market drivers
- Market challenges
- Market trends
- Five forces analysis
Quantitative
- Market size and forecast
- Market segmentation
- Geographical insights
- Competitive landscape
PURCHASE FULL REPORT OF
portable generator market market
Key Questions Answered
- What are the key global market and the regional market share?
- What are the revenue-generating key market segments?
- What are the key factors driving and challenging this market’s growth?
- Who are the key market vendors and their growth strategies?
- What are the latest trends influencing the growth of this market?
- What are the variables influencing the market growth in the primary regions?
- What are the factors influencing the growth of the parent market?
Why should you prefer Technavio's market insights report?
- Off-the-shelf research reports
- Reports can be tailored to meet the customer's needs
- Trusted by more than 100 fortune 500 organizations
- Information about the market's key drivers, trends, and challenges
- Parent market analysis
- Every week, 50,000 people visit our subscription platform
- Detailed vendors report with competitive landscape
- Covid-19 impact and recovery analysis
- Data on revenue-generating market segments
- Details on the market shares of various regions
- Five-force market analysis