Product-based Sales Training Market Analysis - APAC, North America, Europe, South America, Middle East and Africa - US, China, Japan, UK, Germany - Size and Forecast 2023-2027
| Published: Nov 2022 | Pages: 174 | SKU: IRTNTR40439 |
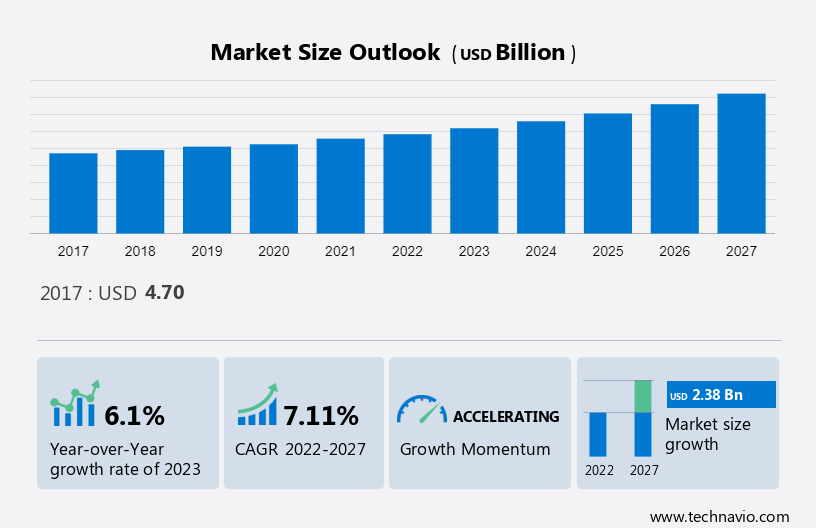
The product-based sales training market size is forecast to increase by USD 2,385.09 million between 2022 and 2027. The report covers Product-based Sales Training Market industry forecast and is segmented into End-user encompassing consumer goods, bfsi, automotive, and others and Geography encompassing APAC, North America, Europe, South America, and Middle East and Africa. The market size, historical market size (2017-2021), and forecasts are provided on the basis of value (USD million) for all the above segments.
Product-based Sales Training Market Size
To learn more about this report, Download Report Sample
Product-based Sales Training Market Analysis
The market size for the Product-based Sales Training Market is projected to experience a CAGR of 7.11% between 2023 to 2027 with a Year-over-year (YoY) growth of 6.1%.
In 2020, the COVID-19 pandemic severely impacted the Asia-Pacific (APAC) region, disrupting trade, investments, and business operations. Workplace closures and supply chain issues forced many companies to pause or alter their production methods due to shifting demand. Consequently, the product-based sales training market in the region faced challenges in the first half of 2021. However, as of June 2021, a decline in COVID-19 cases, increased vaccination rates, and eased lockdown measures led to a gradual recovery in consumer demand and business investments. Sectors like IT and manufacturing expanded their workforces, driving the need for online product-based sales training and projecting market growth in the forecast period.
Increased emphasis on cost-effective training methods is a key factor driving the market growth. The market is growing due to the increased emphasis on cost-effective product-based sales training methods. Businesses are favoring online and blended formats for their affordability. Visual-based technologies and simulation-based training are gaining traction for boosting employee engagement.
Online and blended courses are cost-effective, eliminating travel and relocation expenses. They provide extended support and coordination for geographically dispersed teams, offering a centralized training model. With their flexibility and the rise of BYOD policies, these programs are more budget-friendly than traditional options, driving market growth in the forecast period.
Product-based Sales Training Market Trends
Consumer Goods is the Fastest Growing Segment to Dominate the Market
The consumer goods segment showed a gradual increase in market share with USD 1,651.85 million in 2017 and continued to grow by 2021. With the increase in the volumes of available consumer data, such as consumer purchase patterns along with the customer's tastes and preferences, more companies are using analytics and AI to provide actionable insights on sales training, which provide personalized training modules to sales personnel. There are many vendors operating in the consumer goods sector with an emphasis on sales training and leadership training. In addition to these, employee retention and safety training are some of the major concerns related to the consumer goods sector. Such factors are driving the market growth.
Product-based Sales Training Market - Revenue Share by Consumer Goods Segment, 2017-2027
For more details on other segments, Download Sample Report
APAC Holds a Prominent Position in the Product-based Sales Training Market
APAC is estimated to contribute 35% to the growth of the global market during the forecast period. The product-based sales training market in APAC is expected to record rapid growth during the forecast period. The major factors driving the growth of the market in the region include the rise in the number of small and medium businesses (SMBs) and multinational corporations (MNCs) and the increased adoption of cost-effective training. The major countries contributing to the growth of the market include Australia, China, Japan, Singapore, and India. The comprehensive IT infrastructure and robust Internet services available in advanced or mature markets such as Australia, Singapore, and Japan are likely to encourage companies and organizations to implement blended and online product knowledge training sessions for their sales professionals.
Product-based Sales Training Market Size, By Region, Global, 2017-2027
To understand geographic trends Download Report Sample
Product-based Sales Training Market Companies Overview
The Product-based Sales Training Market is fragmented in nature. Some significant players include Brainshark Inc., CommLab India LLP, Cornerstone OnDemand Inc., Corporate Visions Inc.
The research report also includes detailed analyses of the competitive landscape of the market and information about 15 market companies, including:
GMetri Inc., HubSpot Inc., Korn Ferry, Learning Technologies Group Plc, Meirc Training and Consulting LTD., RAIN Group, Richardson Sales Performance, Sales Training America Inc., SalesHood Inc., Sandler Systems Inc., Specialized Sales Systems, The Brooks Group, VirtualSpeech Ltd., Wilson Learning Worldwide Inc., Allen Communication Learning Services, and ASLAN Training and Development LLC
Segment Overview
The product-based sales training market report forecasts market growth by revenue at global, regional & country levels and provides an analysis of the latest trends and growth opportunities from 2017 - 2021.
- End-User Outlook ( USD Million, 2017 - 2027)
- Consumer goods
- BFSI
- Automotive
- Others
- Learning Method Outlook ( USD Million, 2017 - 2027)
- Blended training
- Online training
- ILT
- Region Outlook (USD Million, 2017 - 2027)
- North America
- The U.S.
- Canada
- South America
- Chile
- Argentina
- Brazil
- Europe
- U.K.
- Germany
- France
- Rest of Europe
- APAC
- China
- India
- Middle East & Africa
- Saudi Arabia
- South Africa
- Rest of the Middle East & Africa
- North America
|
Product-based Sales Training Market Scope |
|
|
Report Coverage |
Details |
|
Page number |
174 |
|
Base year |
2022 |
|
Historic period |
2017 - 2021 |
|
Forecast period |
2023-2027 |
|
Growth momentum & CAGR |
Accelerate at a CAGR of 7.11% |
|
Market growth 2023-2027 |
USD 2385.09 million |
|
Market structure |
Fragmented |
|
YoY growth 2022-2023(%) |
6.1 |
|
Regional analysis |
APAC, North America, Europe, South America, and Middle East and Africa |
|
Performing market contribution |
APAC at 35% |
|
Key countries |
US, China, Japan, UK, and Germany |
|
Competitive landscape |
Leading Companies, Market Positioning of Companies, Competitive Strategies, and Industry Risks |
|
Key companies profiled |
Brainshark Inc., CommLab India LLP, Cornerstone OnDemand Inc., Corporate Visions Inc., GMetri Inc., HubSpot Inc., Korn Ferry, Learning Technologies Group Plc, Meirc Training and Consulting LTD., RAIN Group, Richardson Sales Performance, Sales Training America Inc., SalesHood Inc., Sandler Systems Inc., Specialized Sales Systems, The Brooks Group, VirtualSpeech Ltd., Wilson Learning Worldwide Inc., Allen Communication Learning Services, and ASLAN Training and Development LLC |
|
Market dynamics |
Parent market analysis, Market growth inducers and obstacles, Fast-growing and slow-growing segment analysis, COVID 19 impact and recovery analysis and future consumer dynamics, Market condition analysis for forecast period |
|
Customization purview |
If our report has not included the data that you are looking for, you can reach out to our analysts and get segments customized. |
What are the Key Data Covered in this Product-based Sales Training Market Research Report?
- CAGR of the market during the forecast period
- Detailed information on factors that will drive the growth of the market between 2023 and 2027
- Precise estimation of the size of the market size and its contribution of the market in focus to the parent market
- Accurate predictions about upcoming trends and changes in consumer behaviour
- Growth of the market industry across APAC, North America, Europe, South America, and Middle East and Africa
- Thorough analysis of the market’s competitive landscape and detailed information about companies
- Comprehensive analysis of factors that will challenge the growth of market companies
We can help! Our analysts can customize this market research report to meet your requirements.
1 Executive Summary
- 1.1 Market overview
- Exhibit 01: Executive Summary – Chart on Market Overview
- Exhibit 02: Executive Summary – Data Table on Market Overview
- Exhibit 03: Executive Summary – Chart on Global Market Characteristics
- Exhibit 04: Executive Summary – Chart on Market by Geography
- Exhibit 05: Executive Summary – Chart on Market Segmentation by End-user
- Exhibit 06: Executive Summary – Chart on Market Segmentation by Learning Method
- Exhibit 07: Executive Summary – Chart on Incremental Growth
- Exhibit 08: Executive Summary – Data Table on Incremental Growth
- Exhibit 09: Executive Summary – Chart on Vendor Market Positioning
2 Market Landscape
- 2.1 Market ecosystem
- Exhibit 10: Parent market
- Exhibit 11: Market Characteristics
3 Market Sizing
- 3.1 Market definition
- Exhibit 12: Offerings of vendors included in the market definition
- 3.2 Market segment analysis
- Exhibit 13: Market segments
- 3.3 Market size 2022
- 3.4 Market outlook: Forecast for 2022-2027
- Exhibit 14: Chart on Global - Market size and forecast 2022-2027 ($ billion)
- Exhibit 15: Data Table on Global - Market size and forecast 2022-2027 ($ billion)
- Exhibit 16: Chart on Global Market: Year-over-year growth 2022-2027 (%)
- Exhibit 17: Data Table on Global Market: Year-over-year growth 2022-2027 (%)
4 Historic Market Size
- 4.1 Global product-based sales training market 2017 - 2021
- Exhibit 18: Historic Market Size – Data Table on Global product-based sales training market 2017 - 2021 ($ billion)
- 4.2 End-user Segment Analysis 2017 - 2021
- Exhibit 19: Historic Market Size – End-user Segment 2017 - 2021 ($ billion)
- 4.3 Learning method Segment Analysis 2017 - 2021
- Exhibit 20: Historic Market Size – Learning method Segment 2017 - 2021 ($ billion)
- 4.4 Geography Segment Analysis 2017 - 2021
- Exhibit 21: Historic Market Size – Geography Segment 2017 - 2021 ($ billion)
- 4.5 Country Segment Analysis 2017 - 2021
- Exhibit 22: Historic Market Size – Country Segment 2017 - 2021 ($ billion)
5 Five Forces Analysis
- 5.1 Five forces summary
- Exhibit 23: Five forces analysis - Comparison between 2022 and 2027
- 5.2 Bargaining power of buyers
- Exhibit 24: Chart on Bargaining power of buyers – Impact of key factors 2022 and 2027
- 5.3 Bargaining power of suppliers
- Exhibit 25: Bargaining power of suppliers – Impact of key factors in 2022 and 2027
- 5.4 Threat of new entrants
- Exhibit 26: Threat of new entrants – Impact of key factors in 2022 and 2027
- 5.5 Threat of substitutes
- Exhibit 27: Threat of substitutes – Impact of key factors in 2022 and 2027
- 5.6 Threat of rivalry
- Exhibit 28: Threat of rivalry – Impact of key factors in 2022 and 2027
- 5.7 Market condition
- Exhibit 29: Chart on Market condition - Five forces 2022 and 2027
6 Market Segmentation by End-user
- 6.1 Market segments
- Exhibit 30: Chart on End-user - Market share 2022-2027 (%)
- Exhibit 31: Data Table on End-user - Market share 2022-2027 (%)
- 6.2 Comparison by End-user
- Exhibit 32: Chart on Comparison by End-user
- Exhibit 33: Data Table on Comparison by End-user
- 6.3 Consumer goods - Market size and forecast 2022-2027
- Exhibit 34: Chart on Consumer goods - Market size and forecast 2022-2027 ($ billion)
- Exhibit 35: Data Table on Consumer goods - Market size and forecast 2022-2027 ($ billion)
- Exhibit 36: Chart on Consumer goods - Year-over-year growth 2022-2027 (%)
- Exhibit 37: Data Table on Consumer goods - Year-over-year growth 2022-2027 (%)
- 6.4 BFSI - Market size and forecast 2022-2027
- Exhibit 38: Chart on BFSI - Market size and forecast 2022-2027 ($ billion)
- Exhibit 39: Data Table on BFSI - Market size and forecast 2022-2027 ($ billion)
- Exhibit 40: Chart on BFSI - Year-over-year growth 2022-2027 (%)
- Exhibit 41: Data Table on BFSI - Year-over-year growth 2022-2027 (%)
- 6.5 Automotive - Market size and forecast 2022-2027
- Exhibit 42: Chart on Automotive - Market size and forecast 2022-2027 ($ billion)
- Exhibit 43: Data Table on Automotive - Market size and forecast 2022-2027 ($ billion)
- Exhibit 44: Chart on Automotive - Year-over-year growth 2022-2027 (%)
- Exhibit 45: Data Table on Automotive - Year-over-year growth 2022-2027 (%)
- 6.6 Others - Market size and forecast 2022-2027
- Exhibit 46: Chart on Others - Market size and forecast 2022-2027 ($ billion)
- Exhibit 47: Data Table on Others - Market size and forecast 2022-2027 ($ billion)
- Exhibit 48: Chart on Others - Year-over-year growth 2022-2027 (%)
- Exhibit 49: Data Table on Others - Year-over-year growth 2022-2027 (%)
- 6.7 Market opportunity by End-user
- Exhibit 50: Market opportunity by End-user ($ billion)
7 Market Segmentation by Learning Method
- 7.1 Market segments
- Exhibit 51: Chart on Learning Method - Market share 2022-2027 (%)
- Exhibit 52: Data Table on Learning Method - Market share 2022-2027 (%)
- 7.2 Comparison by Learning Method
- Exhibit 53: Chart on Comparison by Learning Method
- Exhibit 54: Data Table on Comparison by Learning Method
- 7.3 Blended training - Market size and forecast 2022-2027
- Exhibit 55: Chart on Blended training - Market size and forecast 2022-2027 ($ billion)
- Exhibit 56: Data Table on Blended training - Market size and forecast 2022-2027 ($ billion)
- Exhibit 57: Chart on Blended training - Year-over-year growth 2022-2027 (%)
- Exhibit 58: Data Table on Blended training - Year-over-year growth 2022-2027 (%)
- 7.4 Online training - Market size and forecast 2022-2027
- Exhibit 59: Chart on Online training - Market size and forecast 2022-2027 ($ billion)
- Exhibit 60: Data Table on Online training - Market size and forecast 2022-2027 ($ billion)
- Exhibit 61: Chart on Online training - Year-over-year growth 2022-2027 (%)
- Exhibit 62: Data Table on Online training - Year-over-year growth 2022-2027 (%)
- 7.5 ILT - Market size and forecast 2022-2027
- Exhibit 63: Chart on ILT - Market size and forecast 2022-2027 ($ billion)
- Exhibit 64: Data Table on ILT - Market size and forecast 2022-2027 ($ billion)
- Exhibit 65: Chart on ILT - Year-over-year growth 2022-2027 (%)
- Exhibit 66: Data Table on ILT - Year-over-year growth 2022-2027 (%)
- 7.6 Market opportunity by Learning Method
- Exhibit 67: Market opportunity by Learning Method ($ billion)
8 Customer Landscape
- 8.1 Customer landscape overview
- Exhibit 68: Analysis of price sensitivity, lifecycle, customer purchase basket, adoption rates, and purchase criteria
9 Geographic Landscape
- 9.1 Geographic segmentation
- Exhibit 69: Chart on Market share by geography 2022-2027 (%)
- Exhibit 70: Data Table on Market share by geography 2022-2027 (%)
- 9.2 Geographic comparison
- Exhibit 71: Chart on Geographic comparison
- Exhibit 72: Data Table on Geographic comparison
- 9.3 APAC - Market size and forecast 2022-2027
- Exhibit 73: Chart on APAC - Market size and forecast 2022-2027 ($ billion)
- Exhibit 74: Data Table on APAC - Market size and forecast 2022-2027 ($ billion)
- Exhibit 75: Chart on APAC - Year-over-year growth 2022-2027 (%)
- Exhibit 76: Data Table on APAC - Year-over-year growth 2022-2027 (%)
- 9.4 North America - Market size and forecast 2022-2027
- Exhibit 77: Chart on North America - Market size and forecast 2022-2027 ($ billion)
- Exhibit 78: Data Table on North America - Market size and forecast 2022-2027 ($ billion)
- Exhibit 79: Chart on North America - Year-over-year growth 2022-2027 (%)
- Exhibit 80: Data Table on North America - Year-over-year growth 2022-2027 (%)
- 9.5 Europe - Market size and forecast 2022-2027
- Exhibit 81: Chart on Europe - Market size and forecast 2022-2027 ($ billion)
- Exhibit 82: Data Table on Europe - Market size and forecast 2022-2027 ($ billion)
- Exhibit 83: Chart on Europe - Year-over-year growth 2022-2027 (%)
- Exhibit 84: Data Table on Europe - Year-over-year growth 2022-2027 (%)
- 9.6 South America - Market size and forecast 2022-2027
- Exhibit 85: Chart on South America - Market size and forecast 2022-2027 ($ billion)
- Exhibit 86: Data Table on South America - Market size and forecast 2022-2027 ($ billion)
- Exhibit 87: Chart on South America - Year-over-year growth 2022-2027 (%)
- Exhibit 88: Data Table on South America - Year-over-year growth 2022-2027 (%)
- 9.7 Middle East and Africa - Market size and forecast 2022-2027
- Exhibit 89: Chart on Middle East and Africa - Market size and forecast 2022-2027 ($ billion)
- Exhibit 90: Data Table on Middle East and Africa - Market size and forecast 2022-2027 ($ billion)
- Exhibit 91: Chart on Middle East and Africa - Year-over-year growth 2022-2027 (%)
- Exhibit 92: Data Table on Middle East and Africa - Year-over-year growth 2022-2027 (%)
- 9.8 US - Market size and forecast 2022-2027
- Exhibit 93: Chart on US - Market size and forecast 2022-2027 ($ billion)
- Exhibit 94: Data Table on US - Market size and forecast 2022-2027 ($ billion)
- Exhibit 95: Chart on US - Year-over-year growth 2022-2027 (%)
- Exhibit 96: Data Table on US - Year-over-year growth 2022-2027 (%)
- 9.9 China - Market size and forecast 2022-2027
- Exhibit 97: Chart on China - Market size and forecast 2022-2027 ($ billion)
- Exhibit 98: Data Table on China - Market size and forecast 2022-2027 ($ billion)
- Exhibit 99: Chart on China - Year-over-year growth 2022-2027 (%)
- Exhibit 100: Data Table on China - Year-over-year growth 2022-2027 (%)
- 9.10 UK - Market size and forecast 2022-2027
- Exhibit 101: Chart on UK - Market size and forecast 2022-2027 ($ billion)
- Exhibit 102: Data Table on UK - Market size and forecast 2022-2027 ($ billion)
- Exhibit 103: Chart on UK - Year-over-year growth 2022-2027 (%)
- Exhibit 104: Data Table on UK - Year-over-year growth 2022-2027 (%)
- 9.11 Japan - Market size and forecast 2022-2027
- Exhibit 105: Chart on Japan - Market size and forecast 2022-2027 ($ billion)
- Exhibit 106: Data Table on Japan - Market size and forecast 2022-2027 ($ billion)
- Exhibit 107: Chart on Japan - Year-over-year growth 2022-2027 (%)
- Exhibit 108: Data Table on Japan - Year-over-year growth 2022-2027 (%)
- 9.12 Germany - Market size and forecast 2022-2027
- Exhibit 109: Chart on Germany - Market size and forecast 2022-2027 ($ billion)
- Exhibit 110: Data Table on Germany - Market size and forecast 2022-2027 ($ billion)
- Exhibit 111: Chart on Germany - Year-over-year growth 2022-2027 (%)
- Exhibit 112: Data Table on Germany - Year-over-year growth 2022-2027 (%)
- 9.13 Market opportunity by geography
- Exhibit 113: Market opportunity by geography ($ billion)
10 Drivers, Challenges, and Trends
- 10.1 Market drivers
- 10.2 Market challenges
- 10.3 Impact of drivers and challenges
- Exhibit 114: Impact of drivers and challenges in 2022 and 2027
- 10.4 Market trends
11 Vendor Landscape
- 11.1 Overview
- 11.2 Vendor landscape
- Exhibit 115: Overview on Criticality of inputs and Factors of differentiation
- 11.3 Landscape disruption
- Exhibit 116: Overview on factors of disruption
- 11.4 Industry risks
- Exhibit 117: Impact of key risks on business
12 Vendor Analysis
- 12.1 Vendors covered
- Exhibit 118: Vendors covered
- 12.2 Market positioning of vendors
- Exhibit 119: Matrix on vendor position and classification
- 12.3 Allen Communication Learning Services
- Exhibit 120: Allen Communication Learning Services - Overview
- Exhibit 121: Allen Communication Learning Services - Product / Service
- Exhibit 122: Allen Communication Learning Services - Key offerings
- 12.4 ASLAN Training and Development LLC
- Exhibit 123: ASLAN Training and Development LLC - Overview
- Exhibit 124: ASLAN Training and Development LLC - Product / Service
- Exhibit 125: ASLAN Training and Development LLC - Key offerings
- 12.5 Brainshark Inc.
- Exhibit 126: Brainshark Inc. - Overview
- Exhibit 127: Brainshark Inc. - Product / Service
- Exhibit 128: Brainshark Inc. - Key offerings
- 12.6 CommLab India LLP
- Exhibit 129: CommLab India LLP - Overview
- Exhibit 130: CommLab India LLP - Product / Service
- Exhibit 131: CommLab India LLP - Key offerings
- 12.7 Cornerstone OnDemand Inc.
- Exhibit 132: Cornerstone OnDemand Inc. - Overview
- Exhibit 133: Cornerstone OnDemand Inc. - Product / Service
- Exhibit 134: Cornerstone OnDemand Inc. - Key offerings
- 12.8 Corporate Visions Inc.
- Exhibit 135: Corporate Visions Inc. - Overview
- Exhibit 136: Corporate Visions Inc. - Product / Service
- Exhibit 137: Corporate Visions Inc. - Key offerings
- 12.9 GMetri Inc.
- Exhibit 138: GMetri Inc. - Overview
- Exhibit 139: GMetri Inc. - Product / Service
- Exhibit 140: GMetri Inc. - Key offerings
- 12.10 Korn Ferry
- Exhibit 141: Korn Ferry - Overview
- Exhibit 142: Korn Ferry - Business segments
- Exhibit 143: Korn Ferry - Key offerings
- Exhibit 144: Korn Ferry - Segment focus
- 12.11 Learning Technologies Group Plc
- Exhibit 145: Learning Technologies Group Plc - Overview
- Exhibit 146: Learning Technologies Group Plc - Business segments
- Exhibit 147: Learning Technologies Group Plc - Key news
- Exhibit 148: Learning Technologies Group Plc - Key offerings
- Exhibit 149: Learning Technologies Group Plc - Segment focus
- 12.12 RAIN Group
- Exhibit 150: RAIN Group - Overview
- Exhibit 151: RAIN Group - Product / Service
- Exhibit 152: RAIN Group - Key offerings
- 12.13 Richardson Sales Performance
- Exhibit 153: Richardson Sales Performance - Overview
- Exhibit 154: Richardson Sales Performance - Product / Service
- Exhibit 155: Richardson Sales Performance - Key offerings
- 12.14 Sandler Systems Inc.
- Exhibit 156: Sandler Systems Inc. - Overview
- Exhibit 157: Sandler Systems Inc. - Product / Service
- Exhibit 158: Sandler Systems Inc. - Key offerings
- 12.15 The Brooks Group
- Exhibit 159: The Brooks Group - Overview
- Exhibit 160: The Brooks Group - Product / Service
- Exhibit 161: The Brooks Group - Key offerings
- 12.16 VirtualSpeech Ltd.
- Exhibit 162: VirtualSpeech Ltd. - Overview
- Exhibit 163: VirtualSpeech Ltd. - Product / Service
- Exhibit 164: VirtualSpeech Ltd. - Key offerings
- 12.17 Wilson Learning Worldwide Inc.
- Exhibit 165: Wilson Learning Worldwide Inc. - Overview
- Exhibit 166: Wilson Learning Worldwide Inc. - Business segments
- Exhibit 167: Wilson Learning Worldwide Inc. - Key offerings
- Exhibit 168: Wilson Learning Worldwide Inc. - Segment focus
13 Appendix
- 13.1 Scope of the report
- 13.2 Inclusions and exclusions checklist
- Exhibit 169: Inclusions checklist
- Exhibit 170: Exclusions checklist
- 13.3 Currency conversion rates for US$
- Exhibit 171: Currency conversion rates for US$
- 13.4 Research methodology
- Exhibit 172: Research methodology
- Exhibit 173: Validation techniques employed for market sizing
- Exhibit 174: Information sources
- 13.5 List of abbreviations
- Exhibit 175: List of abbreviations
Research Framework
Technavio presents a detailed picture of the market by way of study, synthesis, and summation of data from multiple sources. The analysts have presented the various facets of the market with a particular focus on identifying the key industry influencers. The data thus presented is comprehensive, reliable, and the result of extensive research, both primary and secondary.
INFORMATION SOURCES
Primary sources
- Manufacturers and suppliers
- Channel partners
- Industry experts
- Strategic decision makers
Secondary sources
- Industry journals and periodicals
- Government data
- Financial reports of key industry players
- Historical data
- Press releases
DATA ANALYSIS
Data Synthesis
- Collation of data
- Estimation of key figures
- Analysis of derived insights
Data Validation
- Triangulation with data models
- Reference against proprietary databases
- Corroboration with industry experts
REPORT WRITING
Qualitative
- Market drivers
- Market challenges
- Market trends
- Five forces analysis
Quantitative
- Market size and forecast
- Market segmentation
- Geographical insights
- Competitive landscape
PURCHASE FULL REPORT OF
product-based sales training market market
Key Questions Answered
- What are the key global market and the regional market share?
- What are the revenue-generating key market segments?
- What are the key factors driving and challenging this market’s growth?
- Who are the key market vendors and their growth strategies?
- What are the latest trends influencing the growth of this market?
- What are the variables influencing the market growth in the primary regions?
- What are the factors influencing the growth of the parent market?
Why should you prefer Technavio's market insights report?
- Off-the-shelf research reports
- Reports can be tailored to meet the customer's needs
- Trusted by more than 100 fortune 500 organizations
- Information about the market's key drivers, trends, and challenges
- Parent market analysis
- Every week, 50,000 people visit our subscription platform
- Detailed vendors report with competitive landscape
- Covid-19 impact and recovery analysis
- Data on revenue-generating market segments
- Details on the market shares of various regions
- Five-force market analysis