Slot Machine Market Analysis Europe, North America, APAC, South America, Middle East and Africa - US, China, UK, Italy, France - Size and Forecast 2023-2027
| Published: Mar 2023 | Pages: 158 | SKU: IRTNTR40412 |
Slot Machine Market Report 2023-2027
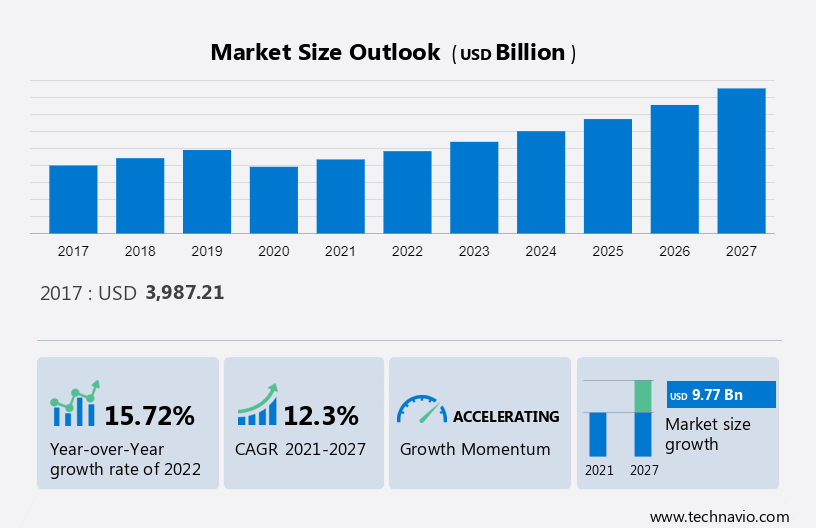
The slot machine market size is projected to reach a value of USD 8.50 billion in 2027 with a CAGR of 12.3% between 2022 and 2027
| Analysis Period | 2017-2027 |
| Market Size (2017) Historic Year | USD 3.99 billion |
| Market Size (2027) - Forecasted Year | USD 8.50 billion |
| Historic Opportunity (2017-2021) | USD 0.36 billion |
| Historic CAGR | 2.15% |
| Forecasted Opportunity (2023-2027) | USD 9.77 billion |
| Market Opportunity Transformation Growth | 113.37% |
| Market Opportunity Capitalization | USD 10.12 billion |
Our report offers in-depth analysis of market drivers, trends, opportunities, and challenges, with segmentation by Application (casino and others), Product (digital and mechanical), and Geography (Europe, North America, APAC, South America, and Middle East and Africa). Additionally, Technavio provides valuable insights through value chain analysis, parent market analysis, Porter’s Five analysis, vendor analysis, and COVID-19 impact data. The report also includes a thorough analysis of historical market data from 2017 to 2022.
Get Additional Information on this Report, Request Free Sample in PDF
Slot Machine Market Analysis and Insights
The growing vendor involvement in the market is notably driving the market growth. The market's vendors are taking advantage of the numerous opportunities presented by the increase in casinos by offering products and solutions to facilitate casino gambling. Market players are putting more and more emphasis on launching new products to diversify their product offerings. For instance, in January 2020, Scientific Games launched the Ultra Hot Mega Link slot game.
Launching new products aids slot machine vendors in boosting sales, which aids in growing their market share. By releasing new slot machine variants with enhanced features, the market's vendors hope to draw in more customers. Vendors are also spending more money on R&D in order to offer customers products that are cutting edge, of the highest quality, and satisfy their changing needs. Thus, the introduction of new models helps increase sales, which will positively influence the growth of the global market during the forecast period.
The use of bitcoins in gambling is an emerging trend in the market. A decentralized, digital currency known as bitcoin is used for online transactions. High levels of anonymity are offered, and central banks are not in charge of overseeing it. Users who use bitcoins for gambling are not required to provide any personal information. Compared to traditional currencies, bitcoins have a number of benefits, including international payments, simple deposits and withdrawals, reduced fraud risk, quick payments, and no transaction fees. Some of the casinos supporting bitcoin transactions are Golden Gate and D Las Vegas in Las Vegas, the US. These casinos accept digital currency and convert bitcoins into dollars immediately. The patrons are then provided with coins or tokens to be used in slot machines.
As gambling is becoming more and more popular, it is likely that the trend of using bitcoins for gambling will grow during the forecast period. Furthermore, customers and vendors will be encouraged to use bitcoins for gambling games, like slot machines owing to the high monetary fluctuations and taxes on the gambling industry. Hence, these factors will drive market growth during the forecast period.
The rising number of fraud cases is a major challenge impeding the market growth during the forecast period. Illegal activities pose a serious threat to the entire gaming and gambling industry because they could drain sizable amounts of bets from the regulated gambling sector. Slot machine tampering is very common among casino owners. To remove all betting options other than the maximum and minimum bet amounts, casino owners also modify IGT Blue Chip gaming machines.
Additionally, instances of gray machines, or unregulated slot machines, have been documented. Gas stations, veterans' homes, union halls, and fraternal lodges all have these machines installed. Due to their exclusion from the gambling industry, these machines are not subject to any gambling taxes or fees. Hence, the gambling industry's ability to generate revenue is threatened by the presence of gray machines. Government revenue will be also reduced if people choose to use the machines rather than play the lottery or visit a casino. Therefore, such factors are expected to negatively affect the expansion of the global market during the forecast period.
Slot Machine Market Segmentation
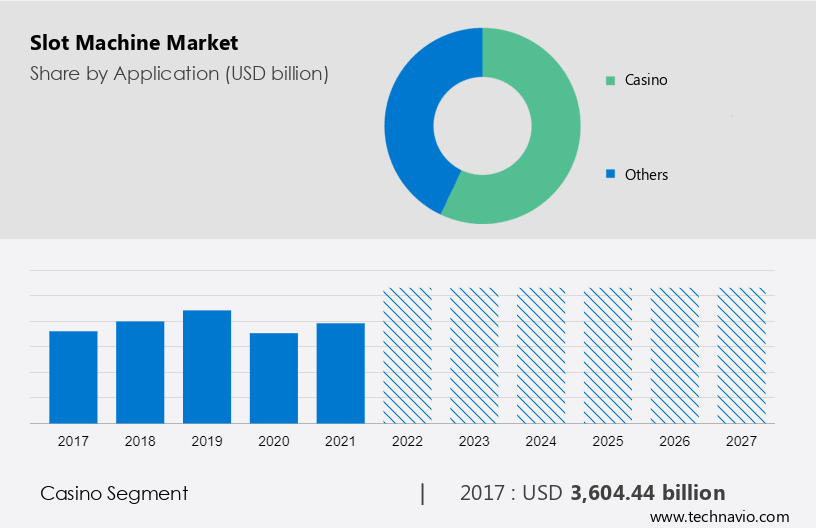
The market share growth by the casino segment will be significant during the forecast period. The casino sector is where slot machines are used the most frequently. Since slot machines are the most popular casino game, market analysts anticipate significant market growth during the forecast period.
Slot Machine Market
By Application
Get a glance at the market contribution of various segments Request Free Sample
The casino segment was valued at USD 3,604.44 million in 2017 and continued to grow until 2021. The expansion of casinos as entertainment venues and the casino industry in regions like North America, Europe, and APAC are factors driving the demand for slot machines. Furthermore, the release of cutting-edge slot machines with features like virtual reality, touchscreens, and mobile connectivity is also contributing to the market's growth. By utilizing these technologies, players' gaming experiences are being enhanced, which is also increasing the number of visitors to casinos. Additionally, it is expected that the legalization of online casinos in several countries and the rising popularity of online gambling will increase demand for slot machines in the casino industry. Hence, these factors are expected to augment the demand for slot machines from the casino application segment and hence, will drive the growth of the market in focus during the forecast period.
Europe is estimated to contribute 35% to the growth of the global market during the forecast period. Technavio’s analysts have elaborately explained the regional trends and drivers that shape the market during the forecast period.
Slot Machine Market
By Europe
For more insights on the market share of various regions Request Free Samples
European nations like the UK, Germany, Italy, Spain, Sweden, Poland, the Netherlands, Morocco, and Ireland are primarily responsible for the market's expansion. The shifting regulatory environment in European nations is primarily responsible for driving the slot machine market. To loosen gambling laws, European governments have created a number of rules and regulations. For example, the European Union (EU) lays out regulations that its member states must follow to ensure that gambling is carried out fairly and openly and that customers are protected from fraud and exploitation. The introduction of new gambling services, such as slot machines, in Europe, is another factor in the rising demand for gambling. A number of market players are introducing new services and growing their brands in nations like Portugal, the UK, Sweden, Germany, and Spain. Therefore, owing to such factors the regional market is expected to grow during the forecast period.
Slot Machine Market Customer Landscape
The market research report includes the adoption lifecycle of the market, covering from the innovator’s stage to the laggard’s stage. It focuses on adoption rates in different regions based on penetration. Furthermore, the report also includes key purchase criteria and drivers of price sensitivity to help companies evaluate and develop their growth strategies.
Segment Overview
The slot machine market report forecasts market growth by revenue at global, regional & country levels and provides an analysis of the latest trends and growth opportunities from 2017 to 2027.
- Application Outlook (USD Million, 2017 - 2027)
- Casino
- Others
- Product Outlook (USD Million, 2017 - 2027)
- Digital
- Mechanical
- Region Outlook (USD Million, 2017 - 2027)
- North America
- The U.S.
- Canada
- Europe
- The U.K.
- Germany
- France
- Rest of Europe
- APAC
- China
- India
- Middle East & Africa
- Saudi Arabia
- South Africa
- Rest of the Middle East & Africa
- South America
- Chile
- Brazil
- Argentina
- North America
|
Slot Machine Market Scope |
|
|
Report Coverage |
Details |
|
Page number |
158 |
|
Base year |
2022 |
|
Historic period |
2018 - 2022 |
|
Forecast period |
2023-2027 |
|
Growth momentum & CAGR |
Accelerate at a CAGR of 12.3% |
|
Market growth 2023-2027 |
USD 9.77 billion |
|
Market structure |
Fragmented |
|
YoY growth 2022-2023(%) |
15.72 |
|
Regional analysis |
Europe, North America, APAC, South America, and Middle East and Africa |
|
Performing market contribution |
Europe at 35% |
|
Key countries |
US, China, UK, Italy, and France |
|
Competitive landscape |
Leading Companies, Market Positioning of Companies, Competitive Strategies, and Industry Risks |
|
Key companies profiled |
AMATIC Industries GmbH, APOLLO SOFT s.r.o., Aries Technology LLC, Aristocrat Leisure Ltd., Aruze Gaming America Inc., Eclipse Gaming Systems, Everi Holdings Inc., Incredible Technologies Inc., Inspired Entertainment Inc., Interblock dd, International Game Technology plc, JPM Interactive Ltd., Konami Group Corp., NOVOMATIC AG, PlayAGS Inc., Recreativos Franco SAU, Scientific Games LLC, Universal Entertainment Corp., Accel Entertainment Inc., and APEX pro gaming s.r.o |
|
Market dynamics |
Parent market analysis, Market growth inducers and obstacles, Fast-growing and slow-growing segment analysis, COVID 19 impact and recovery analysis and future consumer dynamics, Market condition analysis for forecast period |
|
Customization purview |
If our report has not included the data that you are looking for, you can reach out to our analysts and get segments customized. |
What are the Key Data Covered in this Slot Machine Market Research Report?
- CAGR of the market during the forecast period
- Detailed information on factors that will drive the growth of the market between 2023 and 2027
- Precise estimation of the size of the market size and its contribution of the market in focus to the parent market
- Accurate predictions about upcoming trends and changes in consumer behaviour
- Growth of the market industry across Europe, North America, APAC, South America, and Middle East and Africa
- Thorough analysis of the market’s competitive landscape and detailed information about companies
- Comprehensive analysis of factors that will challenge the growth of market companies
We can help! Our analysts can customize this market research report to meet your requirements.
1 Executive Summary
- 1.1 Market overview
- Exhibit 01: Executive Summary – Chart on Market Overview
- Exhibit 02: Executive Summary – Data Table on Market Overview
- Exhibit 03: Executive Summary – Chart on Global Market Characteristics
- Exhibit 04: Executive Summary – Chart on Market by Geography
- Exhibit 05: Executive Summary – Chart on Market Segmentation by Application
- Exhibit 06: Executive Summary – Chart on Market Segmentation by Product
- Exhibit 07: Executive Summary – Chart on Incremental Growth
- Exhibit 08: Executive Summary – Data Table on Incremental Growth
- Exhibit 09: Executive Summary – Chart on Vendor Market Positioning
2 Market Landscape
- 2.1 Market ecosystem
- Exhibit 10: Parent market
- Exhibit 11: Market Characteristics
3 Market Sizing
- 3.1 Market definition
- Exhibit 12: Offerings of vendors included in the market definition
- 3.2 Market segment analysis
- Exhibit 13: Market segments
- 3.3 Market size 2022
- 3.4 Market outlook: Forecast for 2022-2027
- Exhibit 14: Chart on Global - Market size and forecast 2022-2027 ($ billion)
- Exhibit 15: Data Table on Global - Market size and forecast 2022-2027 ($ billion)
- Exhibit 16: Chart on Global Market: Year-over-year growth 2022-2027 (%)
- Exhibit 17: Data Table on Global Market: Year-over-year growth 2022-2027 (%)
4 Historic Market Size
- 4.1 Global slot machine market 2017 - 2021
- Exhibit 18: Historic Market Size – Data Table on Global slot machine market 2017 - 2021 ($ billion)
- 4.2 Application Segment Analysis 2017 - 2021
- Exhibit 19: Historic Market Size – Application Segment 2017 - 2021 ($ billion)
- 4.3 Product Segment Analysis 2017 - 2021
- Exhibit 20: Historic Market Size – Product Segment 2017 - 2021 ($ billion)
- 4.4 Geography Segment Analysis 2017 - 2021
- Exhibit 21: Historic Market Size – Geography Segment 2017 - 2021 ($ billion)
- 4.5 Country Segment Analysis 2017 - 2021
- Exhibit 22: Historic Market Size – Country Segment 2017 - 2021 ($ billion)
5 Five Forces Analysis
- 5.1 Five forces summary
- Exhibit 23: Five forces analysis - Comparison between 2022 and 2027
- 5.2 Bargaining power of buyers
- Exhibit 24: Chart on Bargaining power of buyers – Impact of key factors 2022 and 2027
- 5.3 Bargaining power of suppliers
- Exhibit 25: Bargaining power of suppliers – Impact of key factors in 2022 and 2027
- 5.4 Threat of new entrants
- Exhibit 26: Threat of new entrants – Impact of key factors in 2022 and 2027
- 5.5 Threat of substitutes
- Exhibit 27: Threat of substitutes – Impact of key factors in 2022 and 2027
- 5.6 Threat of rivalry
- Exhibit 28: Threat of rivalry – Impact of key factors in 2022 and 2027
- 5.7 Market condition
- Exhibit 29: Chart on Market condition - Five forces 2022 and 2027
6 Market Segmentation by Application
- 6.1 Market segments
- Exhibit 30: Chart on Application - Market share 2022-2027 (%)
- Exhibit 31: Data Table on Application - Market share 2022-2027 (%)
- 6.2 Comparison by Application
- Exhibit 32: Chart on Comparison by Application
- Exhibit 33: Data Table on Comparison by Application
- 6.3 Casino - Market size and forecast 2022-2027
- Exhibit 34: Chart on Casino - Market size and forecast 2022-2027 ($ billion)
- Exhibit 35: Data Table on Casino - Market size and forecast 2022-2027 ($ billion)
- Exhibit 36: Chart on Casino - Year-over-year growth 2022-2027 (%)
- Exhibit 37: Data Table on Casino - Year-over-year growth 2022-2027 (%)
- 6.4 Others - Market size and forecast 2022-2027
- Exhibit 38: Chart on Others - Market size and forecast 2022-2027 ($ billion)
- Exhibit 39: Data Table on Others - Market size and forecast 2022-2027 ($ billion)
- Exhibit 40: Chart on Others - Year-over-year growth 2022-2027 (%)
- Exhibit 41: Data Table on Others - Year-over-year growth 2022-2027 (%)
- 6.5 Market opportunity by Application
- Exhibit 42: Market opportunity by Application ($ billion)
- Exhibit 43: Data Table on Market opportunity by Application ($ billion)
7 Market Segmentation by Product
- 7.1 Market segments
- Exhibit 44: Chart on Product - Market share 2022-2027 (%)
- Exhibit 45: Data Table on Product - Market share 2022-2027 (%)
- 7.2 Comparison by Product
- Exhibit 46: Chart on Comparison by Product
- Exhibit 47: Data Table on Comparison by Product
- 7.3 Digital - Market size and forecast 2022-2027
- Exhibit 48: Chart on Digital - Market size and forecast 2022-2027 ($ billion)
- Exhibit 49: Data Table on Digital - Market size and forecast 2022-2027 ($ billion)
- Exhibit 50: Chart on Digital - Year-over-year growth 2022-2027 (%)
- Exhibit 51: Data Table on Digital - Year-over-year growth 2022-2027 (%)
- 7.4 Mechanical - Market size and forecast 2022-2027
- Exhibit 52: Chart on Mechanical - Market size and forecast 2022-2027 ($ billion)
- Exhibit 53: Data Table on Mechanical - Market size and forecast 2022-2027 ($ billion)
- Exhibit 54: Chart on Mechanical - Year-over-year growth 2022-2027 (%)
- Exhibit 55: Data Table on Mechanical - Year-over-year growth 2022-2027 (%)
- 7.5 Market opportunity by Product
- Exhibit 56: Market opportunity by Product ($ billion)
- Exhibit 57: Data Table on Market opportunity by Product ($ billion)
8 Customer Landscape
- 8.1 Customer landscape overview
- Exhibit 58: Analysis of price sensitivity, lifecycle, customer purchase basket, adoption rates, and purchase criteria
9 Geographic Landscape
- 9.1 Geographic segmentation
- Exhibit 59: Chart on Market share by geography 2022-2027 (%)
- Exhibit 60: Data Table on Market share by geography 2022-2027 (%)
- 9.2 Geographic comparison
- Exhibit 61: Chart on Geographic comparison
- Exhibit 62: Data Table on Geographic comparison
- 9.3 Europe - Market size and forecast 2022-2027
- Exhibit 63: Chart on Europe - Market size and forecast 2022-2027 ($ billion)
- Exhibit 64: Data Table on Europe - Market size and forecast 2022-2027 ($ billion)
- Exhibit 65: Chart on Europe - Year-over-year growth 2022-2027 (%)
- Exhibit 66: Data Table on Europe - Year-over-year growth 2022-2027 (%)
- 9.4 North America - Market size and forecast 2022-2027
- Exhibit 67: Chart on North America - Market size and forecast 2022-2027 ($ billion)
- Exhibit 68: Data Table on North America - Market size and forecast 2022-2027 ($ billion)
- Exhibit 69: Chart on North America - Year-over-year growth 2022-2027 (%)
- Exhibit 70: Data Table on North America - Year-over-year growth 2022-2027 (%)
- 9.5 APAC - Market size and forecast 2022-2027
- Exhibit 71: Chart on APAC - Market size and forecast 2022-2027 ($ billion)
- Exhibit 72: Data Table on APAC - Market size and forecast 2022-2027 ($ billion)
- Exhibit 73: Chart on APAC - Year-over-year growth 2022-2027 (%)
- Exhibit 74: Data Table on APAC - Year-over-year growth 2022-2027 (%)
- 9.6 South America - Market size and forecast 2022-2027
- Exhibit 75: Chart on South America - Market size and forecast 2022-2027 ($ billion)
- Exhibit 76: Data Table on South America - Market size and forecast 2022-2027 ($ billion)
- Exhibit 77: Chart on South America - Year-over-year growth 2022-2027 (%)
- Exhibit 78: Data Table on South America - Year-over-year growth 2022-2027 (%)
- 9.7 Middle East and Africa - Market size and forecast 2022-2027
- Exhibit 79: Chart on Middle East and Africa - Market size and forecast 2022-2027 ($ billion)
- Exhibit 80: Data Table on Middle East and Africa - Market size and forecast 2022-2027 ($ billion)
- Exhibit 81: Chart on Middle East and Africa - Year-over-year growth 2022-2027 (%)
- Exhibit 82: Data Table on Middle East and Africa - Year-over-year growth 2022-2027 (%)
- 9.8 US - Market size and forecast 2022-2027
- Exhibit 83: Chart on US - Market size and forecast 2022-2027 ($ billion)
- Exhibit 84: Data Table on US - Market size and forecast 2022-2027 ($ billion)
- Exhibit 85: Chart on US - Year-over-year growth 2022-2027 (%)
- Exhibit 86: Data Table on US - Year-over-year growth 2022-2027 (%)
- 9.9 China - Market size and forecast 2022-2027
- Exhibit 87: Chart on China - Market size and forecast 2022-2027 ($ billion)
- Exhibit 88: Data Table on China - Market size and forecast 2022-2027 ($ billion)
- Exhibit 89: Chart on China - Year-over-year growth 2022-2027 (%)
- Exhibit 90: Data Table on China - Year-over-year growth 2022-2027 (%)
- 9.10 UK - Market size and forecast 2022-2027
- Exhibit 91: Chart on UK - Market size and forecast 2022-2027 ($ billion)
- Exhibit 92: Data Table on UK - Market size and forecast 2022-2027 ($ billion)
- Exhibit 93: Chart on UK - Year-over-year growth 2022-2027 (%)
- Exhibit 94: Data Table on UK - Year-over-year growth 2022-2027 (%)
- 9.11 Italy - Market size and forecast 2022-2027
- Exhibit 95: Chart on Italy - Market size and forecast 2022-2027 ($ billion)
- Exhibit 96: Data Table on Italy - Market size and forecast 2022-2027 ($ billion)
- Exhibit 97: Chart on Italy - Year-over-year growth 2022-2027 (%)
- Exhibit 98: Data Table on Italy - Year-over-year growth 2022-2027 (%)
- 9.12 France - Market size and forecast 2022-2027
- Exhibit 99: Chart on France - Market size and forecast 2022-2027 ($ billion)
- Exhibit 100: Data Table on France - Market size and forecast 2022-2027 ($ billion)
- Exhibit 101: Chart on France - Year-over-year growth 2022-2027 (%)
- Exhibit 102: Data Table on France - Year-over-year growth 2022-2027 (%)
- 9.13 Market opportunity by geography
- Exhibit 103: Market opportunity by geography ($ billion)
- Exhibit 104: Data Tables on Market opportunity by geography ($ billion)
10 Drivers, Challenges, and Trends
- 10.1 Market drivers
- 10.2 Market challenges
- 10.3 Impact of drivers and challenges
- Exhibit 105: Impact of drivers and challenges in 2022 and 2027
- 10.4 Market trends
11 Vendor Landscape
- 11.1 Overview
- 11.2 Vendor landscape
- Exhibit 106: Overview on Criticality of inputs and Factors of differentiation
- 11.3 Landscape disruption
- Exhibit 107: Overview on factors of disruption
- 11.4 Industry risks
- Exhibit 108: Impact of key risks on business
12 Vendor Analysis
- 12.1 Vendors covered
- Exhibit 109: Vendors covered
- 12.2 Market positioning of vendors
- Exhibit 110: Matrix on vendor position and classification
- 12.3 Accel Entertainment Inc.
- Exhibit 111: Accel Entertainment Inc. - Overview
- Exhibit 112: Accel Entertainment Inc. - Product / Service
- Exhibit 113: Accel Entertainment Inc. - Key offerings
- 12.4 AMATIC Industries GmbH
- Exhibit 114: AMATIC Industries GmbH - Overview
- Exhibit 115: AMATIC Industries GmbH - Product / Service
- Exhibit 116: AMATIC Industries GmbH - Key offerings
- 12.5 APEX pro gaming s.r.o
- Exhibit 117: APEX pro gaming s.r.o - Overview
- Exhibit 118: APEX pro gaming s.r.o - Product / Service
- Exhibit 119: APEX pro gaming s.r.o - Key offerings
- 12.6 APOLLO SOFT s.r.o.
- Exhibit 120: APOLLO SOFT s.r.o. - Overview
- Exhibit 121: APOLLO SOFT s.r.o. - Product / Service
- Exhibit 122: APOLLO SOFT s.r.o. - Key offerings
- 12.7 Aristocrat Leisure Ltd.
- Exhibit 123: Aristocrat Leisure Ltd. - Overview
- Exhibit 124: Aristocrat Leisure Ltd. - Business segments
- Exhibit 125: Aristocrat Leisure Ltd. - Key offerings
- Exhibit 126: Aristocrat Leisure Ltd. - Segment focus
- 12.8 Aruze Gaming America Inc.
- Exhibit 127: Aruze Gaming America Inc. - Overview
- Exhibit 128: Aruze Gaming America Inc. - Product / Service
- Exhibit 129: Aruze Gaming America Inc. - Key offerings
- 12.9 Eclipse Gaming Systems
- Exhibit 130: Eclipse Gaming Systems - Overview
- Exhibit 131: Eclipse Gaming Systems - Product / Service
- Exhibit 132: Eclipse Gaming Systems - Key offerings
- 12.10 Everi Holdings Inc.
- Exhibit 133: Everi Holdings Inc. - Overview
- Exhibit 134: Everi Holdings Inc. - Business segments
- Exhibit 135: Everi Holdings Inc. - Key offerings
- Exhibit 136: Everi Holdings Inc. - Segment focus
- 12.11 Incredible Technologies Inc.
- Exhibit 137: Incredible Technologies Inc. - Overview
- Exhibit 138: Incredible Technologies Inc. - Product / Service
- Exhibit 139: Incredible Technologies Inc. - Key offerings
- 12.12 Inspired Entertainment Inc.
- Exhibit 140: Inspired Entertainment Inc. - Overview
- Exhibit 141: Inspired Entertainment Inc. - Product / Service
- Exhibit 142: Inspired Entertainment Inc. - Key offerings
- 12.13 International Game Technology plc
- Exhibit 143: International Game Technology plc - Overview
- Exhibit 144: International Game Technology plc - Business segments
- Exhibit 145: International Game Technology plc - Key offerings
- Exhibit 146: International Game Technology plc - Segment focus
- 12.14 Konami Group Corp.
- Exhibit 147: Konami Group Corp. - Overview
- Exhibit 148: Konami Group Corp. - Business segments
- Exhibit 149: Konami Group Corp. - Key offerings
- Exhibit 150: Konami Group Corp. - Segment focus
- 12.15 NOVOMATIC AG
- Exhibit 151: NOVOMATIC AG - Overview
- Exhibit 152: NOVOMATIC AG - Business segments
- Exhibit 153: NOVOMATIC AG - Key offerings
- Exhibit 154: NOVOMATIC AG - Segment focus
- 12.16 Scientific Games LLC
- Exhibit 155: Scientific Games LLC - Overview
- Exhibit 156: Scientific Games LLC - Business segments
- Exhibit 157: Scientific Games LLC - Key offerings
- Exhibit 158: Scientific Games LLC - Segment focus
- 12.17 Universal Entertainment Corp.
- Exhibit 159: Universal Entertainment Corp. - Overview
- Exhibit 160: Universal Entertainment Corp. - Business segments
- Exhibit 161: Universal Entertainment Corp. - Key offerings
- Exhibit 162: Universal Entertainment Corp. - Segment focus
13 Appendix
- 13.1 Scope of the report
- 13.2 Inclusions and exclusions checklist
- Exhibit 163: Inclusions checklist
- Exhibit 164: Exclusions checklist
- 13.3 Currency conversion rates for US$
- Exhibit 165: Currency conversion rates for US$
- 13.4 Research methodology
- Exhibit 166: Research methodology
- Exhibit 167: Validation techniques employed for market sizing
- Exhibit 168: Information sources
- 13.5 List of abbreviations
- Exhibit 169: List of abbreviations
Research Framework
Technavio presents a detailed picture of the market by way of study, synthesis, and summation of data from multiple sources. The analysts have presented the various facets of the market with a particular focus on identifying the key industry influencers. The data thus presented is comprehensive, reliable, and the result of extensive research, both primary and secondary.
INFORMATION SOURCES
Primary sources
- Manufacturers and suppliers
- Channel partners
- Industry experts
- Strategic decision makers
Secondary sources
- Industry journals and periodicals
- Government data
- Financial reports of key industry players
- Historical data
- Press releases
DATA ANALYSIS
Data Synthesis
- Collation of data
- Estimation of key figures
- Analysis of derived insights
Data Validation
- Triangulation with data models
- Reference against proprietary databases
- Corroboration with industry experts
REPORT WRITING
Qualitative
- Market drivers
- Market challenges
- Market trends
- Five forces analysis
Quantitative
- Market size and forecast
- Market segmentation
- Geographical insights
- Competitive landscape
PURCHASE FULL REPORT OF
slot machine market
Key Questions Answered
- What are the key global market and the regional market share?
- What are the revenue-generating key market segments?
- What are the key factors driving and challenging this market’s growth?
- Who are the key market vendors and their growth strategies?
- What are the latest trends influencing the growth of this market?
- What are the variables influencing the market growth in the primary regions?
- What are the factors influencing the growth of the parent market?
Why should you prefer Technavio's market insights report?
- Off-the-shelf research reports
- Reports can be tailored to meet the customer's needs
- Trusted by more than 100 fortune 500 organizations
- Information about the market's key drivers, trends, and challenges
- Parent market analysis
- Every week, 50,000 people visit our subscription platform
- Detailed vendors report with competitive landscape
- Covid-19 impact and recovery analysis
- Data on revenue-generating market segments
- Details on the market shares of various regions
- Five-force market analysis