Smart Stadium Market Analysis Europe, North America, APAC, South America, Middle East and Africa - US, China, Japan, UK, Germany - Size and Forecast 2024-2028
| Published: Nov 2023 | Pages: 179 | SKU: IRTNTR41112 |
Smart Stadium Market Report 2024-2028 :
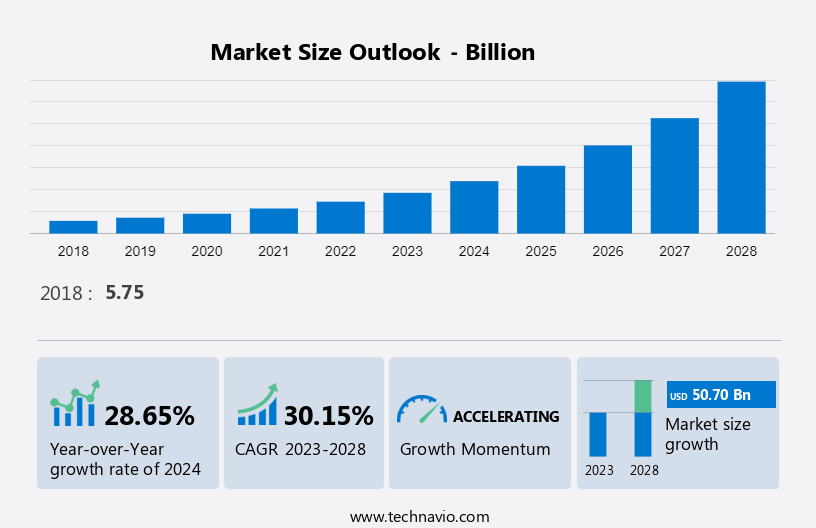
The smart stadium market size is estimated to grow by USD 50.70 billion at a CAGR of 30.15% between 2023 and 2028. The growth of the market depends on several factors, including improved operational efficiency, improved spectator experience and the increasing number of sporting events.
This market trends and analysis report extensively covers market segmentation by software (digital content management, building automation, stadium and public security, event management, and others), deployment (on-premises and cloud-based), and geography (Europe, North America, APAC, South America, and Middle East and Africa). It also includes an in-depth analysis of drivers, trends, and challenges. Furthermore, the market growth analysis report includes historic market data from 2018-2022.
What will be the Size of the Market During the Forecast Period?
For More Highlights About this Report, Download Free Sample in a Minute
Market Dynamics
The smart stadium market is witnessing dynamic growth driven by the demand for a modernized sports experience. Stadiums are adopting advanced technology capabilities, including high-definition video screens, wireless connectivity, and mobile apps, to provide an immersive and interactive experience for fans. Real-time statistics, social media engagement, and intelligent ticketing systems enhance the overall fan experience. Crowd management solutions, smart parking systems, and the integration of fan data enable a more efficient and secure environment.
However, the rise in the cost of implementation poses a challenge. To counter this, personalized approaches, tailored offers, promotions, and exclusive content help stadiums stay competitive while meeting fan preferences. Tournaments further fuel the market, emphasizing the need for continuous innovation.
Key Driver
Improved operational efficiency is notably driving the market growth. The implementation of smart stadium solutions has enabled stadium management authorities to improve their operating efficiency, optimize energy use, improve building management, increase automation, and improve crowd control. It has also enabled the management to monitor temperature throughout games and change it as per requirement. Likewise, the lighting conditions of smart lights used in smart stadiums can be changed based on the number of spectators, which further improves energy efficiency. Building management systems implemented in smart stadiums enable the monitoring of the entire stadium from a single console, which maximizes efficiency and reduces operating costs.
In addition, the integration of solutions with various departments, such as public transport and weather departments, can allow stadium management to display real-time data about the weather, traffic information, and schedules of public transport systems. This improves crowd control. Such advantages of solutions will drive their demand which in turn will drive the market during the forecast period.
Significant Trends
The emergence of augmented reality (AR) and modernized stadiums is an emerging trend shaping the market growth and trends. The growing presence of augmented reality is expected to gradually penetrate the domain of sports as well. Spectators can access augmented reality by downloading the AR application on their devices. The application helps improve the overall experience of the users at stadiums by enabling him/her to visualize individual players, granting access to various statistics related to the ongoing game, enabling a better understanding of decisions given by referees and umpires, and allowing him/her to watch action replays from various camera angles.
Additionally, augmented reality applications can be used by the stadium management for online auctions and selling of merchandise, thereby increasing revenue generation. Thus, the adoption of augmented reality results in interactive and enhanced spectator experience in stadiums and boosts revenue generation. Therefore, it is expected that augmented reality will have increasing applications in the field of smart stadiums which will propel the global market during the forecast period.
Major Restraint
The smart stadium market faces a significant challenge with the rising costs of implementation. As venues strive to embrace cutting-edge technologies like high-definition video screens, wireless connectivity, and intelligent ticketing systems, the financial burden escalates. Infrastructure upgrades and the integration of advanced features to enhance fan experiences contribute to the surge in expenses. Despite the unparalleled benefits these innovations bring, stakeholders must grapple with the economic implications. Striking a balance between delivering a tech-savvy environment and managing the costs becomes imperative to ensure the sustainability and continued growth of the smart stadium market. Adapting cost-effective strategies remains crucial in navigating this financial hurdle.
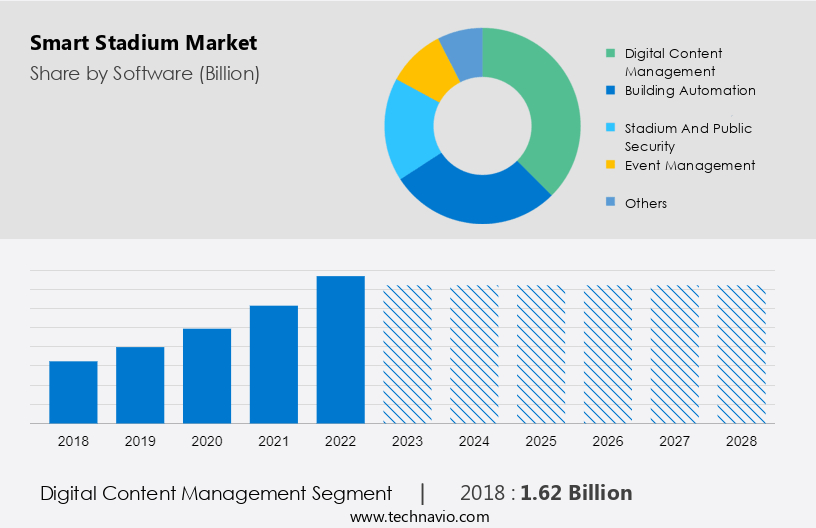
Segmentation By Software
The market share growth by the digital content management segment will be significant during the forecast period. The digital content management segment deals with video management, digital signage, and mobile content management. Video management enables the delivery of video content to all the video endpoints throughout the stadium. These video endpoints include electronic gadgets, such as smartphones and tablets, brought by spectators.
Get a glance at the market contribution of various segments Download the PDF Sample
The digital content management segment was the largest and was valued at USD 1.62 billion in 2018. Further, mobile content management systems deal with storing and delivering content to smartphones, tablets, and other mobile devices. These systems in stadiums allow spectators to view the content as requested by them. Also, stadium authorities use these systems and analytical tools to display personalized content and advertisements according to the interests of users. Such advantages are expected to propel the sales of digital content management software, thereby driving the global market during the forecast period.
Segmentation By Deployment
For on-premise deployment, software solutions are purchased and installed on the end-user's server and maintained by the IT specialists of the organization. The share of the segment is expected to decline during the forecast period due to the high cost of implementing and upgrading smart stadiums and limited options for scalability. On-premise solutions have features such as workflow streamlining. They provide organizations with complete control over their critical data. further, enterprises must purchase software licenses, maintain IT staff to manage software, regularly upgrade software, and install data protection solutions to use on-premise information software solutions. They must also train their employees. Hence, they need high capital investments. Therefore, several small and medium-scale organizations are adopting cloud-based information software solutions. Some drawbacks of on-premise information software solutions include: Updating the software is difficult and time-consuming and lack of agility in rearchitecting solutions. Owing to these drawbacks, the on-premise segment of the market will grow at a moderate rate during the forecast period.
Regional Overview
For more insights on the market share of various regions Download PDF Sample now!
Europe is estimated to contribute 38% to the growth of the global market during the forecast period. Technavio’s analysts have elaborately explained the regional trends and drivers that shape the market during the forecast period. Europe is a global sporting destination and is driven by the European Union (EU) countries that lead the Olympic medal tally. In addition to a sporting event like the Olympics, one of the primary factors driving the market in Europe is the immense popularity of various sports leagues and the increasing efforts of various club owners to keep their fans more engaged through technology. Europe is home to many popular sports leagues, including the PREMIER LEAGUE and The Championships, Wimbledon. Sports fans belonging to Generation Z, especially those in Western Europe, are increasingly exposed and used to hyper-digital connectivity, customer centricity, and convenience, which drives the demand for smart stadiums in the region.
Additionally, various stadium authorities have implemented or are planning to implement the smart stadium concepts. The stadium has an innovative light-emitting diode (LED) lighting system that ensures grass growth, smart sensors to monitor the pitch, an anti-freeze system using sustainable heating, and a cooling system for locker rooms and offices using water from the local lake. Similarly, Tottenham Hotspur Football Club partnered with Hewlett Packard Enterprise Development to develop a smart stadium. Such increasing adoption of smart stadium solutions at many European stadiums is expected to drive the market in Europe during the forecast period.
Market Customer Landscape
The market research and growth report includes the adoption lifecycle of the market, covering from the innovator’s stage to the laggard’s stage. It focuses on adoption rates in different regions based on penetration. Furthermore, the market growth and forecasting report also includes key purchase criteria and drivers of price sensitivity to help companies evaluate and develop their growth strategies.
Customer Landscape
Who are the Major Companies?
Companies are implementing various strategies, such as strategic alliances, partnerships, mergers and acquisitions, geographical expansion, and product/service launches, to enhance their presence in the market.
Avaya LLC - The company offers sports team engagement mobile app that can digitize the fan experience before, during and after the game.
Cisco Systems Inc. - The company offers connected stadium solution that enables stadiums across the globe to address evolving market trends and fan needs with next-generation sports and entertainment experiences.
Dell Technologies Inc. - The company offers smart stadiums for addressing public safety emergencies, from surveillance cameras to biometric scanners.
The market forecasting report also includes detailed analyses of the competitive landscape of the market and information about 20 market companies, including:
- DB Schenker
- Dignia Systems Ltd.
- GP Smart Stadium
- Hawk Eye Innovations Ltd.
- Hewlett Packard Enterprise Co.
- Honeywell International Inc.
- Huawei Technologies Co. Ltd.
- Infosys Ltd.
- Intel Corp.
- International Business Machines Corp.
- Johnson Controls International Plc
- Lumen Technologies Inc.
- NEC Corp.
- Nippon Telegraph and Telephone Corp.
- Telefonaktiebolaget LM Ericsson
- Weblib
- DS worldwide Ltd.
Qualitative and quantitative analysis of companies has been conducted to help clients understand the wider business environment as well as the strengths and weaknesses of key market players. Data is qualitatively analyzed to categorize companies as pure play, category-focused, industry-focused, and diversified; it is quantitatively analyzed to categorize companies as dominant, leading, strong, tentative, and weak.
Segment Overview
The market report forecasts market growth by revenue at global, regional & country levels and provides an analysis of the latest trends and growth opportunities from 2018-2022.
- Software Outlook
- Digital content management
- Building automation
- Stadium and public security
- Event management
- Others
- Deployment Outlook
- On-premises
- Cloud-based
- Region Outlook
- North America
- The U.S.
- Canada
- South America
- Chile
- Brazil
- Argentina
- Europe
- U.K.
- Germany
- France
- Rest of Europe
- APAC
- China
- India
- Middle East & Africa
- Saudi Arabia
- South Africa
- Rest of the Middle East & Africa
- North America
|
Market Scope |
|
|
Report Coverage |
Details |
|
Page number |
179 |
|
Base year |
2023 |
|
Historic period |
2018-2022 |
|
Forecast period |
2024-2028 |
|
Growth momentum & CAGR |
Accelerate at a CAGR of 30.15% |
|
Market Growth 2024-2028 |
USD 50.70 billion |
|
Market structure |
Fragmented |
|
YoY growth 2023-2024(%) |
28.65 |
|
Regional analysis |
Europe, North America, APAC, South America, and Middle East and Africa |
|
Performing market contribution |
Europe at 38% |
|
Key countries |
US, China, Japan, UK, and Germany |
|
Competitive landscape |
Leading Companies, Market Positioning of Companies, Competitive Strategies, and Industry Risks |
|
Key companies profiled |
Avaya LLC, Cisco Systems Inc., DB Schenker, Dell Technologies Inc., Dignia Systems Ltd., GP Smart Stadium, Hawk Eye Innovations Ltd., Hewlett Packard Enterprise Co., Honeywell International Inc., Huawei Technologies Co. Ltd., Infosys Ltd., Intel Corp., International Business Machines Corp., Johnson Controls International Plc, Lumen Technologies Inc., NEC Corp., Nippon Telegraph and Telephone Corp., Telefonaktiebolaget LM Ericsson, Weblib, and DS worldwide Ltd. |
|
Market dynamics |
Parent market analysis, Market growth inducers and obstacles, Fast-growing and slow-growing segment analysis, COVID-19 impact and recovery analysis and future consumer dynamics, Market condition analysis for the forecast period |
|
Customization purview |
If our market analysis and report has not included the data that you are looking for, you can reach out to our analysts and get segments customized. |
What are the Key Data Covered in this Market Research Report?
- CAGR of the market during the forecast period
- Detailed information on factors that will drive the growth of the market between 2024 and 2028
- Precise estimation of the market size and its contribution to the market in focus on the parent market
- Accurate predictions about upcoming trends and changes in consumer behaviour
- Growth of the market across Europe, North America, APAC, South America, and Middle East and Africa
- A thorough analysis of the market’s competitive landscape and detailed information about companies
- Comprehensive analysis of factors that will challenge the growth of market companies
We can help! Our analysts can customize this market research report to meet your requirements.
1 Executive Summary
- 1.1 Market overview
- Exhibit 01: Executive Summary – Chart on Market Overview
- Exhibit 02: Executive Summary – Data Table on Market Overview
- Exhibit 03: Executive Summary – Chart on Global Market Characteristics
- Exhibit 04: Executive Summary – Chart on Market by Geography
- Exhibit 05: Executive Summary – Chart on Market Segmentation by Software
- Exhibit 06: Executive Summary – Chart on Market Segmentation by Deployment
- Exhibit 07: Executive Summary – Chart on Incremental Growth
- Exhibit 08: Executive Summary – Data Table on Incremental Growth
- Exhibit 09: Executive Summary – Chart on Vendor Market Positioning
2 Market Landscape
- 2.1 Market ecosystem
- Exhibit 10: Parent market
- Exhibit 11: Market Characteristics
3 Market Sizing
- 3.1 Market definition
- Exhibit 12: Offerings of vendors included in the market definition
- 3.2 Market segment analysis
- Exhibit 13: Market segments
- 3.3 Market size 2023
- 3.4 Market outlook: Forecast for 2023-2028
- Exhibit 14: Chart on Global - Market size and forecast 2023-2028 ($ billion)
- Exhibit 15: Data Table on Global - Market size and forecast 2023-2028 ($ billion)
- Exhibit 16: Chart on Global Market: Year-over-year growth 2023-2028 (%)
- Exhibit 17: Data Table on Global Market: Year-over-year growth 2023-2028 (%)
4 Historic Market Size
- 4.1 Global smart stadium market 2018 - 2022
- Exhibit 18: Historic Market Size – Data Table on global smart stadium market 2018 - 2022 ($ billion)
- 4.2 Software Segment Analysis 2018 - 2022
- Exhibit 19: Historic Market Size – Software Segment 2018 - 2022 ($ billion)
- 4.3 Deployment Segment Analysis 2018 - 2022
- Exhibit 20: Historic Market Size – Deployment Segment 2018 - 2022 ($ billion)
- 4.4 Geography Segment Analysis 2018 - 2022
- Exhibit 21: Historic Market Size – Geography Segment 2018 - 2022 ($ billion)
- 4.5 Country Segment Analysis 2018 - 2022
- Exhibit 22: Historic Market Size – Country Segment 2018 - 2022 ($ billion)
5 Five Forces Analysis
- 5.1 Five forces summary
- Exhibit 23: Five forces analysis - Comparison between 2023 and 2028
- 5.2 Bargaining power of buyers
- Exhibit 24: Chart on Bargaining power of buyers – Impact of key factors 2023 and 2028
- 5.3 Bargaining power of suppliers
- Exhibit 25: Bargaining power of suppliers – Impact of key factors in 2023 and 2028
- 5.4 Threat of new entrants
- Exhibit 26: Threat of new entrants – Impact of key factors in 2023 and 2028
- 5.5 Threat of substitutes
- Exhibit 27: Threat of substitutes – Impact of key factors in 2023 and 2028
- 5.6 Threat of rivalry
- Exhibit 28: Threat of rivalry – Impact of key factors in 2023 and 2028
- 5.7 Market condition
- Exhibit 29: Chart on Market condition - Five forces 2023 and 2028
6 Market Segmentation by Software
- 6.1 Market segments
- Exhibit 30: Chart on Software - Market share 2023-2028 (%)
- Exhibit 31: Data Table on Software - Market share 2023-2028 (%)
- 6.2 Comparison by Software
- Exhibit 32: Chart on Comparison by Software
- Exhibit 33: Data Table on Comparison by Software
- 6.3 Digital content management - Market size and forecast 2023-2028
- Exhibit 34: Chart on Digital content management - Market size and forecast 2023-2028 ($ billion)
- Exhibit 35: Data Table on Digital content management - Market size and forecast 2023-2028 ($ billion)
- Exhibit 36: Chart on Digital content management - Year-over-year growth 2023-2028 (%)
- Exhibit 37: Data Table on Digital content management - Year-over-year growth 2023-2028 (%)
- 6.4 Building automation - Market size and forecast 2023-2028
- Exhibit 38: Chart on Building automation - Market size and forecast 2023-2028 ($ billion)
- Exhibit 39: Data Table on Building automation - Market size and forecast 2023-2028 ($ billion)
- Exhibit 40: Chart on Building automation - Year-over-year growth 2023-2028 (%)
- Exhibit 41: Data Table on Building automation - Year-over-year growth 2023-2028 (%)
- 6.5 Stadium and public security - Market size and forecast 2023-2028
- Exhibit 42: Chart on Stadium and public security - Market size and forecast 2023-2028 ($ billion)
- Exhibit 43: Data Table on Stadium and public security - Market size and forecast 2023-2028 ($ billion)
- Exhibit 44: Chart on Stadium and public security - Year-over-year growth 2023-2028 (%)
- Exhibit 45: Data Table on Stadium and public security - Year-over-year growth 2023-2028 (%)
- 6.6 Event management - Market size and forecast 2023-2028
- Exhibit 46: Chart on Event management - Market size and forecast 2023-2028 ($ billion)
- Exhibit 47: Data Table on Event management - Market size and forecast 2023-2028 ($ billion)
- Exhibit 48: Chart on Event management - Year-over-year growth 2023-2028 (%)
- Exhibit 49: Data Table on Event management - Year-over-year growth 2023-2028 (%)
- 6.7 Others - Market size and forecast 2023-2028
- Exhibit 50: Chart on Others - Market size and forecast 2023-2028 ($ billion)
- Exhibit 51: Data Table on Others - Market size and forecast 2023-2028 ($ billion)
- Exhibit 52: Chart on Others - Year-over-year growth 2023-2028 (%)
- Exhibit 53: Data Table on Others - Year-over-year growth 2023-2028 (%)
- 6.8 Market opportunity by Software
- Exhibit 54: Market opportunity by Software ($ billion)
- Exhibit 55: Data Table on Market opportunity by Software ($ billion)
7 Market Segmentation by Deployment
- 7.1 Market segments
- Exhibit 56: Chart on Deployment - Market share 2023-2028 (%)
- Exhibit 57: Data Table on Deployment - Market share 2023-2028 (%)
- 7.2 Comparison by Deployment
- Exhibit 58: Chart on Comparison by Deployment
- Exhibit 59: Data Table on Comparison by Deployment
- 7.3 On-premises - Market size and forecast 2023-2028
- Exhibit 60: Chart on On-premises - Market size and forecast 2023-2028 ($ billion)
- Exhibit 61: Data Table on On-premises - Market size and forecast 2023-2028 ($ billion)
- Exhibit 62: Chart on On-premises - Year-over-year growth 2023-2028 (%)
- Exhibit 63: Data Table on On-premises - Year-over-year growth 2023-2028 (%)
- 7.4 Cloud-based - Market size and forecast 2023-2028
- Exhibit 64: Chart on Cloud-based - Market size and forecast 2023-2028 ($ billion)
- Exhibit 65: Data Table on Cloud-based - Market size and forecast 2023-2028 ($ billion)
- Exhibit 66: Chart on Cloud-based - Year-over-year growth 2023-2028 (%)
- Exhibit 67: Data Table on Cloud-based - Year-over-year growth 2023-2028 (%)
- 7.5 Market opportunity by Deployment
- Exhibit 68: Market opportunity by Deployment ($ billion)
- Exhibit 69: Data Table on Market opportunity by Deployment ($ billion)
8 Customer Landscape
- 8.1 Customer landscape overview
- Exhibit 70: Analysis of price sensitivity, lifecycle, customer purchase basket, adoption rates, and purchase criteria
9 Geographic Landscape
- 9.1 Geographic segmentation
- Exhibit 71: Chart on Market share by geography 2023-2028 (%)
- Exhibit 72: Data Table on Market share by geography 2023-2028 (%)
- 9.2 Geographic comparison
- Exhibit 73: Chart on Geographic comparison
- Exhibit 74: Data Table on Geographic comparison
- 9.3 Europe - Market size and forecast 2023-2028
- Exhibit 75: Chart on Europe - Market size and forecast 2023-2028 ($ billion)
- Exhibit 76: Data Table on Europe - Market size and forecast 2023-2028 ($ billion)
- Exhibit 77: Chart on Europe - Year-over-year growth 2023-2028 (%)
- Exhibit 78: Data Table on Europe - Year-over-year growth 2023-2028 (%)
- 9.4 North America - Market size and forecast 2023-2028
- Exhibit 79: Chart on North America - Market size and forecast 2023-2028 ($ billion)
- Exhibit 80: Data Table on North America - Market size and forecast 2023-2028 ($ billion)
- Exhibit 81: Chart on North America - Year-over-year growth 2023-2028 (%)
- Exhibit 82: Data Table on North America - Year-over-year growth 2023-2028 (%)
- 9.5 APAC - Market size and forecast 2023-2028
- Exhibit 83: Chart on APAC - Market size and forecast 2023-2028 ($ billion)
- Exhibit 84: Data Table on APAC - Market size and forecast 2023-2028 ($ billion)
- Exhibit 85: Chart on APAC - Year-over-year growth 2023-2028 (%)
- Exhibit 86: Data Table on APAC - Year-over-year growth 2023-2028 (%)
- 9.6 South America - Market size and forecast 2023-2028
- Exhibit 87: Chart on South America - Market size and forecast 2023-2028 ($ billion)
- Exhibit 88: Data Table on South America - Market size and forecast 2023-2028 ($ billion)
- Exhibit 89: Chart on South America - Year-over-year growth 2023-2028 (%)
- Exhibit 90: Data Table on South America - Year-over-year growth 2023-2028 (%)
- 9.7 Middle East and Africa - Market size and forecast 2023-2028
- Exhibit 91: Chart on Middle East and Africa - Market size and forecast 2023-2028 ($ billion)
- Exhibit 92: Data Table on Middle East and Africa - Market size and forecast 2023-2028 ($ billion)
- Exhibit 93: Chart on Middle East and Africa - Year-over-year growth 2023-2028 (%)
- Exhibit 94: Data Table on Middle East and Africa - Year-over-year growth 2023-2028 (%)
- 9.8 US - Market size and forecast 2023-2028
- Exhibit 95: Chart on US - Market size and forecast 2023-2028 ($ billion)
- Exhibit 96: Data Table on US - Market size and forecast 2023-2028 ($ billion)
- Exhibit 97: Chart on US - Year-over-year growth 2023-2028 (%)
- Exhibit 98: Data Table on US - Year-over-year growth 2023-2028 (%)
- 9.9 UK - Market size and forecast 2023-2028
- Exhibit 99: Chart on UK - Market size and forecast 2023-2028 ($ billion)
- Exhibit 100: Data Table on UK - Market size and forecast 2023-2028 ($ billion)
- Exhibit 101: Chart on UK - Year-over-year growth 2023-2028 (%)
- Exhibit 102: Data Table on UK - Year-over-year growth 2023-2028 (%)
- 9.10 Germany - Market size and forecast 2023-2028
- Exhibit 103: Chart on Germany - Market size and forecast 2023-2028 ($ billion)
- Exhibit 104: Data Table on Germany - Market size and forecast 2023-2028 ($ billion)
- Exhibit 105: Chart on Germany - Year-over-year growth 2023-2028 (%)
- Exhibit 106: Data Table on Germany - Year-over-year growth 2023-2028 (%)
- 9.11 China - Market size and forecast 2023-2028
- Exhibit 107: Chart on China - Market size and forecast 2023-2028 ($ billion)
- Exhibit 108: Data Table on China - Market size and forecast 2023-2028 ($ billion)
- Exhibit 109: Chart on China - Year-over-year growth 2023-2028 (%)
- Exhibit 110: Data Table on China - Year-over-year growth 2023-2028 (%)
- 9.12 Japan - Market size and forecast 2023-2028
- Exhibit 111: Chart on Japan - Market size and forecast 2023-2028 ($ billion)
- Exhibit 112: Data Table on Japan - Market size and forecast 2023-2028 ($ billion)
- Exhibit 113: Chart on Japan - Year-over-year growth 2023-2028 (%)
- Exhibit 114: Data Table on Japan - Year-over-year growth 2023-2028 (%)
- 9.13 Market opportunity by geography
- Exhibit 115: Market opportunity by geography ($ billion)
- Exhibit 116: Data Tables on Market opportunity by geography ($ billion)
10 Drivers, Challenges, and Trends
- 10.1 Market drivers
- 10.2 Market challenges
- 10.3 Impact of drivers and challenges
- Exhibit 117: Impact of drivers and challenges in 2023 and 2028
- 10.4 Market trends
11 Vendor Landscape
- 11.1 Overview
- 11.2 Vendor landscape
- Exhibit 118: Overview on Criticality of inputs and Factors of differentiation
- 11.3 Landscape disruption
- Exhibit 119: Overview on factors of disruption
- 11.4 Industry risks
- Exhibit 120: Impact of key risks on business
12 Vendor Analysis
- 12.1 Vendors covered
- Exhibit 121: Vendors covered
- 12.2 Market positioning of vendors
- Exhibit 122: Matrix on vendor position and classification
- 12.3 Avaya LLC
- Exhibit 123: Avaya LLC - Overview
- Exhibit 124: Avaya LLC - Product / Service
- Exhibit 125: Avaya LLC - Key offerings
- 12.4 Cisco Systems Inc.
- Exhibit 126: Cisco Systems Inc. - Overview
- Exhibit 127: Cisco Systems Inc. - Business segments
- Exhibit 128: Cisco Systems Inc. - Key news
- Exhibit 129: Cisco Systems Inc. - Key offerings
- Exhibit 130: Cisco Systems Inc. - Segment focus
- 12.5 Dell Technologies Inc.
- Exhibit 131: Dell Technologies Inc. - Overview
- Exhibit 132: Dell Technologies Inc. - Business segments
- Exhibit 133: Dell Technologies Inc. - Key news
- Exhibit 134: Dell Technologies Inc. - Key offerings
- Exhibit 135: Dell Technologies Inc. - Segment focus
- 12.6 Dignia Systems Ltd.
- Exhibit 136: Dignia Systems Ltd. - Overview
- Exhibit 137: Dignia Systems Ltd. - Product / Service
- Exhibit 138: Dignia Systems Ltd. - Key offerings
- 12.7 DS worldwide Ltd.
- Exhibit 139: DS worldwide Ltd. - Overview
- Exhibit 140: DS worldwide Ltd. - Product / Service
- Exhibit 141: DS worldwide Ltd. - Key offerings
- 12.8 GP Smart Stadium
- Exhibit 142: GP Smart Stadium - Overview
- Exhibit 143: GP Smart Stadium - Product / Service
- Exhibit 144: GP Smart Stadium - Key offerings
- 12.9 Hawk Eye Innovations Ltd.
- Exhibit 145: Hawk Eye Innovations Ltd. - Overview
- Exhibit 146: Hawk Eye Innovations Ltd. - Product / Service
- Exhibit 147: Hawk Eye Innovations Ltd. - Key offerings
- 12.10 Hewlett Packard Enterprise Co.
- Exhibit 148: Hewlett Packard Enterprise Co. - Overview
- Exhibit 149: Hewlett Packard Enterprise Co. - Business segments
- Exhibit 150: Hewlett Packard Enterprise Co. - Key news
- Exhibit 151: Hewlett Packard Enterprise Co. - Key offerings
- Exhibit 152: Hewlett Packard Enterprise Co. - Segment focus
- 12.11 Huawei Technologies Co. Ltd.
- Exhibit 153: Huawei Technologies Co. Ltd. - Overview
- Exhibit 154: Huawei Technologies Co. Ltd. - Business segments
- Exhibit 155: Huawei Technologies Co. Ltd. - Key news
- Exhibit 156: Huawei Technologies Co. Ltd. - Key offerings
- Exhibit 157: Huawei Technologies Co. Ltd. - Segment focus
- 12.12 Infosys Ltd.
- Exhibit 158: Infosys Ltd. - Overview
- Exhibit 159: Infosys Ltd. - Business segments
- Exhibit 160: Infosys Ltd. - Key news
- Exhibit 161: Infosys Ltd. - Key offerings
- Exhibit 162: Infosys Ltd. - Segment focus
- 12.13 Intel Corp.
- Exhibit 163: Intel Corp. - Overview
- Exhibit 164: Intel Corp. - Business segments
- Exhibit 165: Intel Corp. - Key news
- Exhibit 166: Intel Corp. - Key offerings
- Exhibit 167: Intel Corp. - Segment focus
- 12.14 International Business Machines Corp.
- Exhibit 168: International Business Machines Corp. - Overview
- Exhibit 169: International Business Machines Corp. - Business segments
- Exhibit 170: International Business Machines Corp. - Key news
- Exhibit 171: International Business Machines Corp. - Key offerings
- Exhibit 172: International Business Machines Corp. - Segment focus
- 12.15 Johnson Controls International Plc
- Exhibit 173: Johnson Controls International Plc - Overview
- Exhibit 174: Johnson Controls International Plc - Business segments
- Exhibit 175: Johnson Controls International Plc - Key news
- Exhibit 176: Johnson Controls International Plc - Key offerings
- Exhibit 177: Johnson Controls International Plc - Segment focus
- 12.16 Lumen Technologies Inc.
- Exhibit 178: Lumen Technologies Inc. - Overview
- Exhibit 179: Lumen Technologies Inc. - Business segments
- Exhibit 180: Lumen Technologies Inc. - Key offerings
- Exhibit 181: Lumen Technologies Inc. - Segment focus
- 12.17 NEC Corp.
- Exhibit 182: NEC Corp. - Overview
- Exhibit 183: NEC Corp. - Business segments
- Exhibit 184: NEC Corp. - Key news
- Exhibit 185: NEC Corp. - Key offerings
- Exhibit 186: NEC Corp. - Segment focus
13 Appendix
- 13.1 Scope of the report
- 13.2 Inclusions and exclusions checklist
- Exhibit 187: Inclusions checklist
- Exhibit 188: Exclusions checklist
- 13.3 Currency conversion rates for US$
- Exhibit 189: Currency conversion rates for US$
- 13.4 Research methodology
- Exhibit 190: Research methodology
- Exhibit 191: Validation techniques employed for market sizing
- Exhibit 192: Information sources
- 13.5 List of abbreviations
- Exhibit 193: List of abbreviations
Research Framework
Technavio presents a detailed picture of the market by way of study, synthesis, and summation of data from multiple sources. The analysts have presented the various facets of the market with a particular focus on identifying the key industry influencers. The data thus presented is comprehensive, reliable, and the result of extensive research, both primary and secondary.
INFORMATION SOURCES
Primary sources
- Manufacturers and suppliers
- Channel partners
- Industry experts
- Strategic decision makers
Secondary sources
- Industry journals and periodicals
- Government data
- Financial reports of key industry players
- Historical data
- Press releases
DATA ANALYSIS
Data Synthesis
- Collation of data
- Estimation of key figures
- Analysis of derived insights
Data Validation
- Triangulation with data models
- Reference against proprietary databases
- Corroboration with industry experts
REPORT WRITING
Qualitative
- Market drivers
- Market challenges
- Market trends
- Five forces analysis
Quantitative
- Market size and forecast
- Market segmentation
- Geographical insights
- Competitive landscape
PURCHASE FULL REPORT OF
smart stadium market market
Key Questions Answered
- What are the key global market and the regional market share?
- What are the revenue-generating key market segments?
- What are the key factors driving and challenging this market’s growth?
- Who are the key market vendors and their growth strategies?
- What are the latest trends influencing the growth of this market?
- What are the variables influencing the market growth in the primary regions?
- What are the factors influencing the growth of the parent market?
Why should you prefer Technavio's market insights report?
- Off-the-shelf research reports
- Reports can be tailored to meet the customer's needs
- Trusted by more than 100 fortune 500 organizations
- Information about the market's key drivers, trends, and challenges
- Parent market analysis
- Every week, 50,000 people visit our subscription platform
- Detailed vendors report with competitive landscape
- Covid-19 impact and recovery analysis
- Data on revenue-generating market segments
- Details on the market shares of various regions
- Five-force market analysis