Substation Automation Market Analysis North America, APAC, Europe, South America, Middle East and Africa - US, China, India, Germany, France - Size and Forecast 2023-2027
| Published: Oct 2023 | Pages: 186 | SKU: IRTNTR76465 |
Substation Automation Market 2023-2027
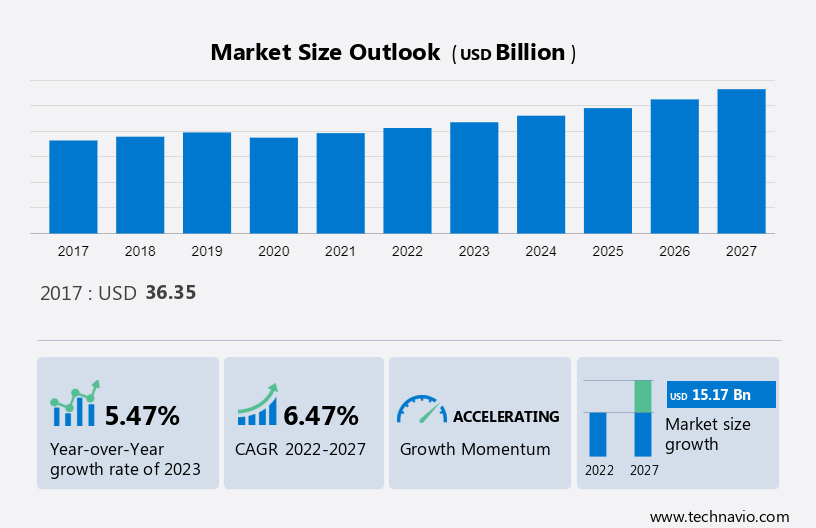
The substation automation market size is estimated to grow at a CAGR of 6.47% between 2022 and 2027. The market size is forecast to increase by USD 15.17 billion. The growth of the market depends on several factors including the need for efficient power transmission and distribution, advancements in communication and connectivity technologies, and growing demand for grid resilience and security. Our report examines historic data from 2017 to 2021, besides analyzing the current market scenario.
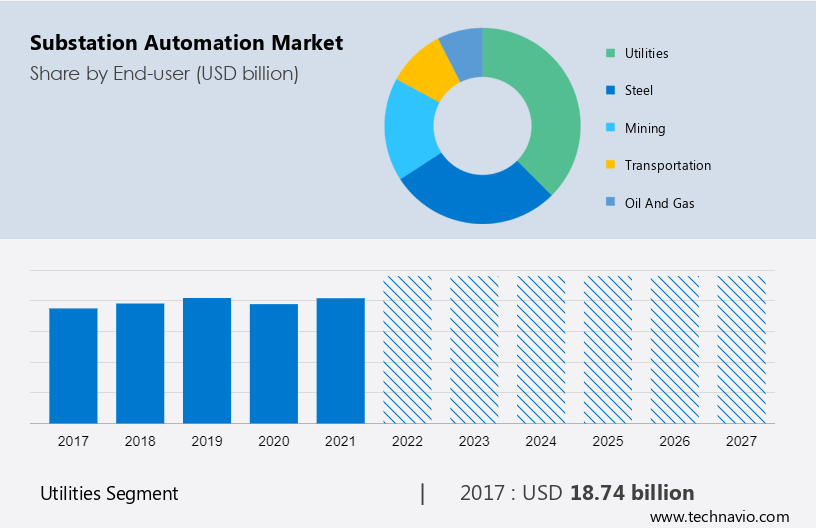
This report extensively covers market segmentation by end-user (utilities, steel, mining, transportation, and oil and gas), type (transmission and distribution), and geography (North America, APAC, Europe, South America, and Middle East and Africa). It also includes an in-depth analysis of drivers, trends, and challenges.
What will be the size of the Substation Automation Market During the Forecast Period?
Substation Automation Market Forecast 2023-2027
To learn more about this report, Request Free Sample
Substation Automation Market Dynamic
Our researchers studied the data for years, with 2022 as the base year and 2023 as the estimated year, and presented the key drivers, trends, and challenges for the market. Although there has been a disruption in the growth of the market during the COVID-19 pandemic, a holistic analysis of drivers, trends, and challenges will help companies refine marketing strategies to gain a competitive advantage.
Driver- Growing demand for grid resilience and security
For grid resilience and security, the global substation automation market is witnessing an increasing demand which is being driven by several factors, including rising concerns about power outages and the need to optimize grid performance. Utilities and grid operators are able to enhance the reliability and security of their power systems by adopting substation automation solutions. Substation automation solutions allow utilities to scrutinize and control various components of the grid, such as transformers, circuit breakers, and voltage regulators. Such real-time monitoring and control capability enables operators to identify potential issues and take required actions, ensuring optimal performance of the grid.
In addition, utilities can prevent equipment failures, reduce maintenance costs, and improve overall grid reliability by efficiently managing grid assets. Therefore, such factors are anticipated to augment the demand for substation automation, which will drive the growth of the market during the forecast period.
Trends- Rising demand for EVs and hybrid electric vehicles (HEVs)
The global substation automation market is experiencing a substantial rise in demand for EVs and HEVs. Increasing adoption of sustainable transportation solutions and the growing concern over environmental issues are the major attributes that result in an increase in demand. EVs and HEVs are more environmentally friendly alternatives to traditional gasoline-powered vehicles as they produce zero or significantly lower emissions. The automotive industry is shifting toward producing more electric and hybrid vehicles as governments worldwide enforce more stringent regulations to combat climate change. The trust in EVs and HEVs increases, further boosting their sales as technology continues to improve. Thus, the need for efficient and reliable charging infrastructure provided by substation automation has become paramount.
Moreover, the declining prices of EVs, along with government incentives and subsidies, have made them a possible option for consumers. This led to an increase in the demand for substation automation as more individuals and businesses invested in EVs and HEVs, necessitating the development of robust charging infrastructure. Therefore, these factors are anticipated to expand the demand for substation automation, which will drive the growth of the market during the forecast period.
Challenge- Rise in skilled workforce shortage
The rise in the shortage of skilled workforce is a significant challenge that is posing a concern for businesses operating in the electronics industry and hinders market growth. The rapid growth of the electronics industry is one of the primary reasons for the skilled workforce shortage in the global substation automation market. Substation automation systems are experiencing increased adoption owing to their capacity to improve operational efficiency and reduce costs. The rising demand for these systems is outpacing the supply of skilled professionals who can effectively design, install, and maintain them.
Also, advancements in technology have also contributed to the shortage. Substation automation systems now integrate with advanced components such as AI, IoT, and cloud computing. The shortage of professionals with the necessary skills to operate and troubleshoot these advanced systems is adding to the workforce gap. Therefore, these factors are anticipated to restrict the growth of the market during the forecast period.
Substation Automation Market Segmentation by End-user, Type, and Geography
End-user Segment Analysis
The market share growth by the utilities segment will be significant during the forecast period. The utilities sector plays a critical role in the global substation automation market. Utility companies are increasingly adopting substation automation solutions to optimize their operations with the rising demand for electricity and the need to modernize power grids.
Get a Customised Report as per your requirements for FREE!
The utilities segment was the largest and was valued at USD 18.74 billion in 2017. To enhance asset management strategies, utility companies are leveraging substation automation. Utilities can monitor and analyze the performance and health of substation equipment by implementing advanced software solutions that help in optimizing maintenance schedules, minimizing downtime, and extending the lifespan of critical assets. For instance, predictive maintenance algorithms can detect early signs of equipment failure and schedule repairs before a major disruption occurs. Therefore, such benefits are anticipated to augment the adoption of substation automation in the utility sector, which will drive the growth of the utility segment in the global substation automation market during the forecast period.
Type Segment Analysis
Based on type, the market has been segmented into transmission and distribution. The transmission segment will account for the largest share of this segment.? Substations need to effectively manage the transmission of power from these decentralized sources with the increasing adoption of renewable energy, such as solar and wind power. This needs the integration of intelligent devices and communication systems that can seamlessly interface with renewable energy sources and the existing grid infrastructure. For instance, by utilizing advanced communication and control systems, utilities can dynamically manage the transmission of renewable energy based on availability and demand, balancing the generation and consumption of power effectively. Therefore, such advantages are anticipated to advance the adoption of transmission technology, which will drive the growth of the transmission segment in the global substation automation market during the forecast period.
Regional Analysis
For more insights on the market share of various regions View PDF Sample now!
APAC is estimated to contribute 35% to the growth by 2027. Technavio’s analysts have elaborately explained the regional trends, drivers, and challenges that are expected to shape the market during the forecast period. Another region offering significant growth opportunities to vendors is North America. The substation automation market in North America is being driven by the advanced technological infrastructure and the quick adoption of automation across various sectors, particularly power distribution, in countries such as the US and Canada. These two countries are highly developed when it comes to electrical infrastructure. Because of this, most of the demand in these regions will come from upgrading the existing infrastructure and transitioning to smart grids. These countries have also invested a significant amount in promoting the use of EVs, which has increased the demand for EV charging infrastructure.
Consequently, the adoption of substation automation solutions in the region is predicted to increase in 2022. Furthermore, favourable government policies and incentives are propelling the growth of the market in this region. For instance, the US federal government offers incentives to renewable energy facilities under the Renewable Electricity Production Tax Credit (PTC), which provides a PTC amount of USD 0.0184 per kWh for all wind energy generation technologies. Moreover, the region's increasing focus on setting up offshore wind farms is expected to strengthen the demand for substation automation during the forecast period.
COVID Recovery Analysis:
In 2020, the outbreak of the COVID-19 pandemic negatively influenced the growth of the industrial sector in North America. However, with the help of rapid vaccination programs across the region, the lockdown restrictions were lifted in the second half of 2020. This led to a surge in the manufacturing activities in the oil and gas, automotive, and other end-user industries of substation automation. Therefore, the increasing penetration of cutting-edge technologies such as AI, automated solutions, and the IoT is expected to drive the growth substation automation market in the region during the forecast period.
Who are the Major Substation Automation Market Companies?
Companies are implementing various strategies, such as strategic alliances, partnerships, mergers and acquisitions, geographical expansion, and product/service launches, to enhance their presence in the market.
ABB Ltd.- The company offers substation automation solutions such as Smart substation control and protection SSC600.
We also have detailed analyses of the market’s competitive landscape and offer information on 20 market companies, including:
ABB Ltd., Arteche Lantegi Elkartea SA, Beijer Electronics Group AB, Cisco Systems Inc., Eaton Corp. Plc, General Electric Co., Hitachi Ltd., Mitsubishi Electric Corp., OHB SE, Renewable Energy Systems Ltd., Schneider Electric SE, Schweitzer Engineering Laboratories Inc., Siemens AG, Texas Instruments Inc., The Weir Group Plc, Toshiba Corp., TRC Companies Inc., Trilliant Holdings Inc., ZIV Automation, and SHENZHEN GUOWANG NARI TECHNOLOGY CO. LTD.
Technavio report provides an in-depth analysis of the market and its players through combined qualitative and quantitative data. The analysis classifies companies into categories based on their business approaches, including pure-play, category-focused, industry-focused, and diversified. Companies are specially categorized into dominant, leading, strong, tentative, and weak, based on their quantitative data analysis.
Segment Overview
The substation automation market report forecasts market growth by revenue at global, regional & country levels and provides an analysis of the latest trends and growth opportunities from 2017 to 2027.
- End-user Outlook (USD billion, 2017 - 2027)
- Utilities
- Steel
- Mining
- Transportation
- Oil and gas
- Type Outlook (USD billion, 2017 - 2027)
- Transmission
- Distribution
- Region Outlook (USD billion, 2017 - 2027)
- North America
- The U.S.
- Canada
- South America
- Chile
- Brazil
- Argentina
- Europe
- U.K.
- Germany
- France
- Rest of Europe
- APAC
- China
- India
- Middle East & Africa
- Saudi Arabia
- South Africa
- Rest of the Middle East & Africa
- North America
|
Substation Automation Market Scope |
|
|
Report Coverage |
Details |
|
Page number |
186 |
|
Base year |
2022 |
|
Historic period |
2017-2021 |
|
Forecast period |
2023-2027 |
|
Growth momentum & CAGR |
Accelerate at a CAGR of 6.47% |
|
Market growth 2023-2027 |
USD 15.17 billion |
|
Market structure |
Fragmented |
|
YoY growth 2022-2023(%) |
5.47 |
|
Regional analysis |
North America, APAC, Europe, South America, and Middle East and Africa |
|
Performing market contribution |
APAC at 35% |
|
Key countries |
US, China, India, Germany, and France |
|
Competitive landscape |
Leading Companies, Market Positioning of Companies, Competitive Strategies, and Industry Risks |
|
Key companies profiled |
ABB Ltd., Arteche Lantegi Elkartea SA, Beijer Electronics Group AB, Cisco Systems Inc., Eaton Corp. Plc, General Electric Co., Hitachi Ltd., Mitsubishi Electric Corp., OHB SE, Renewable Energy Systems Ltd., Schneider Electric SE, Schweitzer Engineering Laboratories Inc., Siemens AG, Texas Instruments Inc., The Weir Group Plc, Toshiba Corp., TRC Companies Inc., Trilliant Holdings Inc., ZIV Automation, and SHENZHEN GUOWANG NARI TECHNOLOGY CO. LTD. |
|
Market dynamics |
Parent market analysis, Market growth inducers and obstacles, Fast-growing and slow-growing segment analysis, COVID-19 impact and recovery analysis and future consumer dynamics, Market condition analysis for the forecast period. |
|
Customization purview |
If our report has not included the data that you are looking for, you can reach out to our analysts and get segments customized. |
What are the Key Data Covered in this Substation Automation Market Research Report?
- CAGR of the market during the forecast period
- Detailed information on factors that will drive the growth of the substation automation between 2023 and 2027
- Precise estimation of the substation automation market size and its contribution to the market in focus on the parent market
- Accurate predictions about upcoming trends and changes in consumer behaviour
- Growth of the market across North America, APAC, Europe, South America, and the Middle East and Africa
- A thorough analysis of the market’s competitive landscape and detailed information about companies
- Comprehensive analysis of factors that will challenge the growth of substation automation market companies
We can help! Our analysts can customize this market research report to meet your requirements. Get in touch
1 Executive Summary
- 1.1 Market overview
- Exhibit 01: Executive Summary – Chart on Market Overview
- Exhibit 02: Executive Summary – Data Table on Market Overview
- Exhibit 03: Executive Summary – Chart on Global Market Characteristics
- Exhibit 04: Executive Summary – Chart on Market by Geography
- Exhibit 05: Executive Summary – Chart on Market Segmentation by End-user
- Exhibit 06: Executive Summary – Chart on Market Segmentation by Type
- Exhibit 07: Executive Summary – Chart on Incremental Growth
- Exhibit 08: Executive Summary – Data Table on Incremental Growth
- Exhibit 09: Executive Summary – Chart on Vendor Market Positioning
2 Market Landscape
- 2.1 Market ecosystem
- Exhibit 10: Parent market
- Exhibit 11: Market Characteristics
3 Market Sizing
- 3.1 Market definition
- Exhibit 12: Offerings of vendors included in the market definition
- 3.2 Market segment analysis
- Exhibit 13: Market segments
- 3.3 Market size 2022
- 3.4 Market outlook: Forecast for 2022-2027
- Exhibit 14: Chart on Global - Market size and forecast 2022-2027 ($ billion)
- Exhibit 15: Data Table on Global - Market size and forecast 2022-2027 ($ billion)
- Exhibit 16: Chart on Global Market: Year-over-year growth 2022-2027 (%)
- Exhibit 17: Data Table on Global Market: Year-over-year growth 2022-2027 (%)
4 Historic Market Size
- 4.1 Global substation automation market 2017 - 2021
- Exhibit 18: Historic Market Size – Data Table on global substation automation market 2017 - 2021 ($ billion)
- 4.2 End-user Segment Analysis 2017 - 2021
- Exhibit 19: Historic Market Size – End-user Segment 2017 - 2021 ($ billion)
- 4.3 Type Segment Analysis 2017 - 2021
- Exhibit 20: Historic Market Size – Type Segment 2017 - 2021 ($ billion)
- 4.4 Geography Segment Analysis 2017 - 2021
- Exhibit 21: Historic Market Size – Geography Segment 2017 - 2021 ($ billion)
- 4.5 Country Segment Analysis 2017 - 2021
- Exhibit 22: Historic Market Size – Country Segment 2017 - 2021 ($ billion)
5 Five Forces Analysis
- 5.1 Five forces summary
- Exhibit 23: Five forces analysis - Comparison between 2022 and 2027
- 5.2 Bargaining power of buyers
- Exhibit 24: Chart on Bargaining power of buyers – Impact of key factors 2022 and 2027
- 5.3 Bargaining power of suppliers
- Exhibit 25: Bargaining power of suppliers – Impact of key factors in 2022 and 2027
- 5.4 Threat of new entrants
- Exhibit 26: Threat of new entrants – Impact of key factors in 2022 and 2027
- 5.5 Threat of substitutes
- Exhibit 27: Threat of substitutes – Impact of key factors in 2022 and 2027
- 5.6 Threat of rivalry
- Exhibit 28: Threat of rivalry – Impact of key factors in 2022 and 2027
- 5.7 Market condition
- Exhibit 29: Chart on Market condition - Five forces 2022 and 2027
6 Market Segmentation by End-user
- 6.1 Market segments
- Exhibit 30: Chart on End-user - Market share 2022-2027 (%)
- Exhibit 31: Data Table on End-user - Market share 2022-2027 (%)
- 6.2 Comparison by End-user
- Exhibit 32: Chart on Comparison by End-user
- Exhibit 33: Data Table on Comparison by End-user
- 6.3 Utilities - Market size and forecast 2022-2027
- Exhibit 34: Chart on Utilities - Market size and forecast 2022-2027 ($ billion)
- Exhibit 35: Data Table on Utilities - Market size and forecast 2022-2027 ($ billion)
- Exhibit 36: Chart on Utilities - Year-over-year growth 2022-2027 (%)
- Exhibit 37: Data Table on Utilities - Year-over-year growth 2022-2027 (%)
- 6.4 Steel - Market size and forecast 2022-2027
- Exhibit 38: Chart on Steel - Market size and forecast 2022-2027 ($ billion)
- Exhibit 39: Data Table on Steel - Market size and forecast 2022-2027 ($ billion)
- Exhibit 40: Chart on Steel - Year-over-year growth 2022-2027 (%)
- Exhibit 41: Data Table on Steel - Year-over-year growth 2022-2027 (%)
- 6.5 Mining - Market size and forecast 2022-2027
- Exhibit 42: Chart on Mining - Market size and forecast 2022-2027 ($ billion)
- Exhibit 43: Data Table on Mining - Market size and forecast 2022-2027 ($ billion)
- Exhibit 44: Chart on Mining - Year-over-year growth 2022-2027 (%)
- Exhibit 45: Data Table on Mining - Year-over-year growth 2022-2027 (%)
- 6.6 Transportation - Market size and forecast 2022-2027
- Exhibit 46: Chart on Transportation - Market size and forecast 2022-2027 ($ billion)
- Exhibit 47: Data Table on Transportation - Market size and forecast 2022-2027 ($ billion)
- Exhibit 48: Chart on Transportation - Year-over-year growth 2022-2027 (%)
- Exhibit 49: Data Table on Transportation - Year-over-year growth 2022-2027 (%)
- 6.7 Oil and gas - Market size and forecast 2022-2027
- Exhibit 50: Chart on Oil and gas - Market size and forecast 2022-2027 ($ billion)
- Exhibit 51: Data Table on Oil and gas - Market size and forecast 2022-2027 ($ billion)
- Exhibit 52: Chart on Oil and gas - Year-over-year growth 2022-2027 (%)
- Exhibit 53: Data Table on Oil and gas - Year-over-year growth 2022-2027 (%)
- 6.8 Market opportunity by End-user
- Exhibit 54: Market opportunity by End-user ($ billion)
- Exhibit 55: Data Table on Market opportunity by End-user ($ billion)
7 Market Segmentation by Type
- 7.1 Market segments
- Exhibit 56: Chart on Type - Market share 2022-2027 (%)
- Exhibit 57: Data Table on Type - Market share 2022-2027 (%)
- 7.2 Comparison by Type
- Exhibit 58: Chart on Comparison by Type
- Exhibit 59: Data Table on Comparison by Type
- 7.3 Transmission - Market size and forecast 2022-2027
- Exhibit 60: Chart on Transmission - Market size and forecast 2022-2027 ($ billion)
- Exhibit 61: Data Table on Transmission - Market size and forecast 2022-2027 ($ billion)
- Exhibit 62: Chart on Transmission - Year-over-year growth 2022-2027 (%)
- Exhibit 63: Data Table on Transmission - Year-over-year growth 2022-2027 (%)
- 7.4 Distribution - Market size and forecast 2022-2027
- Exhibit 64: Chart on Distribution - Market size and forecast 2022-2027 ($ billion)
- Exhibit 65: Data Table on Distribution - Market size and forecast 2022-2027 ($ billion)
- Exhibit 66: Chart on Distribution - Year-over-year growth 2022-2027 (%)
- Exhibit 67: Data Table on Distribution - Year-over-year growth 2022-2027 (%)
- 7.5 Market opportunity by Type
- Exhibit 68: Market opportunity by Type ($ billion)
- Exhibit 69: Data Table on Market opportunity by Type ($ billion)
8 Customer Landscape
- 8.1 Customer landscape overview
- Exhibit 70: Analysis of price sensitivity, lifecycle, customer purchase basket, adoption rates, and purchase criteria
9 Geographic Landscape
- 9.1 Geographic segmentation
- Exhibit 71: Chart on Market share by geography 2022-2027 (%)
- Exhibit 72: Data Table on Market share by geography 2022-2027 (%)
- 9.2 Geographic comparison
- Exhibit 73: Chart on Geographic comparison
- Exhibit 74: Data Table on Geographic comparison
- 9.3 North America - Market size and forecast 2022-2027
- Exhibit 75: Chart on North America - Market size and forecast 2022-2027 ($ billion)
- Exhibit 76: Data Table on North America - Market size and forecast 2022-2027 ($ billion)
- Exhibit 77: Chart on North America - Year-over-year growth 2022-2027 (%)
- Exhibit 78: Data Table on North America - Year-over-year growth 2022-2027 (%)
- 9.4 APAC - Market size and forecast 2022-2027
- Exhibit 79: Chart on APAC - Market size and forecast 2022-2027 ($ billion)
- Exhibit 80: Data Table on APAC - Market size and forecast 2022-2027 ($ billion)
- Exhibit 81: Chart on APAC - Year-over-year growth 2022-2027 (%)
- Exhibit 82: Data Table on APAC - Year-over-year growth 2022-2027 (%)
- 9.5 Europe - Market size and forecast 2022-2027
- Exhibit 83: Chart on Europe - Market size and forecast 2022-2027 ($ billion)
- Exhibit 84: Data Table on Europe - Market size and forecast 2022-2027 ($ billion)
- Exhibit 85: Chart on Europe - Year-over-year growth 2022-2027 (%)
- Exhibit 86: Data Table on Europe - Year-over-year growth 2022-2027 (%)
- 9.6 South America - Market size and forecast 2022-2027
- Exhibit 87: Chart on South America - Market size and forecast 2022-2027 ($ billion)
- Exhibit 88: Data Table on South America - Market size and forecast 2022-2027 ($ billion)
- Exhibit 89: Chart on South America - Year-over-year growth 2022-2027 (%)
- Exhibit 90: Data Table on South America - Year-over-year growth 2022-2027 (%)
- 9.7 Middle East and Africa - Market size and forecast 2022-2027
- Exhibit 91: Chart on Middle East and Africa - Market size and forecast 2022-2027 ($ billion)
- Exhibit 92: Data Table on Middle East and Africa - Market size and forecast 2022-2027 ($ billion)
- Exhibit 93: Chart on Middle East and Africa - Year-over-year growth 2022-2027 (%)
- Exhibit 94: Data Table on Middle East and Africa - Year-over-year growth 2022-2027 (%)
- 9.8 US - Market size and forecast 2022-2027
- Exhibit 95: Chart on US - Market size and forecast 2022-2027 ($ billion)
- Exhibit 96: Data Table on US - Market size and forecast 2022-2027 ($ billion)
- Exhibit 97: Chart on US - Year-over-year growth 2022-2027 (%)
- Exhibit 98: Data Table on US - Year-over-year growth 2022-2027 (%)
- 9.9 China - Market size and forecast 2022-2027
- Exhibit 99: Chart on China - Market size and forecast 2022-2027 ($ billion)
- Exhibit 100: Data Table on China - Market size and forecast 2022-2027 ($ billion)
- Exhibit 101: Chart on China - Year-over-year growth 2022-2027 (%)
- Exhibit 102: Data Table on China - Year-over-year growth 2022-2027 (%)
- 9.10 Germany - Market size and forecast 2022-2027
- Exhibit 103: Chart on Germany - Market size and forecast 2022-2027 ($ billion)
- Exhibit 104: Data Table on Germany - Market size and forecast 2022-2027 ($ billion)
- Exhibit 105: Chart on Germany - Year-over-year growth 2022-2027 (%)
- Exhibit 106: Data Table on Germany - Year-over-year growth 2022-2027 (%)
- 9.11 France - Market size and forecast 2022-2027
- Exhibit 107: Chart on France - Market size and forecast 2022-2027 ($ billion)
- Exhibit 108: Data Table on France - Market size and forecast 2022-2027 ($ billion)
- Exhibit 109: Chart on France - Year-over-year growth 2022-2027 (%)
- Exhibit 110: Data Table on France - Year-over-year growth 2022-2027 (%)
- 9.12 India - Market size and forecast 2022-2027
- Exhibit 111: Chart on India - Market size and forecast 2022-2027 ($ billion)
- Exhibit 112: Data Table on India - Market size and forecast 2022-2027 ($ billion)
- Exhibit 113: Chart on India - Year-over-year growth 2022-2027 (%)
- Exhibit 114: Data Table on India - Year-over-year growth 2022-2027 (%)
- 9.13 Market opportunity by geography
- Exhibit 115: Market opportunity by geography ($ billion)
- Exhibit 116: Data Tables on Market opportunity by geography ($ billion)
10 Drivers, Challenges, and Trends
- 10.1 Market drivers
- 10.2 Market challenges
- 10.3 Impact of drivers and challenges
- Exhibit 117: Impact of drivers and challenges in 2022 and 2027
- 10.4 Market trends
11 Vendor Landscape
- 11.1 Overview
- 11.2 Vendor landscape
- Exhibit 118: Overview on Criticality of inputs and Factors of differentiation
- 11.3 Landscape disruption
- Exhibit 119: Overview on factors of disruption
- 11.4 Industry risks
- Exhibit 120: Impact of key risks on business
12 Vendor Analysis
- 12.1 Vendors covered
- Exhibit 121: Vendors covered
- 12.2 Market positioning of vendors
- Exhibit 122: Matrix on vendor position and classification
- 12.3 ABB Ltd.
- Exhibit 123: ABB Ltd. - Overview
- Exhibit 124: ABB Ltd. - Business segments
- Exhibit 125: ABB Ltd. - Key offerings
- Exhibit 126: ABB Ltd. - Segment focus
- 12.4 Cisco Systems Inc.
- Exhibit 127: Cisco Systems Inc. - Overview
- Exhibit 128: Cisco Systems Inc. - Business segments
- Exhibit 129: Cisco Systems Inc. - Key news
- Exhibit 130: Cisco Systems Inc. - Key offerings
- Exhibit 131: Cisco Systems Inc. - Segment focus
- 12.5 Eaton Corp. Plc
- Exhibit 132: Eaton Corp. Plc - Overview
- Exhibit 133: Eaton Corp. Plc - Business segments
- Exhibit 134: Eaton Corp. Plc - Key news
- Exhibit 135: Eaton Corp. Plc - Key offerings
- Exhibit 136: Eaton Corp. Plc - Segment focus
- 12.6 General Electric Co.
- Exhibit 137: General Electric Co. - Overview
- Exhibit 138: General Electric Co. - Business segments
- Exhibit 139: General Electric Co. - Key news
- Exhibit 140: General Electric Co. - Key offerings
- Exhibit 141: General Electric Co. - Segment focus
- 12.7 Hitachi Ltd.
- Exhibit 142: Hitachi Ltd. - Overview
- Exhibit 143: Hitachi Ltd. - Business segments
- Exhibit 144: Hitachi Ltd. - Key news
- Exhibit 145: Hitachi Ltd. - Key offerings
- Exhibit 146: Hitachi Ltd. - Segment focus
- 12.8 Mitsubishi Electric Corp.
- Exhibit 147: Mitsubishi Electric Corp. - Overview
- Exhibit 148: Mitsubishi Electric Corp. - Business segments
- Exhibit 149: Mitsubishi Electric Corp. - Key news
- Exhibit 150: Mitsubishi Electric Corp. - Key offerings
- Exhibit 151: Mitsubishi Electric Corp. - Segment focus
- 12.9 Renewable Energy Systems Ltd.
- Exhibit 152: Renewable Energy Systems Ltd. - Overview
- Exhibit 153: Renewable Energy Systems Ltd. - Product / Service
- Exhibit 154: Renewable Energy Systems Ltd. - Key offerings
- 12.10 Schneider Electric SE
- Exhibit 155: Schneider Electric SE - Overview
- Exhibit 156: Schneider Electric SE - Business segments
- Exhibit 157: Schneider Electric SE - Key news
- Exhibit 158: Schneider Electric SE - Key offerings
- Exhibit 159: Schneider Electric SE - Segment focus
- 12.11 Schweitzer Engineering Laboratories Inc.
- Exhibit 160: Schweitzer Engineering Laboratories Inc. - Overview
- Exhibit 161: Schweitzer Engineering Laboratories Inc. - Product / Service
- Exhibit 162: Schweitzer Engineering Laboratories Inc. - Key offerings
- 12.12 SHENZHEN GUOWANG NARI TECHNOLOGY CO. LTD.
- Exhibit 163: SHENZHEN GUOWANG NARI TECHNOLOGY CO. LTD. - Overview
- Exhibit 164: SHENZHEN GUOWANG NARI TECHNOLOGY CO. LTD. - Product / Service
- Exhibit 165: SHENZHEN GUOWANG NARI TECHNOLOGY CO. LTD. - Key offerings
- 12.13 Siemens AG
- Exhibit 166: Siemens AG - Overview
- Exhibit 167: Siemens AG - Business segments
- Exhibit 168: Siemens AG - Key news
- Exhibit 169: Siemens AG - Key offerings
- Exhibit 170: Siemens AG - Segment focus
- 12.14 Texas Instruments Inc.
- Exhibit 171: Texas Instruments Inc. - Overview
- Exhibit 172: Texas Instruments Inc. - Business segments
- Exhibit 173: Texas Instruments Inc. - Key news
- Exhibit 174: Texas Instruments Inc. - Key offerings
- Exhibit 175: Texas Instruments Inc. - Segment focus
- 12.15 The Weir Group Plc
- Exhibit 176: The Weir Group Plc - Overview
- Exhibit 177: The Weir Group Plc - Business segments
- Exhibit 178: The Weir Group Plc - Key news
- Exhibit 179: The Weir Group Plc - Key offerings
- Exhibit 180: The Weir Group Plc - Segment focus
- 12.16 Toshiba Corp.
- Exhibit 181: Toshiba Corp. - Overview
- Exhibit 182: Toshiba Corp. - Business segments
- Exhibit 183: Toshiba Corp. - Key news
- Exhibit 184: Toshiba Corp. - Key offerings
- Exhibit 185: Toshiba Corp. - Segment focus
- 12.17 Trilliant Holdings Inc.
- Exhibit 186: Trilliant Holdings Inc. - Overview
- Exhibit 187: Trilliant Holdings Inc. - Product / Service
- Exhibit 188: Trilliant Holdings Inc. - Key offerings
13 Appendix
- 13.1 Scope of the report
- 13.2 Inclusions and exclusions checklist
- Exhibit 189: Inclusions checklist
- Exhibit 190: Exclusions checklist
- 13.3 Currency conversion rates for US$
- Exhibit 191: Currency conversion rates for US$
- 13.4 Research methodology
- Exhibit 192: Research methodology
- Exhibit 193: Validation techniques employed for market sizing
- Exhibit 194: Information sources
- 13.5 List of abbreviations
- Exhibit 195: List of abbreviations
- in manufacturing industry: Market dynamics in some major processes and discrete industries are changing drastically, and manufacturers are gradually feeling the brunt of excessive demand fluctuations. The fluctuating prices of oil and gas and metals in the global market and the shortage of a skilled workforce worldwide have directly affected the profitability of manufacturing companies. A sudden and unexpected shift in market dynamics can drastically impact manufacturing processes and investments in capital goods.
- slowdown in the automotive industry: High motorization rates in North America and Europe, the increase in tariffs on imported vehicles in the US and China, and the global economic slowdown are likely to reduce vehicle sales in the coming years. Anticipating a decline in vehicle sales, several vehicle manufacturers are halting their vehicle production. For instance, in March 2019, Ford announced the shutdown of its three vehicle-manufacturing sites in Russia. Similarly, in August 2019, Mahindra and Mahindra Ltd. stopped vehicle production at its manufacturing units in India for 8-14 days. During the same month, Maruti Suzuki announced that it had cut its vehicle production for the sixth consecutive month in 2019. In August 2019, Honda announced a halt in car production at its Argentina-based manufacturing plants. Such a slowdown in the automotive industry is expected to hamper the growth of the market during the forecast period.
Research Framework
Technavio presents a detailed picture of the market by way of study, synthesis, and summation of data from multiple sources. The analysts have presented the various facets of the market with a particular focus on identifying the key industry influencers. The data thus presented is comprehensive, reliable, and the result of extensive research, both primary and secondary.
INFORMATION SOURCES
Primary sources
- Manufacturers and suppliers
- Channel partners
- Industry experts
- Strategic decision makers
Secondary sources
- Industry journals and periodicals
- Government data
- Financial reports of key industry players
- Historical data
- Press releases
DATA ANALYSIS
Data Synthesis
- Collation of data
- Estimation of key figures
- Analysis of derived insights
Data Validation
- Triangulation with data models
- Reference against proprietary databases
- Corroboration with industry experts
REPORT WRITING
Qualitative
- Market drivers
- Market challenges
- Market trends
- Five forces analysis
Quantitative
- Market size and forecast
- Market segmentation
- Geographical insights
- Competitive landscape
PURCHASE FULL REPORT OF
substation automation market market
Key Questions Answered
- What are the key global market and the regional market share?
- What are the revenue-generating key market segments?
- What are the key factors driving and challenging this market’s growth?
- Who are the key market vendors and their growth strategies?
- What are the latest trends influencing the growth of this market?
- What are the variables influencing the market growth in the primary regions?
- What are the factors influencing the growth of the parent market?
Why should you prefer Technavio's market insights report?
- Off-the-shelf research reports
- Reports can be tailored to meet the customer's needs
- Trusted by more than 100 fortune 500 organizations
- Information about the market's key drivers, trends, and challenges
- Parent market analysis
- Every week, 50,000 people visit our subscription platform
- Detailed vendors report with competitive landscape
- Covid-19 impact and recovery analysis
- Data on revenue-generating market segments
- Details on the market shares of various regions
- Five-force market analysis