Video Analytics Market Analysis North America, APAC, Europe, South America, Middle East and Africa - US, China, Japan, Germany, UK - Size and Forecast 2023-2027
| Published: Jan 2023 | Pages: 174 | SKU: IRTNTR45821 |
Video Analytics Market by End-User, Deployment, Geography - Forecast 2023-2027
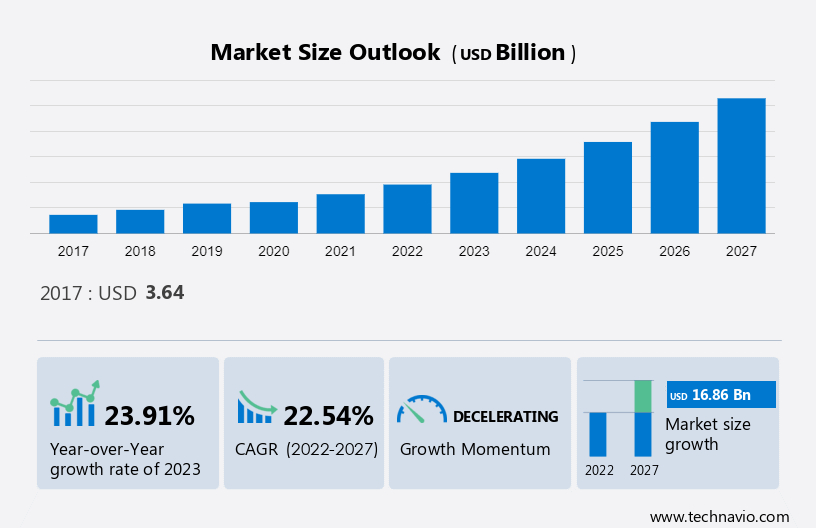
The video analytics market size is forecast to increase by USD 16.86 billion between 2022 and 2027, decelerating at a CAGR of 22.54%. In 2017, the US held the largest market share, projecting an annual revenue of USD 1.03 billion. The report offers extensive research analysis on the Video Analytics Market, with a categorization based on End-user, including Government sector, Commercial sector, Banking and financial services, Traffic management sector, and Others. It further segments the market by Deployment, encompassing On-premise and Cloud. Additionally, the report provides geographical segmentation, covering North America, APAC, Europe, South America, and Middle East and Africa. Market size, historical data (2017-2021), and future projections are presented in terms of value (USD billion) for all the mentioned segments.
What will be the Size of the Video Analytics Market During the Forecast Period?
To learn more about this report, Download Report Sample
Video Analytics Market Analysis
The rising demand for improved security arrangements is notably driving the market growth. An increase in the frequency and intensity of security breaches and security attacks including incidences of robbery, theft, shoplifting, and terrorist attacks has encouraged governments and large enterprises to adopt video analytics solutions to control anti-social activities.
Many developed countries such as the US and the UK have stringent regulations mandating the installation of video surveillance cameras in public places like hypermarkets, hospitals, airports, railway stations, hotels, and shopping malls. These regulations are aimed at ensuring enhanced security and curbing anti-social activities. Video analytics-enabled cameras provide real-time alerts and forensic tools for staffed and unstaffed video surveillance options. They automatically report suspicious events to maximize security and maintain operational efficiency. Such factors will contribute to the growth of the market during the forecast period.
Video Analytics Market Segment Trends
Government sector Leads the Market
The government sector segment was valued at USD 988.77 million in 2017 and continued to grow until 2021. The market share growth of the government sector segment will be significant during the forecast period. Video analytics technology has a significant role in the government sector. It helps to manage data collection and to analyze them efficiently to improve and enhance the security of government and military facilities. Data collected with the help of video analytics helps to increase situational awareness in premises, which is the primary requirement at military bases. Video analytics systems used in the sector can collect, collate, filter, and process all types of input, including unstructured data and live feeds. Such systems help in the integration and optimization of all resources and results. Video analytics identifies behaviors of interest and immediately alerts security operators to suspicious activities. This allows security operators to focus their attention on the most important activities with the highest risk potentials. Thus, they can make better decisions and react faster to events. Therefore, from the above-mentioned factors, it is expected that demand for video analytics in the enterprise segment will increase during the forecast period leading to market growth.
Video Analytics Market - Revenue Share by Government Sector Segment, 2017 - 2027.
For more details on other segments, Download Sample Report
APAC Holds a Prominent Position in the Video Analytics Market
APAC is estimated to contribute 41% to the growth of the global market during the forecast period.
Another region offering significant growth opportunities to vendors is North America. Technavio’s analysts have elaborately explained the regional trends and drivers that shape the market during the forecast period. The video analytics market in North America is expected to grow significantly during the forecast period. Because of the developed infrastructure, the market in North America is quite mature. However, growth in the construction of residential and commercial buildings is increasing the demand for video analytics for enhancing safety and security across such buildings in North America. Hence, the rapid growth in the construction of residential and commercial buildings is boosting the growth of the market in the region.
Market growth in the region is favored by the presence of global and regional vendors such as Agent Video Intelligence Ltd. (Agent Video Intelligence), Cisco Systems Inc. (Cisco Systems), Genetec Inc. (Genetec), etc. These vendors offer high-quality video analytics solutions for a wide range of industries. Hence, the widespread availability of video analytics solutions in North America is boosting the growth of the market in the region.
Video Analytics Market Size, By Region, Global, 2017 - 2027.
To understand geographic trends Download Report Sample
Video Analytics Market Companies Overview
The Video Analytics Market is fragmented in nature. Some significant players include Agent Video Intelligence Ltd., Alarm.com, AllGoVision Technologies Pvt. Ltd., BriefCam Ltd.
The research report also includes detailed analyses of the competitive landscape of the market and information about 15 market companies, including:
Canon Inc., Cisco Systems Inc., Genetec Inc., Gorilla Technology Inc., Honeywell International Inc., Huawei Investment and Holding Co. Ltd., i2V Systems Pvt. Ltd., Infinova, International Business Machines Corp., NEC Corp., NICE Ltd., PureTech Systems Inc., Robert Bosch GmbH, Verint Systems Inc., Viseum UK Group, and Zhejiang Dahua Technology Co. Ltd.
Segment Overview
The video analytics market report forecasts market growth by revenue at global, regional & country levels and provides an analysis of the latest trends and growth opportunities from 2017 - 2027.
- End-user Outlook
- Government sector
- Commercial sector
- Banking and financial services
- Traffic management sector
- Others
- Deployment Outlook
- On-premise
- Cloud
- Region Outlook
- North America
- The U.S.
- Canada
- APAC
- China
- India
- Europe
- The U.K.
- Germany
- France
- Rest of Europe
- South America
- Brazil
- Argentina
- Middle East & Africa
- Saudi Arabia
- South Africa
- Rest of the Middle East & Africa
- North America
|
Video Analytics Market Scope |
|
|
Report Coverage |
Details |
|
Page number |
174 |
|
Base year |
2022 |
|
Historic period |
2017 - 2021 |
|
Forecast period |
2023-2027 |
|
Growth momentum & CAGR |
Decelerate at a CAGR of 22.54% |
|
Market growth 2023-2027 |
USD 16.86 billion |
|
Market structure |
Fragmented |
|
YoY growth 2022-2023(%) |
23.91 |
|
Regional analysis |
North America, APAC, Europe, South America, and Middle East and Africa |
|
Performing market contribution |
APAC at 41% |
|
Key countries |
US, China, Japan, Germany, and UK |
|
Competitive landscape |
Leading Companies, Market Positioning of Companies, Competitive Strategies, and Industry Risks |
|
Key companies profiled |
Agent Video Intelligence Ltd., Alarm.com, AllGoVision Technologies Pvt. Ltd., BriefCam Ltd., Canon Inc., Cisco Systems Inc., Genetec Inc., Gorilla Technology Inc., Honeywell International Inc., Huawei Investment and Holding Co. Ltd., i2V Systems Pvt. Ltd., Infinova, International Business Machines Corp., NEC Corp., NICE Ltd., PureTech Systems Inc., Robert Bosch GmbH, Verint Systems Inc., Viseum UK Group, and Zhejiang Dahua Technology Co. Ltd. |
|
Market dynamics |
Parent market analysis, Market growth inducers and obstacles, Fast-growing and slow-growing segment analysis, COVID 19 impact and recovery analysis and future consumer dynamics, Market condition analysis for forecast period |
|
Customization purview |
If our report has not included the data that you are looking for, you can reach out to our analysts and get segments customized. |
What are the Key Data Covered in this Video Analytics Market Research Report?
- CAGR of the market during the forecast period
- Detailed information on factors that will drive the growth of the market between 2023 and 2027
- Precise estimation of the size of the market size and its contribution of the market in focus to the parent market
- Accurate predictions about upcoming trends and changes in consumer behaviour
- Growth of the market industry across North America, APAC, Europe, South America, and Middle East and Africa
- Thorough analysis of the market’s competitive landscape and detailed information about companies
- Comprehensive analysis of factors that will challenge the growth of market companies
We can help! Our analysts can customize this market research report to meet your requirements.
1 Executive Summary
- 1.1 Market overview
- Exhibit 01: Executive Summary – Chart on Market Overview
- Exhibit 02: Executive Summary – Data Table on Market Overview
- Exhibit 03: Executive Summary – Chart on Global Market Characteristics
- Exhibit 04: Executive Summary – Chart on Market by Geography
- Exhibit 05: Executive Summary – Chart on Market Segmentation by End-user
- Exhibit 06: Executive Summary – Chart on Market Segmentation by Deployment
- Exhibit 07: Executive Summary – Chart on Incremental Growth
- Exhibit 08: Executive Summary – Data Table on Incremental Growth
- Exhibit 09: Executive Summary – Chart on Vendor Market Positioning
2 Market Landscape
- 2.1 Market ecosystem
- Exhibit 10: Parent market
- Exhibit 11: Market Characteristics
3 Market Sizing
- 3.1 Market definition
- Exhibit 12: Offerings of vendors included in the market definition
- 3.2 Market segment analysis
- Exhibit 13: Market segments
- 3.3 Market size 2022
- 3.4 Market outlook: Forecast for 2022-2027
- Exhibit 14: Chart on Global - Market size and forecast 2022-2027 ($ billion)
- Exhibit 15: Data Table on Global - Market size and forecast 2022-2027 ($ billion)
- Exhibit 16: Chart on Global Market: Year-over-year growth 2022-2027 (%)
- Exhibit 17: Data Table on Global Market: Year-over-year growth 2022-2027 (%)
4 Historic Market Size
- 4.1 Global video analytics market 2017 - 2021
- Exhibit 18: Historic Market Size – Data Table on Global video analytics market 2017 - 2021 ($ billion)
- 4.2 End-user Segment Analysis 2017 - 2021
- Exhibit 19: Historic Market Size – End-user Segment 2017 - 2021 ($ billion)
- 4.3 Deployment Segment Analysis 2017 - 2021
- Exhibit 20: Historic Market Size – Deployment Segment 2017 - 2021 ($ billion)
- 4.4 Geography Segment Analysis 2017 - 2021
- Exhibit 21: Historic Market Size – Geography Segment 2017 - 2021 ($ billion)
- 4.5 Country Segment Analysis 2017 - 2021
- Exhibit 22: Historic Market Size – Country Segment 2017 - 2021 ($ billion)
5 Five Forces Analysis
- 5.1 Five forces summary
- Exhibit 23: Five forces analysis - Comparison between 2022 and 2027
- 5.2 Bargaining power of buyers
- Exhibit 24: Chart on Bargaining power of buyers – Impact of key factors 2022 and 2027
- 5.3 Bargaining power of suppliers
- Exhibit 25: Bargaining power of suppliers – Impact of key factors in 2022 and 2027
- 5.4 Threat of new entrants
- Exhibit 26: Threat of new entrants – Impact of key factors in 2022 and 2027
- 5.5 Threat of substitutes
- Exhibit 27: Threat of substitutes – Impact of key factors in 2022 and 2027
- 5.6 Threat of rivalry
- Exhibit 28: Threat of rivalry – Impact of key factors in 2022 and 2027
- 5.7 Market condition
- Exhibit 29: Chart on Market condition - Five forces 2022 and 2027
6 Market Segmentation by End-user
- 6.1 Market segments
- Exhibit 30: Chart on End-user - Market share 2022-2027 (%)
- Exhibit 31: Data Table on End-user - Market share 2022-2027 (%)
- 6.2 Comparison by End-user
- Exhibit 32: Chart on Comparison by End-user
- Exhibit 33: Data Table on Comparison by End-user
- 6.3 Government sector - Market size and forecast 2022-2027
- Exhibit 34: Chart on Government sector - Market size and forecast 2022-2027 ($ billion)
- Exhibit 35: Data Table on Government sector - Market size and forecast 2022-2027 ($ billion)
- Exhibit 36: Chart on Government sector - Year-over-year growth 2022-2027 (%)
- Exhibit 37: Data Table on Government sector - Year-over-year growth 2022-2027 (%)
- 6.4 Commercial sector - Market size and forecast 2022-2027
- Exhibit 38: Chart on Commercial sector - Market size and forecast 2022-2027 ($ billion)
- Exhibit 39: Data Table on Commercial sector - Market size and forecast 2022-2027 ($ billion)
- Exhibit 40: Chart on Commercial sector - Year-over-year growth 2022-2027 (%)
- Exhibit 41: Data Table on Commercial sector - Year-over-year growth 2022-2027 (%)
- 6.5 Banking and financial services - Market size and forecast 2022-2027
- Exhibit 42: Chart on Banking and financial services - Market size and forecast 2022-2027 ($ billion)
- Exhibit 43: Data Table on Banking and financial services - Market size and forecast 2022-2027 ($ billion)
- Exhibit 44: Chart on Banking and financial services - Year-over-year growth 2022-2027 (%)
- Exhibit 45: Data Table on Banking and financial services - Year-over-year growth 2022-2027 (%)
- 6.6 Traffic management sector - Market size and forecast 2022-2027
- Exhibit 46: Chart on Traffic management sector - Market size and forecast 2022-2027 ($ billion)
- Exhibit 47: Data Table on Traffic management sector - Market size and forecast 2022-2027 ($ billion)
- Exhibit 48: Chart on Traffic management sector - Year-over-year growth 2022-2027 (%)
- Exhibit 49: Data Table on Traffic management sector - Year-over-year growth 2022-2027 (%)
- 6.7 Others - Market size and forecast 2022-2027
- Exhibit 50: Chart on Others - Market size and forecast 2022-2027 ($ billion)
- Exhibit 51: Data Table on Others - Market size and forecast 2022-2027 ($ billion)
- Exhibit 52: Chart on Others - Year-over-year growth 2022-2027 (%)
- Exhibit 53: Data Table on Others - Year-over-year growth 2022-2027 (%)
- 6.8 Market opportunity by End-user
- Exhibit 54: Market opportunity by End-user ($ billion)
7 Market Segmentation by Deployment
- 7.1 Market segments
- Exhibit 55: Chart on Deployment - Market share 2022-2027 (%)
- Exhibit 56: Data Table on Deployment - Market share 2022-2027 (%)
- 7.2 Comparison by Deployment
- Exhibit 57: Chart on Comparison by Deployment
- Exhibit 58: Data Table on Comparison by Deployment
- 7.3 On-premise - Market size and forecast 2022-2027
- Exhibit 59: Chart on On-premise - Market size and forecast 2022-2027 ($ billion)
- Exhibit 60: Data Table on On-premise - Market size and forecast 2022-2027 ($ billion)
- Exhibit 61: Chart on On-premise - Year-over-year growth 2022-2027 (%)
- Exhibit 62: Data Table on On-premise - Year-over-year growth 2022-2027 (%)
- 7.4 Cloud - Market size and forecast 2022-2027
- Exhibit 63: Chart on Cloud - Market size and forecast 2022-2027 ($ billion)
- Exhibit 64: Data Table on Cloud - Market size and forecast 2022-2027 ($ billion)
- Exhibit 65: Chart on Cloud - Year-over-year growth 2022-2027 (%)
- Exhibit 66: Data Table on Cloud - Year-over-year growth 2022-2027 (%)
- 7.5 Market opportunity by Deployment
- Exhibit 67: Market opportunity by Deployment ($ billion)
8 Customer Landscape
- 8.1 Customer landscape overview
- Exhibit 68: Analysis of price sensitivity, lifecycle, customer purchase basket, adoption rates, and purchase criteria
9 Geographic Landscape
- 9.1 Geographic segmentation
- Exhibit 69: Chart on Market share by geography 2022-2027 (%)
- Exhibit 70: Data Table on Market share by geography 2022-2027 (%)
- 9.2 Geographic comparison
- Exhibit 71: Chart on Geographic comparison
- Exhibit 72: Data Table on Geographic comparison
- 9.3 North America - Market size and forecast 2022-2027
- Exhibit 73: Chart on North America - Market size and forecast 2022-2027 ($ billion)
- Exhibit 74: Data Table on North America - Market size and forecast 2022-2027 ($ billion)
- Exhibit 75: Chart on North America - Year-over-year growth 2022-2027 (%)
- Exhibit 76: Data Table on North America - Year-over-year growth 2022-2027 (%)
- 9.4 APAC - Market size and forecast 2022-2027
- Exhibit 77: Chart on APAC - Market size and forecast 2022-2027 ($ billion)
- Exhibit 78: Data Table on APAC - Market size and forecast 2022-2027 ($ billion)
- Exhibit 79: Chart on APAC - Year-over-year growth 2022-2027 (%)
- Exhibit 80: Data Table on APAC - Year-over-year growth 2022-2027 (%)
- 9.5 Europe - Market size and forecast 2022-2027
- Exhibit 81: Chart on Europe - Market size and forecast 2022-2027 ($ billion)
- Exhibit 82: Data Table on Europe - Market size and forecast 2022-2027 ($ billion)
- Exhibit 83: Chart on Europe - Year-over-year growth 2022-2027 (%)
- Exhibit 84: Data Table on Europe - Year-over-year growth 2022-2027 (%)
- 9.6 South America - Market size and forecast 2022-2027
- Exhibit 85: Chart on South America - Market size and forecast 2022-2027 ($ billion)
- Exhibit 86: Data Table on South America - Market size and forecast 2022-2027 ($ billion)
- Exhibit 87: Chart on South America - Year-over-year growth 2022-2027 (%)
- Exhibit 88: Data Table on South America - Year-over-year growth 2022-2027 (%)
- 9.7 Middle East and Africa - Market size and forecast 2022-2027
- Exhibit 89: Chart on Middle East and Africa - Market size and forecast 2022-2027 ($ billion)
- Exhibit 90: Data Table on Middle East and Africa - Market size and forecast 2022-2027 ($ billion)
- Exhibit 91: Chart on Middle East and Africa - Year-over-year growth 2022-2027 (%)
- Exhibit 92: Data Table on Middle East and Africa - Year-over-year growth 2022-2027 (%)
- 9.8 US - Market size and forecast 2022-2027
- Exhibit 93: Chart on US - Market size and forecast 2022-2027 ($ billion)
- Exhibit 94: Data Table on US - Market size and forecast 2022-2027 ($ billion)
- Exhibit 95: Chart on US - Year-over-year growth 2022-2027 (%)
- Exhibit 96: Data Table on US - Year-over-year growth 2022-2027 (%)
- 9.9 China - Market size and forecast 2022-2027
- Exhibit 97: Chart on China - Market size and forecast 2022-2027 ($ billion)
- Exhibit 98: Data Table on China - Market size and forecast 2022-2027 ($ billion)
- Exhibit 99: Chart on China - Year-over-year growth 2022-2027 (%)
- Exhibit 100: Data Table on China - Year-over-year growth 2022-2027 (%)
- 9.10 Germany - Market size and forecast 2022-2027
- Exhibit 101: Chart on Germany - Market size and forecast 2022-2027 ($ billion)
- Exhibit 102: Data Table on Germany - Market size and forecast 2022-2027 ($ billion)
- Exhibit 103: Chart on Germany - Year-over-year growth 2022-2027 (%)
- Exhibit 104: Data Table on Germany - Year-over-year growth 2022-2027 (%)
- 9.11 Japan - Market size and forecast 2022-2027
- Exhibit 105: Chart on Japan - Market size and forecast 2022-2027 ($ billion)
- Exhibit 106: Data Table on Japan - Market size and forecast 2022-2027 ($ billion)
- Exhibit 107: Chart on Japan - Year-over-year growth 2022-2027 (%)
- Exhibit 108: Data Table on Japan - Year-over-year growth 2022-2027 (%)
- 9.12 UK - Market size and forecast 2022-2027
- Exhibit 109: Chart on UK - Market size and forecast 2022-2027 ($ billion)
- Exhibit 110: Data Table on UK - Market size and forecast 2022-2027 ($ billion)
- Exhibit 111: Chart on UK - Year-over-year growth 2022-2027 (%)
- Exhibit 112: Data Table on UK - Year-over-year growth 2022-2027 (%)
- 9.13 Market opportunity by geography
- Exhibit 113: Market opportunity by geography ($ billion)
10 Drivers, Challenges, and Trends
- 10.1 Market drivers
- 10.2 Market challenges
- 10.3 Impact of drivers and challenges
- Exhibit 114: Impact of drivers and challenges in 2022 and 2027
- 10.4 Market trends
11 Vendor Landscape
- 11.1 Overview
- 11.2 Vendor landscape
- Exhibit 115: Overview on Criticality of inputs and Factors of differentiation
- 11.3 Landscape disruption
- Exhibit 116: Overview on factors of disruption
- 11.4 Industry risks
- Exhibit 117: Impact of key risks on business
12 Vendor Analysis
- 12.1 Vendors covered
- Exhibit 118: Vendors covered
- 12.2 Market positioning of vendors
- Exhibit 119: Matrix on vendor position and classification
- 12.3 Agent Video Intelligence Ltd.
- Exhibit 120: Agent Video Intelligence Ltd. - Overview
- Exhibit 121: Agent Video Intelligence Ltd. - Product / Service
- Exhibit 122: Agent Video Intelligence Ltd. - Key offerings
- 12.4 AllGoVision Technologies Pvt. Ltd.
- Exhibit 123: AllGoVision Technologies Pvt. Ltd. - Overview
- Exhibit 124: AllGoVision Technologies Pvt. Ltd. - Product / Service
- Exhibit 125: AllGoVision Technologies Pvt. Ltd. - Key offerings
- 12.5 BriefCam Ltd.
- Exhibit 126: BriefCam Ltd. - Overview
- Exhibit 127: BriefCam Ltd. - Product / Service
- Exhibit 128: BriefCam Ltd. - Key offerings
- 12.6 Canon Inc.
- Exhibit 129: Canon Inc. - Overview
- Exhibit 130: Canon Inc. - Business segments
- Exhibit 131: Canon Inc. - Key news
- Exhibit 132: Canon Inc. - Key offerings
- Exhibit 133: Canon Inc. - Segment focus
- 12.7 Cisco Systems Inc.
- Exhibit 134: Cisco Systems Inc. - Overview
- Exhibit 135: Cisco Systems Inc. - Business segments
- Exhibit 136: Cisco Systems Inc. - Key news
- Exhibit 137: Cisco Systems Inc. - Key offerings
- Exhibit 138: Cisco Systems Inc. - Segment focus
- 12.8 Genetec Inc.
- Exhibit 139: Genetec Inc. - Overview
- Exhibit 140: Genetec Inc. - Product / Service
- Exhibit 141: Genetec Inc. - Key offerings
- 12.9 Gorilla Technology Inc.
- Exhibit 142: Gorilla Technology Inc. - Overview
- Exhibit 143: Gorilla Technology Inc. - Product / Service
- Exhibit 144: Gorilla Technology Inc. - Key offerings
- 12.10 Honeywell International Inc.
- Exhibit 145: Honeywell International Inc. - Overview
- Exhibit 146: Honeywell International Inc. - Business segments
- Exhibit 147: Honeywell International Inc. - Key news
- Exhibit 148: Honeywell International Inc. - Key offerings
- Exhibit 149: Honeywell International Inc. - Segment focus
- 12.11 Huawei Investment and Holding Co. Ltd.
- Exhibit 150: Huawei Investment and Holding Co. Ltd. - Overview
- Exhibit 151: Huawei Investment and Holding Co. Ltd. - Business segments
- Exhibit 152: Huawei Investment and Holding Co. Ltd. - Key news
- Exhibit 153: Huawei Investment and Holding Co. Ltd. - Key offerings
- Exhibit 154: Huawei Investment and Holding Co. Ltd. - Segment focus
- 12.12 Infinova
- Exhibit 155: Infinova - Overview
- Exhibit 156: Infinova - Product / Service
- Exhibit 157: Infinova - Key offerings
- 12.13 International Business Machines Corp.
- Exhibit 158: International Business Machines Corp. - Overview
- Exhibit 159: International Business Machines Corp. - Business segments
- Exhibit 160: International Business Machines Corp. - Key news
- Exhibit 161: International Business Machines Corp. - Key offerings
- Exhibit 162: International Business Machines Corp. - Segment focus
- 12.14 NEC Corp.
- Exhibit 163: NEC Corp. - Overview
- Exhibit 164: NEC Corp. - Business segments
- Exhibit 165: NEC Corp. - Key news
- Exhibit 166: NEC Corp. - Key offerings
- Exhibit 167: NEC Corp. - Segment focus
- 12.15 NICE Ltd.
- Exhibit 168: NICE Ltd. - Overview
- Exhibit 169: NICE Ltd. - Business segments
- Exhibit 170: NICE Ltd. - Key news
- Exhibit 171: NICE Ltd. - Key offerings
- Exhibit 172: NICE Ltd. - Segment focus
- 12.16 PureTech Systems Inc.
- Exhibit 173: PureTech Systems Inc. - Overview
- Exhibit 174: PureTech Systems Inc. - Product / Service
- Exhibit 175: PureTech Systems Inc. - Key offerings
- 12.17 Robert Bosch GmbH
- Exhibit 176: Robert Bosch GmbH - Overview
- Exhibit 177: Robert Bosch GmbH - Business segments
- Exhibit 178: Robert Bosch GmbH - Key offerings
- Exhibit 179: Robert Bosch GmbH - Segment focus
13 Appendix
- 13.1 Scope of the report
- 13.2 Inclusions and exclusions checklist
- Exhibit 180: Inclusions checklist
- Exhibit 181: Exclusions checklist
- 13.3 Currency conversion rates for US$
- Exhibit 182: Currency conversion rates for US$
- 13.4 Research methodology
- Exhibit 183: Research methodology
- Exhibit 184: Validation techniques employed for market sizing
- Exhibit 185: Information sources
- 13.5 List of abbreviations
- Exhibit 186: List of abbreviations
Research Framework
Technavio presents a detailed picture of the market by way of study, synthesis, and summation of data from multiple sources. The analysts have presented the various facets of the market with a particular focus on identifying the key industry influencers. The data thus presented is comprehensive, reliable, and the result of extensive research, both primary and secondary.
INFORMATION SOURCES
Primary sources
- Manufacturers and suppliers
- Channel partners
- Industry experts
- Strategic decision makers
Secondary sources
- Industry journals and periodicals
- Government data
- Financial reports of key industry players
- Historical data
- Press releases
DATA ANALYSIS
Data Synthesis
- Collation of data
- Estimation of key figures
- Analysis of derived insights
Data Validation
- Triangulation with data models
- Reference against proprietary databases
- Corroboration with industry experts
REPORT WRITING
Qualitative
- Market drivers
- Market challenges
- Market trends
- Five forces analysis
Quantitative
- Market size and forecast
- Market segmentation
- Geographical insights
- Competitive landscape
PURCHASE FULL REPORT OF
video analytics market market
Key Questions Answered
- What are the key global market and the regional market share?
- What are the revenue-generating key market segments?
- What are the key factors driving and challenging this market’s growth?
- Who are the key market vendors and their growth strategies?
- What are the latest trends influencing the growth of this market?
- What are the variables influencing the market growth in the primary regions?
- What are the factors influencing the growth of the parent market?
Why should you prefer Technavio's market insights report?
- Off-the-shelf research reports
- Reports can be tailored to meet the customer's needs
- Trusted by more than 100 fortune 500 organizations
- Information about the market's key drivers, trends, and challenges
- Parent market analysis
- Every week, 50,000 people visit our subscription platform
- Detailed vendors report with competitive landscape
- Covid-19 impact and recovery analysis
- Data on revenue-generating market segments
- Details on the market shares of various regions
- Five-force market analysis