Wagyu Beef Market Analysis APAC, North America, Europe, Middle East and Africa, South America - US, Japan, Hong Kong, Australia, UK - Size and Forecast 2023-2027
| Published: Oct 2023 | Pages: 156 | SKU: IRTNTR71738 |
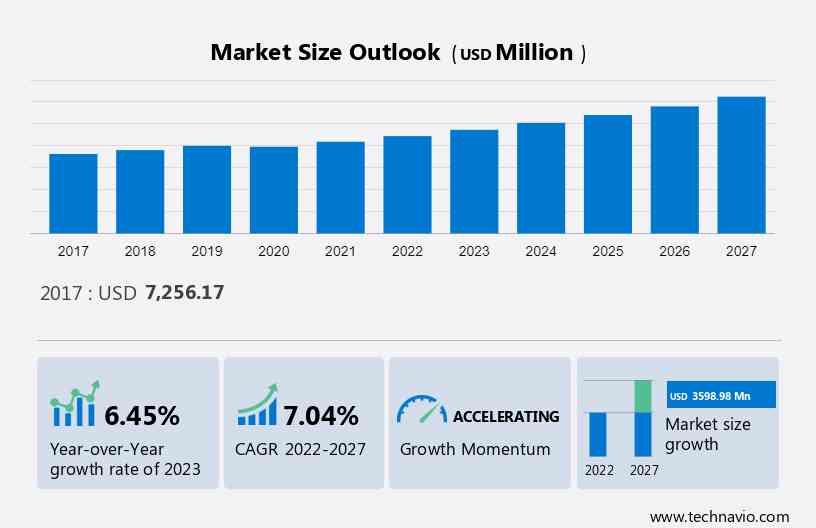
Wagyu Beef Market Forecast 2023-2027
The Wagyu Beef Market size is projected to increase by USD 3,598.98 million and the market size is estimated to grow at a CAGR of 7.04% between 2022 and 2027.
The market is experiencing significant growth due to the increasing production and trade. Japan holds the leading position as the largest exporter since 2020, closely followed by Australia. The rising stock of this beef in Japan is expected to drive growth in the global market during the forecast period, as it helps meet the growing demand for this premium meat. Governments' initiatives to promote the production, such as Japan's support payments to these cattle producers under the Japan Beef Livestock Stabilisation Programme (Marukin), have led to increased production, further propelling the market growth in the forecast period. It also includes an in-depth analysis of drivers, trends, and challenges.
Wagyu Beef Market: Overview
To get additional information about the market, Request Free Sample
Major Trends
The Cell-cultured beef and enhanced traceability measures are driving trends in the market. Researchers worldwide are innovating with cell culture technology to develop meat, while unique identification numbers on beef products offer consumers detailed information about the cattle's origin. This increased traceability reduces counterfeit products and boosts consumer confidence, leading to market growth in the forecast period.
Significant Challenge
The high premium price is a significant challenge for the market. With costs about three times higher than other meats, price-sensitive consumers may be discouraged. However, the exclusive taste profile of the beef, especially Kobe beef, is gaining popularity in fine dining restaurants worldwide. The premium prices are attributed to the meticulous cattle-raising processes required for the unique marbling gene in wagyu. Skilled ranchers create a stress-free environment for cattle, which further drives up prices. Additionally, the ban on Chinese rice straw imports in Japan due to the African swine fever outbreak is expected to increase the prices further.
Market Segmentation by Product
Based on product, the largest segment in the market is the Japanese breed. Japan has actively promoted consumption through various initiatives, driving its popularity worldwide. The fine dining industry, including Michelin Star restaurants, is a key consumer of premium Japanese beef like Kobe beef. This contributes to the segment's growth during the forecast period.
On the other hand, Australian beef is mainly exported globally. Ban on Japanese meat imports by countries like China, following disease outbreaks in Japan, has led to increased consumption of Australian wagyu. Over 60% of Australia's beef exports are sent to markets in Asia, China, Europe, and the Middle East since 2020, with Australia's Wagyu Association being the largest breed association outside Japan.
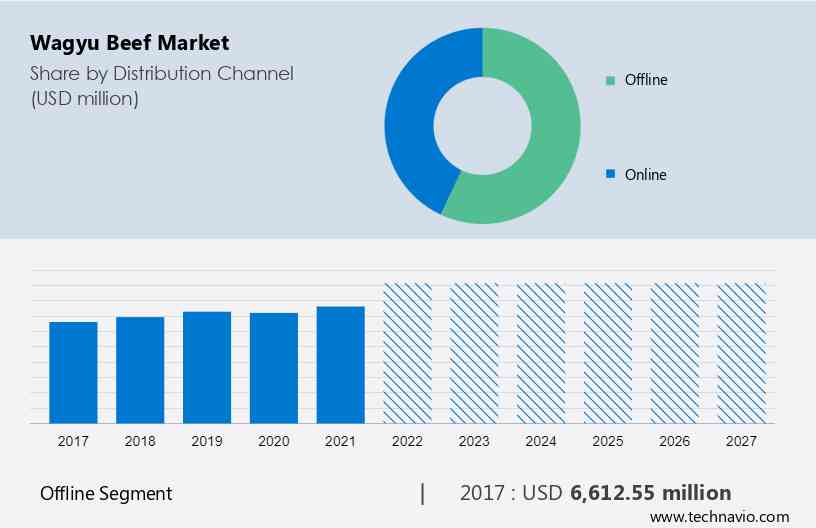
Market Segmentation by Distribution Channel
The market share growth by the offline segment will be significant during the forecast period. Offline distribution is characterized by supermarkets, hypermarkets, specialty shops, major discounters, and convenience stores. On the product packages in their shops, retailers are using promotional and marketing strategies including branding with signs or discounts. Growth in the global retail sector can be attributed to the popularity of retail outlets.
The Offline segment was valued at USD 6,612.55 million in 2017 and continued to grow until 2021.
For a detailed summary of the market segments Request for Sample Report
Consumers are attracted to the large discount offers of supermarkets and hypermarkets, as well as their use of appealing cabinets for showing different types of meat. In 2021 and 2022, the increased vaccination rate across the world led to the lifting of social distancing restrictions which, in turn, led to the restoration of the supply chain through offline channels. Hence, the market is expected to witness growth during the forecast period.
Key Regions for the Market
APAC is estimated to contribute 74% to the growth of the global market during the forecast period
Get a glance at the market share of various regions View PDF Sample
Technavio’s analysts have elaborately explained the regional trends and drivers that shape the market during the forecast period. The regional market in APAC is primarily driven by the high consumption in countries such as Japan. In addition, the high volume trade is a key driver for the regional market. In APAC, Japan and Australia are the leading producers and exporters. The major importers are Hong Kong, Taiwan, and Singapore.
Moreover, the market in APAC faces various challenges, including the ban on beef imported from Japan. China is one of the largest meat-consuming countries, and the ban on the import is impacting market growth in APAC. Moreover, In recent years, India's political campaign against meat consumption has put the growth of markets in APAC at risk during this forecast period. A major growth factor for the markets in the Asia Pacific is the growing food service sector. Wagyu beef products are being offered in several new restaurants, which can lead to higher consumption of meat. The market is expected to grow during the forecast period driven by an increasing food service sector.
Wagyu Beef Market Company Overview
Companies are implementing various strategies, such as strategic alliances, partnerships, mergers and acquisitions, geographical expansion, and product/service launches, to enhance their presence in the market.
- Key Offering - Agri Beef Co. - The company offers wagyu beef under the brands SRF snake river farms, Double R Ranch Northwest Beef, and St. Helens Beef.
- Key Offering - Australian Agricultural Co Ltd - The company offers wagyu beef under the brand Westholme and Darling Downs.
- Key Offering - Black Hawk Farms - The company offers wagyu beef such as Black Label, and Reserve Label.
The market report also includes detailed analyses of the competitive landscape of the market and information about 15 market companies, including:
- Agri Beef Co.
- Australian Agricultural Co Ltd
- Black Hawk Farms
- Blackmore Wagyu
- Chicago Steak Co.
- DEBRAGGA Inc.
- Dolan Foods Inc.
- GRAND WESTERN
- Havel Wagyu GbR
- Holy Grail Steak Co.
- Japan PREMIUM BEEF Inc.
- JBS SA
- Lone Mountain Wagyu LLC
- Masami Cattle Ranch Inc.
- Morgan Ranch Inc.
- Starzen Co. Ltd.
- Stockyard Pty Ltd
- Sugar Mountain
- WAGYU MASTER Europe GmbH
- Wagyu World
Qualitative and quantitative analysis of companies has been conducted to help clients understand the wider business environment as well as the strengths and weaknesses of key market players. Data is qualitatively analyzed to categorize companies as pure play, category-focused, industry-focused, and diversified; it is quantitatively analyzed to categorize companies as dominant, leading, strong, tentative, and weak.
Segment Overview
The market report forecasts market growth by revenue at global, regional & country levels and provides an analysis of the market growth and trends opportunities from 2017 to 2027.
- Distribution Channel Outlook (USD Million, 2017 - 2027)
- Offline
- Online
- Product Outlook (USD Million, 2017 - 2027)
- Japanese breed
- Australian breed
- Others
- Region Outlook (USD Million, 2017 - 2027)
- North America
- The U.S.
- Canada
- Europe
- The U.K.
- Germany
- France
- Rest of Europe
- APAC
- China
- India
- Middle East & Africa
- Saudi Arabia
- South Africa
- Rest of the Middle East & Africa
- South America
- Chile
- Argentina
- Brazil
- North America
Market Analyst Overview
The Market is thriving due to the increasing demand for premium-quality meat and the health benefits associated with it. Wagyu beef is known for its marbling and tenderness, making it a popular choice among consumers seeking premiumization in their meat choices.
The market is witnessing a trend towards new flavors and product introductions, catering to evolving consumer preferences. Brand loyalty is also a significant factor driving the market, with consumers willing to pay a premium for the quality and taste of Wagyu beef. The rise of e-commerce websites has further boosted the market, with a significant portion of sales now happening through online channels. As consumer awareness and demand continue to grow, the Wagyu beef market is expected to expand further in the coming years.
|
Wagyu Beef Market Scope |
|
|
Report Coverage |
Details |
|
Page number |
156 |
|
Base year |
2022 |
|
Historic period |
2017-2021 |
|
Forecast period |
2023-2027 |
|
Growth momentum & CAGR |
Accelerate at a CAGR of 7.04% |
|
Market growth 2023-2027 |
USD 3598.98 million |
|
Market structure |
USD Fragmented |
|
YoY growth 2022-2023(%) |
6.45 |
|
Regional analysis |
APAC, North America, Europe, Middle East and Africa, and South America |
|
Performing market contribution |
APAC at 74% |
|
Key countries |
US, Japan, Hong Kong, Australia, and UK |
|
Competitive landscape |
Leading Companies, Market Positioning of Companies, Competitive Strategies, and Industry Risks |
|
Key companies profiled |
Agri Beef Co., Australian Agricultural Co Ltd, Black Hawk Farms, Blackmore Wagyu, Chicago Steak Co., DEBRAGGA Inc., Dolan Foods Inc., GRAND WESTERN, Havel Wagyu GbR, Holy Grail Steak Co., Japan PREMIUM BEEF Inc., JBS SA, Lone Mountain Wagyu LLC, Masami Cattle Ranch Inc., Morgan Ranch Inc., Starzen Co. Ltd., Stockyard Pty Ltd, Sugar Mountain, WAGYU MASTER Europe GmbH, and Wagyu World |
|
Market dynamics |
Parent market analysis, Market forecasting, Market growth inducers and obstacles, Fast-growing and slow-growing segment analysis, COVID 19 impact and recovery analysis and future consumer dynamics, Market condition analysis for forecast period |
|
Customization purview |
If our market analysis and report has not included the data that you are looking for, you can reach out to our analysts and get segments customized. |
BUY NOW Full Report and Discover more
What are the Key Data Covered in this Market Research Report?
- CAGR of the market during the forecast period
- Detailed information on factors that will drive the market growth and forecasting of the market between 2023 and 2027
- Precise estimation of the size of the market size and its contribution to the parent market
- Accurate predictions about upcoming market trends and analysis and changes in consumer behavior
- Growth of the market industry across Europe, North America, APAC, South America, and Middle East and Africa
- Thorough market growth analysis of the market’s competitive landscape and detailed information about vendors
- Comprehensive market analysis and report on the factors that will challenge the market research and growth of market vendors
We can help! Our analysts can customize this market research report to meet your requirements. Get in touch
1 Executive Summary
- 1.1 Market overview
- Exhibit 01: Executive Summary – Chart on Market Overview
- Exhibit 02: Executive Summary – Data Table on Market Overview
- Exhibit 03: Executive Summary – Chart on Global Market Characteristics
- Exhibit 04: Executive Summary – Chart on Market by Geography
- Exhibit 05: Executive Summary – Chart on Market Segmentation by Distribution Channel
- Exhibit 06: Executive Summary – Chart on Market Segmentation by Product
- Exhibit 07: Executive Summary – Chart on Incremental Growth
- Exhibit 08: Executive Summary – Data Table on Incremental Growth
- Exhibit 09: Executive Summary – Chart on Vendor Market Positioning
2 Market Landscape
- 2.1 Market ecosystem
- Exhibit 10: Parent market
- Exhibit 11: Market Characteristics
3 Market Sizing
- 3.1 Market definition
- Exhibit 12: Offerings of vendors included in the market definition
- 3.2 Market segment analysis
- Exhibit 13: Market segments
- 3.3 Market size 2022
- 3.4 Market outlook: Forecast for 2022-2027
- Exhibit 14: Chart on Global - Market size and forecast 2022-2027 ($ million)
- Exhibit 15: Data Table on Global - Market size and forecast 2022-2027 ($ million)
- Exhibit 16: Chart on Global Market: Year-over-year growth 2022-2027 (%)
- Exhibit 17: Data Table on Global Market: Year-over-year growth 2022-2027 (%)
4 Historic Market Size
- 4.1 Global wagyu beef market 2017 - 2021
- Exhibit 18: Historic Market Size – Data Table on global wagyu beef market 2017 - 2021 ($ million)
- 4.2 Distribution Channel Segment Analysis 2017 - 2021
- Exhibit 19: Historic Market Size – Distribution Channel Segment 2017 - 2021 ($ million)
- 4.3 Product Segment Analysis 2017 - 2021
- Exhibit 20: Historic Market Size – Product Segment 2017 - 2021 ($ million)
- 4.4 Geography Segment Analysis 2017 - 2021
- Exhibit 21: Historic Market Size – Geography Segment 2017 - 2021 ($ million)
- 4.5 Country Segment Analysis 2017 - 2021
- Exhibit 22: Historic Market Size – Country Segment 2017 - 2021 ($ million)
5 Five Forces Analysis
- 5.1 Five forces summary
- Exhibit 23: Five forces analysis - Comparison between 2022 and 2027
- 5.2 Bargaining power of buyers
- Exhibit 24: Chart on Bargaining power of buyers – Impact of key factors 2022 and 2027
- 5.3 Bargaining power of suppliers
- Exhibit 25: Bargaining power of suppliers – Impact of key factors in 2022 and 2027
- 5.4 Threat of new entrants
- Exhibit 26: Threat of new entrants – Impact of key factors in 2022 and 2027
- 5.5 Threat of substitutes
- Exhibit 27: Threat of substitutes – Impact of key factors in 2022 and 2027
- 5.6 Threat of rivalry
- Exhibit 28: Threat of rivalry – Impact of key factors in 2022 and 2027
- 5.7 Market condition
- Exhibit 29: Chart on Market condition - Five forces 2022 and 2027
6 Market Segmentation by Distribution Channel
- 6.1 Market segments
- Exhibit 30: Chart on Distribution Channel - Market share 2022-2027 (%)
- Exhibit 31: Data Table on Distribution Channel - Market share 2022-2027 (%)
- 6.2 Comparison by Distribution Channel
- Exhibit 32: Chart on Comparison by Distribution Channel
- Exhibit 33: Data Table on Comparison by Distribution Channel
- 6.3 Offline - Market size and forecast 2022-2027
- Exhibit 34: Chart on Offline - Market size and forecast 2022-2027 ($ million)
- Exhibit 35: Data Table on Offline - Market size and forecast 2022-2027 ($ million)
- Exhibit 36: Chart on Offline - Year-over-year growth 2022-2027 (%)
- Exhibit 37: Data Table on Offline - Year-over-year growth 2022-2027 (%)
- 6.4 Online - Market size and forecast 2022-2027
- Exhibit 38: Chart on Online - Market size and forecast 2022-2027 ($ million)
- Exhibit 39: Data Table on Online - Market size and forecast 2022-2027 ($ million)
- Exhibit 40: Chart on Online - Year-over-year growth 2022-2027 (%)
- Exhibit 41: Data Table on Online - Year-over-year growth 2022-2027 (%)
- 6.5 Market opportunity by Distribution Channel
- Exhibit 42: Market opportunity by Distribution Channel ($ million)
- Exhibit 43: Data Table on Market opportunity by Distribution Channel ($ million)
7 Market Segmentation by Product
- 7.1 Market segments
- Exhibit 44: Chart on Product - Market share 2022-2027 (%)
- Exhibit 45: Data Table on Product - Market share 2022-2027 (%)
- 7.2 Comparison by Product
- Exhibit 46: Chart on Comparison by Product
- Exhibit 47: Data Table on Comparison by Product
- 7.3 Japanese breed - Market size and forecast 2022-2027
- Exhibit 48: Chart on Japanese breed - Market size and forecast 2022-2027 ($ million)
- Exhibit 49: Data Table on Japanese breed - Market size and forecast 2022-2027 ($ million)
- Exhibit 50: Chart on Japanese breed - Year-over-year growth 2022-2027 (%)
- Exhibit 51: Data Table on Japanese breed - Year-over-year growth 2022-2027 (%)
- 7.4 Australian breed - Market size and forecast 2022-2027
- Exhibit 52: Chart on Australian breed - Market size and forecast 2022-2027 ($ million)
- Exhibit 53: Data Table on Australian breed - Market size and forecast 2022-2027 ($ million)
- Exhibit 54: Chart on Australian breed - Year-over-year growth 2022-2027 (%)
- Exhibit 55: Data Table on Australian breed - Year-over-year growth 2022-2027 (%)
- 7.5 Others - Market size and forecast 2022-2027
- Exhibit 56: Chart on Others - Market size and forecast 2022-2027 ($ million)
- Exhibit 57: Data Table on Others - Market size and forecast 2022-2027 ($ million)
- Exhibit 58: Chart on Others - Year-over-year growth 2022-2027 (%)
- Exhibit 59: Data Table on Others - Year-over-year growth 2022-2027 (%)
- 7.6 Market opportunity by Product
- Exhibit 60: Market opportunity by Product ($ million)
- Exhibit 61: Data Table on Market opportunity by Product ($ million)
8 Customer Landscape
- 8.1 Customer landscape overview
- Exhibit 62: Analysis of price sensitivity, lifecycle, customer purchase basket, adoption rates, and purchase criteria
9 Geographic Landscape
- 9.1 Geographic segmentation
- Exhibit 63: Chart on Market share by geography 2022-2027 (%)
- Exhibit 64: Data Table on Market share by geography 2022-2027 (%)
- 9.2 Geographic comparison
- Exhibit 65: Chart on Geographic comparison
- Exhibit 66: Data Table on Geographic comparison
- 9.3 APAC - Market size and forecast 2022-2027
- Exhibit 67: Chart on APAC - Market size and forecast 2022-2027 ($ million)
- Exhibit 68: Data Table on APAC - Market size and forecast 2022-2027 ($ million)
- Exhibit 69: Chart on APAC - Year-over-year growth 2022-2027 (%)
- Exhibit 70: Data Table on APAC - Year-over-year growth 2022-2027 (%)
- 9.4 North America - Market size and forecast 2022-2027
- Exhibit 71: Chart on North America - Market size and forecast 2022-2027 ($ million)
- Exhibit 72: Data Table on North America - Market size and forecast 2022-2027 ($ million)
- Exhibit 73: Chart on North America - Year-over-year growth 2022-2027 (%)
- Exhibit 74: Data Table on North America - Year-over-year growth 2022-2027 (%)
- 9.5 Europe - Market size and forecast 2022-2027
- Exhibit 75: Chart on Europe - Market size and forecast 2022-2027 ($ million)
- Exhibit 76: Data Table on Europe - Market size and forecast 2022-2027 ($ million)
- Exhibit 77: Chart on Europe - Year-over-year growth 2022-2027 (%)
- Exhibit 78: Data Table on Europe - Year-over-year growth 2022-2027 (%)
- 9.6 Middle East and Africa - Market size and forecast 2022-2027
- Exhibit 79: Chart on Middle East and Africa - Market size and forecast 2022-2027 ($ million)
- Exhibit 80: Data Table on Middle East and Africa - Market size and forecast 2022-2027 ($ million)
- Exhibit 81: Chart on Middle East and Africa - Year-over-year growth 2022-2027 (%)
- Exhibit 82: Data Table on Middle East and Africa - Year-over-year growth 2022-2027 (%)
- 9.7 South America - Market size and forecast 2022-2027
- Exhibit 83: Chart on South America - Market size and forecast 2022-2027 ($ million)
- Exhibit 84: Data Table on South America - Market size and forecast 2022-2027 ($ million)
- Exhibit 85: Chart on South America - Year-over-year growth 2022-2027 (%)
- Exhibit 86: Data Table on South America - Year-over-year growth 2022-2027 (%)
- 9.8 Japan - Market size and forecast 2022-2027
- Exhibit 87: Chart on Japan - Market size and forecast 2022-2027 ($ million)
- Exhibit 88: Data Table on Japan - Market size and forecast 2022-2027 ($ million)
- Exhibit 89: Chart on Japan - Year-over-year growth 2022-2027 (%)
- Exhibit 90: Data Table on Japan - Year-over-year growth 2022-2027 (%)
- 9.9 US - Market size and forecast 2022-2027
- Exhibit 91: Chart on US - Market size and forecast 2022-2027 ($ million)
- Exhibit 92: Data Table on US - Market size and forecast 2022-2027 ($ million)
- Exhibit 93: Chart on US - Year-over-year growth 2022-2027 (%)
- Exhibit 94: Data Table on US - Year-over-year growth 2022-2027 (%)
- 9.10 Hong Kong - Market size and forecast 2022-2027
- Exhibit 95: Chart on Hong Kong - Market size and forecast 2022-2027 ($ million)
- Exhibit 96: Data Table on Hong Kong - Market size and forecast 2022-2027 ($ million)
- Exhibit 97: Chart on Hong Kong - Year-over-year growth 2022-2027 (%)
- Exhibit 98: Data Table on Hong Kong - Year-over-year growth 2022-2027 (%)
- 9.11 Australia - Market size and forecast 2022-2027
- Exhibit 99: Chart on Australia - Market size and forecast 2022-2027 ($ million)
- Exhibit 100: Data Table on Australia - Market size and forecast 2022-2027 ($ million)
- Exhibit 101: Chart on Australia - Year-over-year growth 2022-2027 (%)
- Exhibit 102: Data Table on Australia - Year-over-year growth 2022-2027 (%)
- 9.12 UK - Market size and forecast 2022-2027
- Exhibit 103: Chart on UK - Market size and forecast 2022-2027 ($ million)
- Exhibit 104: Data Table on UK - Market size and forecast 2022-2027 ($ million)
- Exhibit 105: Chart on UK - Year-over-year growth 2022-2027 (%)
- Exhibit 106: Data Table on UK - Year-over-year growth 2022-2027 (%)
- 9.13 Market opportunity by geography
- Exhibit 107: Market opportunity by geography ($ million)
- Exhibit 108: Data Tables on Market opportunity by geography ($ million)
10 Drivers, Challenges, and Trends
- 10.1 Market drivers
- 10.2 Market challenges
- 10.3 Impact of drivers and challenges
- Exhibit 109: Impact of drivers and challenges in 2022 and 2027
- 10.4 Market trends
11 Vendor Landscape
- 11.1 Overview
- 11.2 Vendor landscape
- Exhibit 110: Overview on Criticality of inputs and Factors of differentiation
- 11.3 Landscape disruption
- Exhibit 111: Overview on factors of disruption
- 11.4 Industry risks
- Exhibit 112: Impact of key risks on business
12 Vendor Analysis
- 12.1 Vendors covered
- Exhibit 113: Vendors covered
- 12.2 Market positioning of vendors
- Exhibit 114: Matrix on vendor position and classification
- 12.3 Agri Beef Co.
- Exhibit 115: Agri Beef Co. - Overview
- Exhibit 116: Agri Beef Co. - Product / Service
- Exhibit 117: Agri Beef Co. - Key offerings
- 12.4 Australian Agricultural Co Ltd
- Exhibit 118: Australian Agricultural Co Ltd - Overview
- Exhibit 119: Australian Agricultural Co Ltd - Product / Service
- Exhibit 120: Australian Agricultural Co Ltd - Key offerings
- 12.5 Black Hawk Farms
- Exhibit 121: Black Hawk Farms - Overview
- Exhibit 122: Black Hawk Farms - Product / Service
- Exhibit 123: Black Hawk Farms - Key offerings
- 12.6 Blackmore Wagyu
- Exhibit 124: Blackmore Wagyu - Overview
- Exhibit 125: Blackmore Wagyu - Product / Service
- Exhibit 126: Blackmore Wagyu - Key offerings
- 12.7 Chicago Steak Co.
- Exhibit 127: Chicago Steak Co. - Overview
- Exhibit 128: Chicago Steak Co. - Product / Service
- Exhibit 129: Chicago Steak Co. - Key offerings
- 12.8 DEBRAGGA Inc.
- Exhibit 130: DEBRAGGA Inc. - Overview
- Exhibit 131: DEBRAGGA Inc. - Product / Service
- Exhibit 132: DEBRAGGA Inc. - Key offerings
- 12.9 Dolan Foods Inc.
- Exhibit 133: Dolan Foods Inc. - Overview
- Exhibit 134: Dolan Foods Inc. - Product / Service
- Exhibit 135: Dolan Foods Inc. - Key offerings
- 12.10 GRAND WESTERN
- Exhibit 136: GRAND WESTERN - Overview
- Exhibit 137: GRAND WESTERN - Product / Service
- Exhibit 138: GRAND WESTERN - Key offerings
- 12.11 Havel Wagyu GbR
- Exhibit 139: Havel Wagyu GbR - Overview
- Exhibit 140: Havel Wagyu GbR - Product / Service
- Exhibit 141: Havel Wagyu GbR - Key offerings
- 12.12 Holy Grail Steak Co.
- Exhibit 142: Holy Grail Steak Co. - Overview
- Exhibit 143: Holy Grail Steak Co. - Product / Service
- Exhibit 144: Holy Grail Steak Co. - Key offerings
- 12.13 JAPAN PREMIUM BEEF Inc.
- Exhibit 145: JAPAN PREMIUM BEEF Inc. - Overview
- Exhibit 146: JAPAN PREMIUM BEEF Inc. - Product / Service
- Exhibit 147: JAPAN PREMIUM BEEF Inc. - Key offerings
- 12.14 JBS SA
- Exhibit 148: JBS SA - Overview
- Exhibit 149: JBS SA - Business segments
- Exhibit 150: JBS SA - Key offerings
- Exhibit 151: JBS SA - Segment focus
- 12.15 Lone Mountain Wagyu LLC
- Exhibit 152: Lone Mountain Wagyu LLC - Overview
- Exhibit 153: Lone Mountain Wagyu LLC - Product / Service
- Exhibit 154: Lone Mountain Wagyu LLC - Key offerings
- 12.16 Starzen Co. Ltd.
- Exhibit 155: Starzen Co. Ltd. - Overview
- Exhibit 156: Starzen Co. Ltd. - Business segments
- Exhibit 157: Starzen Co. Ltd. - Key offerings
- Exhibit 158: Starzen Co. Ltd. - Segment focus
- 12.17 Stockyard Pty Ltd
- Exhibit 159: Stockyard Pty Ltd - Overview
- Exhibit 160: Stockyard Pty Ltd - Product / Service
- Exhibit 161: Stockyard Pty Ltd - Key offerings
13 Appendix
- 13.1 Scope of the report
- 13.2 Inclusions and exclusions checklist
- Exhibit 162: Inclusions checklist
- Exhibit 163: Exclusions checklist
- 13.3 Currency conversion rates for US$
- Exhibit 164: Currency conversion rates for US$
- 13.4 Research methodology
- Exhibit 165: Research methodology
- Exhibit 166: Validation techniques employed for market sizing
- Exhibit 167: Information sources
- 13.5 List of abbreviations
- Exhibit 168: List of abbreviations
Research Framework
Technavio presents a detailed picture of the market by way of study, synthesis, and summation of data from multiple sources. The analysts have presented the various facets of the market with a particular focus on identifying the key industry influencers. The data thus presented is comprehensive, reliable, and the result of extensive research, both primary and secondary.
INFORMATION SOURCES
Primary sources
- Manufacturers and suppliers
- Channel partners
- Industry experts
- Strategic decision makers
Secondary sources
- Industry journals and periodicals
- Government data
- Financial reports of key industry players
- Historical data
- Press releases
DATA ANALYSIS
Data Synthesis
- Collation of data
- Estimation of key figures
- Analysis of derived insights
Data Validation
- Triangulation with data models
- Reference against proprietary databases
- Corroboration with industry experts
REPORT WRITING
Qualitative
- Market drivers
- Market challenges
- Market trends
- Five forces analysis
Quantitative
- Market size and forecast
- Market segmentation
- Geographical insights
- Competitive landscape
PURCHASE FULL REPORT OF
wagyu beef market
Key Questions Answered
- What are the key global market and the regional market share?
- What are the revenue-generating key market segments?
- What are the key factors driving and challenging this market’s growth?
- Who are the key market vendors and their growth strategies?
- What are the latest trends influencing the growth of this market?
- What are the variables influencing the market growth in the primary regions?
- What are the factors influencing the growth of the parent market?
Why should you prefer Technavio's market insights report?
- Off-the-shelf research reports
- Reports can be tailored to meet the customer's needs
- Trusted by more than 100 fortune 500 organizations
- Information about the market's key drivers, trends, and challenges
- Parent market analysis
- Every week, 50,000 people visit our subscription platform
- Detailed vendors report with competitive landscape
- Covid-19 impact and recovery analysis
- Data on revenue-generating market segments
- Details on the market shares of various regions
- Five-force market analysis