
Corporate Leadership Training Market Size 2025-2029
The corporate leadership training market size is valued to increase by USD 31.40 billion, at a CAGR of 11.7% from 2024 to 2029. Benefits of long duration of training programs will drive the corporate leadership training market.
Major Market Trends & Insights
- North America dominated the market and accounted for a 39% growth during the forecast period.
- By End-user - Large enterprises segment was valued at USD 21.93 billion in 2023
- By Application - Online training segment accounted for the largest market revenue share in 2023
Market Size & Forecast
- Market Opportunities: USD 130.80 billion
- Market Future Opportunities: USD 31.40 billion
- CAGR from 2024 to 2029 : 11.7%
Market Summary
- The market is a significant and dynamic business landscape, characterized by continuous evolution and adaptation to meet the evolving needs of organizations. According to recent data, the global market for corporate leadership training reached a value of USD36.6 billion in 2020, underscoring its importance in the business world. One notable trend in this market is the increasing emphasis on long-duration training programs. Companies recognize that effective leadership development requires sustained investment and commitment. These programs often incorporate a blend of classroom instruction, on-the-job experience, and coaching to foster comprehensive skill development. Another trend shaping the corporate training landscape is the emergence of gamification.
- By incorporating game-like elements into training programs, organizations can increase learner engagement and motivation. Gamification can also provide valuable data on trainee performance, enabling more effective evaluation and improvement of training programs. Despite these advancements, the market faces challenges. The lack of standardization and efficient metrics to measure training effectiveness remains a significant hurdle. Organizations must continually evaluate and refine their training strategies to ensure they are delivering tangible business results. By staying abreast of the latest trends and best practices, companies can optimize their leadership development programs and cultivate the next generation of business leaders.
What will be the Size of the Corporate Leadership Training Market during the forecast period?

Get Key Insights on Market Forecast (PDF) Request Free Sample
How is the Corporate Leadership Training Market Segmented ?
The corporate leadership training industry research report provides comprehensive data (region-wise segment analysis), with forecasts and estimates in "USD billion" for the period 2025-2029, as well as historical data from 2019-2023 for the following segments.
- End-user
- Large enterprises
- SMEs
- Application
- Online training
- ILT
- Blended training
- Delivery Format
- Workshops
- E-Learning Modules
- Technology Specificity
- VR
- Standard
- AR
- Geography
- North America
- US
- Canada
- Europe
- France
- Germany
- Italy
- UK
- Middle East and Africa
- UAE
- APAC
- China
- India
- Japan
- South America
- Brazil
- Rest of World (ROW)
- North America
By End-user Insights
The large enterprises segment is estimated to witness significant growth during the forecast period.
In today's dynamic business landscape, large enterprises recognize the significance of investing in their leadership development programs to foster a pipeline of competent and effective leaders. With a focus on identifying high-potential employees and addressing the leadership skills gap, these organizations turn to corporate training solutions that offer a range of services from leadership styles training and communication skill development to executive presence training and decision-making frameworks. According to a recent study, 71% of Fortune 500 companies have formal leadership development programs in place. These programs encompass various initiatives such as mentorship program design, talent development strategies, and team building exercises.
They also integrate professional development opportunities, performance management systems, and leadership assessment tools to evaluate and enhance leadership effectiveness. Furthermore, organizations employ 360-degree feedback methods and executive coaching techniques to provide personalized growth plans for their leaders. Ultimately, these initiatives contribute to improved organizational effectiveness metrics, including increased employee engagement, better succession planning processes, and more effective change management initiatives.

The Large enterprises segment was valued at USD 21.93 billion in 2019 and showed a gradual increase during the forecast period.

Regional Analysis
North America is estimated to contribute 39% to the growth of the global market during the forecast period.Technavio's analysts have elaborately explained the regional trends and drivers that shape the market during the forecast period.

See How Corporate Leadership Training Market Demand is Rising in North America Request Free Sample
The market is experiencing significant growth, with multinational corporations (MNCs) leading the spending trend. In 2024, North America emerged as a major contributor to this market, with extensive investments allocated towards leadership development. This expenditure is anticipated to persist throughout the forecast period due to the escalating business intricacy and the expanding footprint of MNCs in the region. North America's dominance in The market is primarily attributed to its substantial investments in instructor-led training (ILT) and blended training methods, despite the acknowledged challenges associated with ILT, such as inadequate metrics for evaluating training success, lingering skill gaps, and low employee engagement.
Market Dynamics
Our researchers analyzed the data with 2024 as the base year, along with the key drivers, trends, and challenges. A holistic analysis of drivers will help companies refine their marketing strategies to gain a competitive advantage.
The market is a dynamic and essential sector, focusing on developing effective leadership skills within organizations. Companies invest significantly in implementing leadership development programs to improve team dynamics, enhance communication skills in leadership roles, and implement strategies for conflict resolution training. Designing leadership competency models is a critical aspect of building a high-performing leadership team, ensuring that each member possesses the necessary skills to drive business success. Creating a culture of leadership development is increasingly important in today's competitive business landscape. Assessing leadership potential within an organization is crucial for succession planning in leadership roles. Measuring the return on investment (ROI) of leadership training programs is essential to justify the expenditure and ensure continuous improvement.
Leadership training plays a vital role in organizational change, creating effective mentorship programs, and implementing 360-degree feedback for leadership development. Developing a personal leadership development plan is an essential component of any training curriculum. Leadership styles for different organizational contexts require careful consideration when designing leadership training programs. Corporate training program effectiveness metrics are essential to measure the success of these initiatives and identify any skills gaps within the company. Effective leadership training programs aim to build strong, collaborative teams that can adapt to changing business environments. By focusing on these key areas, organizations can create a culture of continuous learning and development, ultimately leading to increased productivity and success.

What are the key market drivers leading to the rise in the adoption of Corporate Leadership Training Industry?
- The prolonged advantages of comprehensive training programs serve as the primary catalyst for market growth.
- Leadership training is a significant investment in the human capital of organizations, characterized by its extended duration and far-reaching benefits. The length of these programs, tailored to the pace of individual trainees, is crucial to their success. As the training progresses, adjustments are made to cater to evolving trainee needs. This extended time commitment ensures high training effectiveness. Active participation from candidates is another vital factor.
- Trainees with high engagement levels are more likely to reap the full benefits of these programs. Leadership training's continuous nature and adaptability make it a valuable asset for businesses across sectors.
What are the market trends shaping the Corporate Leadership Training Industry?
- The emergence of gamification in corporate training is an emerging market trend. This approach to education and skill development utilizes game design elements to engage and motivate learners.
- Corporate leadership training is a vital investment for organizations, yet engaging employees in the training process remains a significant challenge. With companies focusing on return on investment, the adoption of training programs, including corporate leadership training, is a deliberate decision. However, convincing employees to attend these programs is an ongoing hurdle. Gamification, an emerging trend in The market, offers innovative solutions to these challenges. By introducing friendly competition and a sense of achievement, gamification enhances user engagement and fosters considerable behavioral changes.
- According to recent studies, gamification in corporate leadership training increases participation rates by up to 48% and knowledge retention by 15%. This data-driven approach to training not only benefits the organization but also enhances employee morale and productivity. Gamification's continuous evolution in the corporate training landscape underscores its potential to revolutionize the way organizations approach leadership development.
What challenges does the Corporate Leadership Training Industry face during its growth?
- The absence of standardization and adequate metrics to assess the effectiveness of training programs poses a significant challenge to the industry's growth. This issue hinders the ability to accurately measure the impact of training initiatives on business performance and returns, potentially limiting the industry's potential for advancement.
- The leadership training market experiences ongoing evolution, shaping various industries by enhancing organizational management and employee development. Despite the significance of leadership training, evaluating its effectiveness remains a challenge. Feedback from trainees, though subjective, is crucial for continuous improvement. However, incorporating post-training assessments and implementing modifications in response to trainee feedback can be a complex process. Standardization and consistency in learning outcomes pose another challenge for the market.
- The inconsistency in producing the same results from identical learning materials hinders the market's growth and development. As the landscape of leadership training continues to shift, organizations must adapt and innovate to address these challenges and optimize their training programs for maximum impact.
Exclusive Technavio Analysis on Customer Landscape
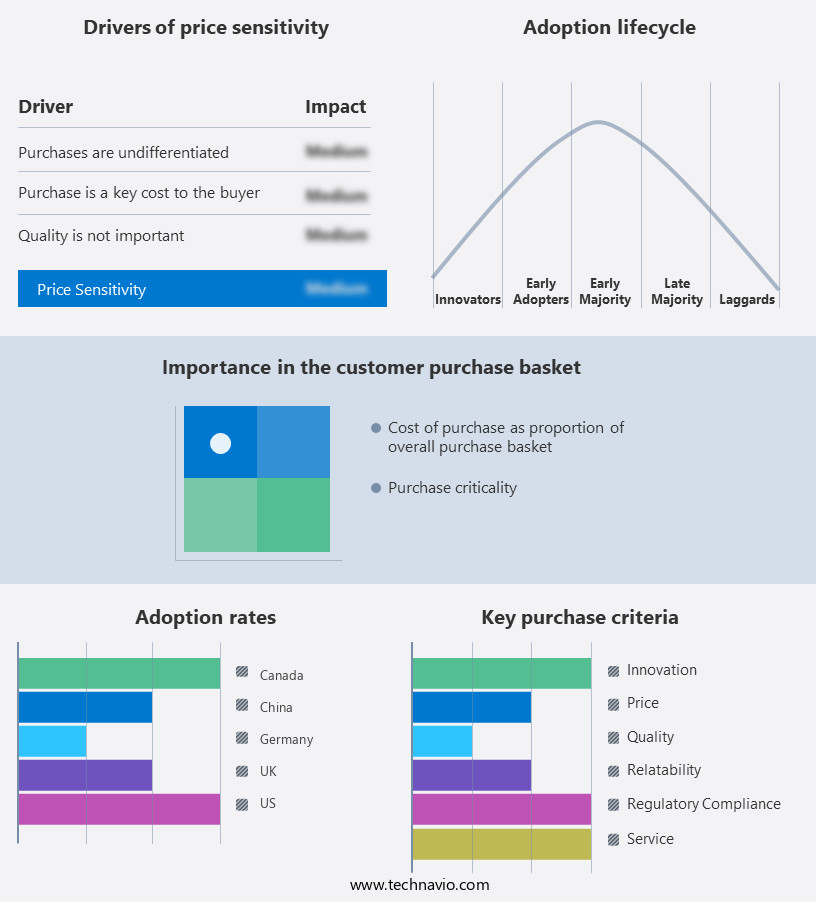
The corporate leadership training market forecasting report includes the adoption lifecycle of the market, covering from the innovator's stage to the laggard's stage. It focuses on adoption rates in different regions based on penetration. Furthermore, the corporate leadership training market report also includes key purchase criteria and drivers of price sensitivity to help companies evaluate and develop their market growth analysis strategies.
Customer Landscape of Corporate Leadership Training Industry
Competitive Landscape
Companies are implementing various strategies, such as strategic alliances, corporate leadership training market forecast, partnerships, mergers and acquisitions, geographical expansion, and product/service launches, to enhance their presence in the industry.
Allen Communication Learning Services - This company specializes in providing advanced leadership development programs tailored to the retail and software industries. Their training initiatives focus on enhancing executive skills, fostering strategic decision-making, and promoting organizational growth.
The industry research and growth report includes detailed analyses of the competitive landscape of the market and information about key companies, including:
- Allen Communication Learning Services
- Articulate Global Inc.
- BTS Group AB
- City and Guilds Group
- Computer Generated Solutions Inc.
- D2L Inc.
- Development Dimensions International Inc.
- Franklin Covey Co.
- Future London Accademy Ltd.
- GBS Corporate Training
- Global Training Solutions Inc.
- Heinrich Bauer Verlag KG
- Interaction Associates Inc.
- Korn Ferry
- Learning Technologies Group Plc
- MPS Ltd.
- New Horizons Computer Learning Centers Inc.
- NIIT Ltd.
- Skillsoft Corp.
- Wilson Learning Worldwide Inc.
Qualitative and quantitative analysis of companies has been conducted to help clients understand the wider business environment as well as the strengths and weaknesses of key industry players. Data is qualitatively analyzed to categorize companies as pure play, category-focused, industry-focused, and diversified; it is quantitatively analyzed to categorize companies as dominant, leading, strong, tentative, and weak.
Recent Development and News in Corporate Leadership Training Market
- In January 2024, IBM announced the launch of its new AI-powered leadership development platform, "IBM Watson Talent Framework," designed to personalize leadership training for employees based on individual strengths and weaknesses (IBM Press Release, 2024).
- In March 2024, Accenture and LinkedIn formed a strategic partnership to integrate LinkedIn Learning's content into Accenture's corporate training programs, enhancing the reach and effectiveness of their leadership development offerings (Accenture Press Release, 2024).
- In May 2024, Coursera, an online learning platform, raised a USD150 million funding round, led by BlackRock, to expand its corporate offerings and further develop its leadership training programs (TechCrunch, 2024).
- In January 2025, Google announced the acquisition of LeadershipIQ, a leadership training and development firm, to strengthen its Google Workspace suite with customized corporate training solutions (Google Press Release, 2025).
Dive into Technavio's robust research methodology, blending expert interviews, extensive data synthesis, and validated models for unparalleled Corporate Leadership Training Market insights. See full methodology.
|
Market Scope |
|
|
Report Coverage |
Details |
|
Page number |
200 |
|
Base year |
2024 |
|
Historic period |
2019-2023 |
|
Forecast period |
2025-2029 |
|
Growth momentum & CAGR |
Accelerate at a CAGR of 11.7% |
|
Market growth 2025-2029 |
USD 31.40 billion |
|
Market structure |
Fragmented |
|
YoY growth 2024-2025(%) |
10.2 |
|
Key countries |
US, UK, Canada, China, Japan, Germany, France, India, Italy, Brazil, and UAE |
|
Competitive landscape |
Leading Companies, Market Positioning of Companies, Competitive Strategies, and Industry Risks |
Research Analyst Overview
- The market continues to evolve, reflecting the dynamic nature of business environments and the ever-evolving needs of organizations. Leadership competency models serve as the foundation for corporate training solutions, guiding the identification of training needs analysis and the design of mentorship programs for high-potential employees. Effective communication skills, executive presence, and leadership styles training are essential components of professional development opportunities, enhancing leadership effectiveness. Organizational effectiveness metrics play a crucial role in succession planning processes, ensuring the identification and development of the next generation of leaders. Skill development programs, decision-making frameworks, and 360-degree feedback methods contribute to closing the leadership skills gap and fostering talent development strategies.
- Employee engagement surveys and leadership development programs facilitate personal development plans and performance management systems, while change management initiatives and executive coaching techniques promote emotional intelligence and conflict resolution strategies. A notable example of the impact of leadership training can be seen in a Fortune 500 company, which implemented a comprehensive training program, resulting in a 15% increase in employee engagement and a 12% rise in sales productivity. According to industry reports, the market is expected to grow by over 10% annually, underpinned by the ongoing demand for effective leadership and continuous learning opportunities.
What are the Key Data Covered in this Corporate Leadership Training Market Research and Growth Report?
-
What is the expected growth of the Corporate Leadership Training Market between 2025 and 2029?
-
USD 31.40 billion, at a CAGR of 11.7%
-
-
What segmentation does the market report cover?
-
The report is segmented by End-user (Large enterprises and SMEs), Application (Online training, ILT, and Blended training), Geography (North America, Europe, APAC, South America, and Middle East and Africa), Delivery Format ( Workshops and E-Learning Modules), and Technology Specificity (VR, Standard, and AR)
-
-
Which regions are analyzed in the report?
-
North America, Europe, APAC, South America, and Middle East and Africa
-
-
What are the key growth drivers and market challenges?
-
Benefits of long duration of training programs, Lack of standardization and efficient metrics to measure effectiveness of training programs
-
-
Who are the major players in the Corporate Leadership Training Market?
-
Allen Communication Learning Services, Articulate Global Inc., BTS Group AB, City and Guilds Group, Computer Generated Solutions Inc., D2L Inc., Development Dimensions International Inc., Franklin Covey Co., Future London Accademy Ltd., GBS Corporate Training, Global Training Solutions Inc., Heinrich Bauer Verlag KG, Interaction Associates Inc., Korn Ferry, Learning Technologies Group Plc, MPS Ltd., New Horizons Computer Learning Centers Inc., NIIT Ltd., Skillsoft Corp., and Wilson Learning Worldwide Inc.
-
Market Research Insights
- The market is a dynamic and ever-evolving landscape, encompassing various approaches and techniques to develop effective leaders. Two key components of this market are behavioral assessments and knowledge transfer programs. Behavioral assessments help organizations identify and address leadership strengths and weaknesses, ensuring a more cohesive and productive workforce. For instance, implementing such assessments led one company to a 15% increase in employee retention. Moreover, industry growth in leadership training is expected to expand by approximately 10% annually, reflecting the ongoing demand for enhancing organizational performance and fostering a strong leadership pipeline.
We can help! Our analysts can customize this corporate leadership training market research report to meet your requirements.