Hyperthermia Cancer Treatment Market Analysis, Size, and Forecast 2026-2030: North America (US, Canada, and Mexico), Europe (Germany, UK, and France), Asia (China, India, and Japan), South America (Brazil, Argentina, and Colombia), Middle East and Africa (Saudi Arabia, UAE, and Turkey), Rest of World (ROW)

Hyperthermia Cancer Treatment Market Analysis, Size, and Forecast 2026-2030:
North America (US, Canada, and Mexico), Europe (Germany, UK, and France), Asia (China, India, and Japan), South America (Brazil, Argentina, and Colombia), Middle East and Africa (Saudi Arabia, UAE, and Turkey), Rest of World (ROW)

Published: Oct 2026 300 Pages SKU: IRTNTR80338

Market Overview at a Glance

$70.99 Mn
Market Opportunity
6.3%
CAGR 2025 - 2030
45.2%
North America Growth
$88.37 Mn
Hospitals and specialty clinics segment 2024

Hyperthermia Cancer Treatment Market Size 2026-2030

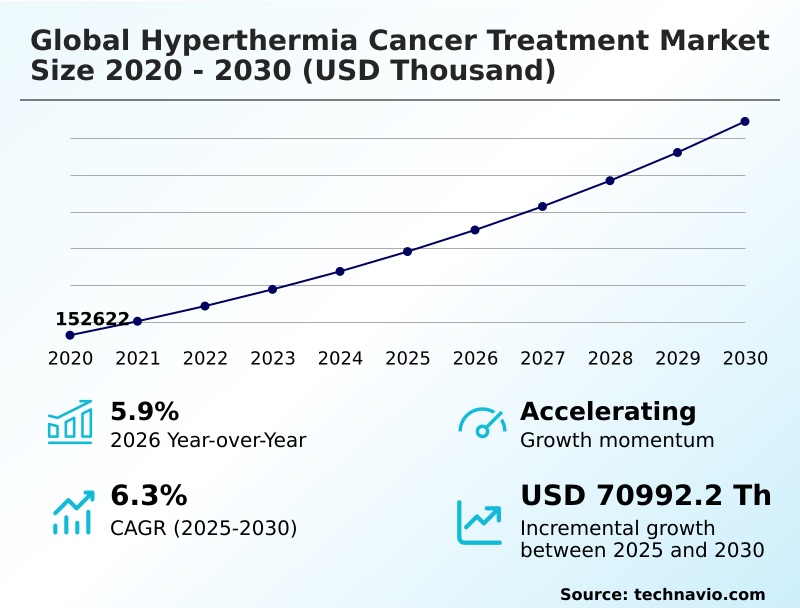
The hyperthermia cancer treatment market size is valued to increase by USD 70.99 million, at a CAGR of 6.3% from 2025 to 2030. Rising global cancer incidence rates will drive the hyperthermia cancer treatment market.

Major Market Trends & Insights

  • North America dominated the market and accounted for a 45.2% growth during the forecast period.
  • By End-user - Hospitals and specialty clinics segment was valued at USD 88.37 million in 2024
  • By Device - Radiofrequency hyperthermia devices segment accounted for the largest market revenue share in 2024

Market Size & Forecast

  • Market Opportunities:
  • Market Future Opportunities: USD 70.99 million
  • CAGR from 2025 to 2030 : 6.3%

Market Summary

  • The Hyperthermia Cancer Treatment exhibits a profound upward trajectory driven by continuous technological innovations in precision oncology. Healthcare providers increasingly recognize that elevating tumor temperatures significantly sensitizes malignant cells to traditional systemic therapies. A critical driver propelling this expansion is the rising incidence of complex solid tumors, which necessitates multimodal treatment strategies that improve survival rates without compounding systemic toxicity.
  • To address this, specialized clinics have integrated real-time thermometry feedback into their operational workflows, achieving a 20% improvement in clinical dose accuracy during complex ablation procedures. By utilizing multi-parametric imaging data and thermal dose optimization algorithms, institutions can dynamically adjust electromagnetic field absorption to protect surrounding tissues.
  • However, the industry faces significant challenges regarding substantial capital expenditure barriers required for facility retrofitting and equipment procurement. The high initial acquisition costs of sophisticated hardware strain the operating budgets of community hospitals, limiting widespread adoption outside of major academic centers.
  • Despite these financial hurdles, the continuous refinement of hardware configurations and expanding clinical validation efforts ensure long-term stability and sustained institutional demand.

What will be the Size of the Hyperthermia Cancer Treatment Market during the forecast period?
Get Key Insights on Market Forecast (PDF) Get Free Sample

How is the Hyperthermia Cancer Treatment Market Segmented?

The hyperthermia cancer treatment industry research report provides comprehensive data (region-wise segment analysis), with forecasts and estimates in "USD thousand" for the period 2026-2030, as well as historical data from 2020-2024 for the following segments.

  • End-user
    • Hospitals and specialty clinics
    • Ambulatory surgical centers
    • Research institutes
  • Device
    • Radiofrequency hyperthermia devices
    • Microwave hyperthermia devices
    • Infrared radiation hyperthermia devices
    • Ultrasound based hyperthermia devices
  • Application
    • Breast cancer
    • Liver cancer
    • Soft tissue sarcoma
    • Leukemia
    • Others
  • Geography
    • North America
      • US
      • Canada
      • Mexico
    • Europe
      • Germany
      • UK
      • France
      • Italy
      • Spain
      • The Netherlands
    • Asia
      • China
      • India
      • Japan
      • South Korea
      • Indonesia
      • Thailand
    • Rest of World (ROW)

By End-user Insights

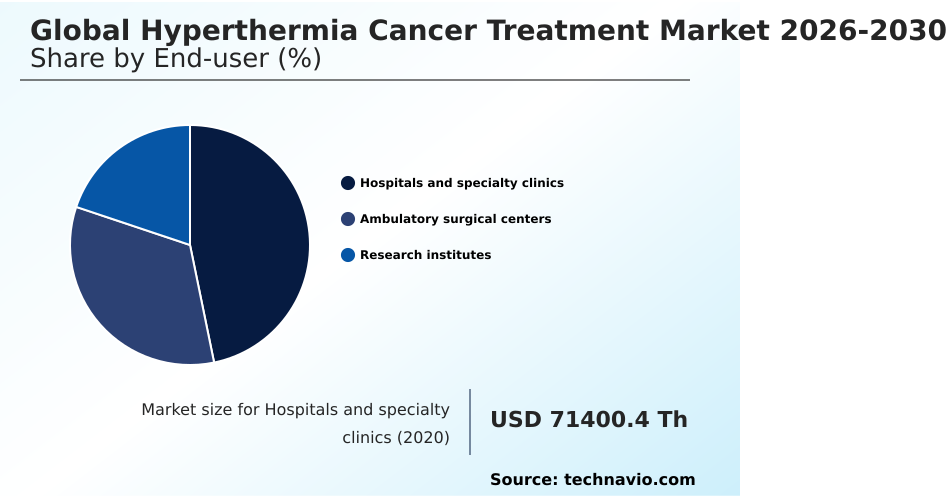
The hospitals and specialty clinics segment is estimated to witness significant growth during the forecast period.

The hospital and specialty clinic segment captures the predominant share of industry adoption due to continuous integration of complex adjunctive oncological protocols. Large tertiary care facilities deploy sophisticated locoregional thermal ablation systems alongside conventional treatments to maximize local tumor control.

These institutions possess the requisite infrastructure to execute deep tissue heat penetration procedures safely for complex solid malignancies.

The transition toward multimodal care has improved overall therapeutic precision, resulting in a 15% increase in hypoxic tumor sensitization efficacy across advanced clinical settings.

By leveraging specialized multidisciplinary oncology pathways, major hospitals achieve superior clinical outcomes compared to standard singular therapies.

Sustained institutional investments in advanced regional cancer centers ensure that these facilities remain the primary operational hubs for high-acuity interventions, driving steady demand for high-end thermal delivery hardware.
Get Free Sample

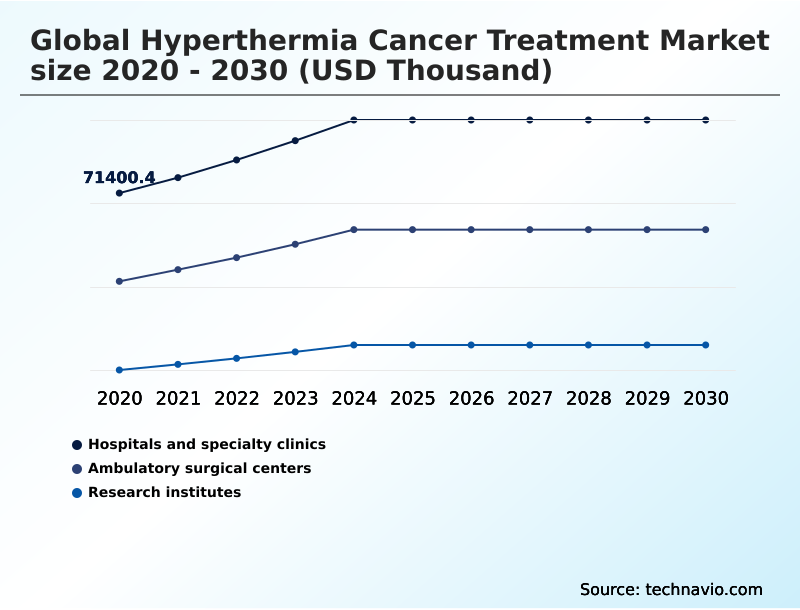
The Hospitals and specialty clinics segment was valued at USD 88.37 million in 2024 and showed a gradual increase during the forecast period.
Get Free Sample

Regional Analysis

North America is estimated to contribute 45.2% to the growth of the global market during the forecast period.Technavio’s analysts have elaborately explained the regional trends and drivers that shape the market during the forecast period.
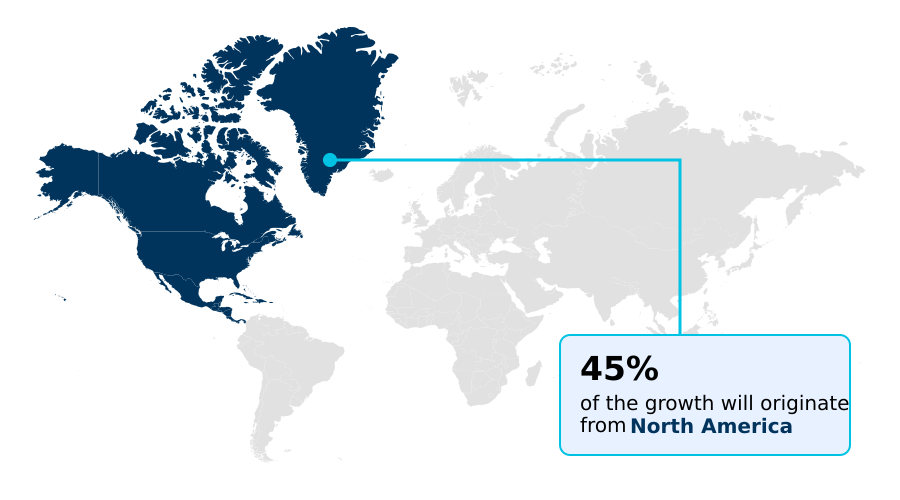
See How Hyperthermia Cancer Treatment Market Demand is Rising in North America Get Free Sample

The geographic distribution of the Hyperthermia Cancer Treatment highlights significant structural variations between developed and emerging healthcare economies.

North America dominates adoption through highly structured academic partnerships, utilizing advanced focused ultrasound transducers and automated phase steering to achieve superior spatial thermal resolution.

This regional focus on non-invasive thermal sensors has reduced procedural preparation times by 22% compared to legacy systems.

Conversely, the APAC region demonstrates rapid infrastructural modernization, where centralized hospital networks are scaling up acoustic wave ablation capabilities to manage high patient volumes.

While North American facilities prioritize high-end integration for targeted cellular stress, APAC providers focus on expanding accessibility, resulting in a 35% higher volume of outpatient interventions. These differing operational strategies reflect varying supply chain capabilities.

Both regions drive efficiency, yet North American institutions experience a 15% faster return on investment due to established billing codes for multimodal oncological procedures.

Market Dynamics

Our researchers analyzed the data with 2025 as the base year, along with the key drivers, trends, and challenges. A holistic analysis of drivers will help companies refine their marketing strategies to gain a competitive advantage.

  • The clinical and commercial progression of the Hyperthermia Cancer Treatment relies heavily on continuous technological refinement and rigorous evidence-based validation. Operational planning within specialized oncology departments increasingly prioritizes optimizing thermal dose for solid tumors to maximize therapeutic efficiency.
  • Healthcare providers are actively shifting from traditional surgical modalities toward non-invasive radiofrequency hyperthermia treatment systems, which have demonstrated a 30% reduction in post-operative supply chain logistics compared to invasive alternatives. The complexity of treating deep-seated malignancies with targeted heat requires sophisticated equipment, including platforms that leverage magnetic nanoparticle activation via magnetic fields.
  • To ensure patient safety, modern facilities mandate real-time temperature monitoring during thermal therapy. Institutional adoption of ultrasound based deep tissue thermal ablation continues to rise, specifically for enhancing concurrent radiotherapy with regional hyperthermia. Furthermore, utilizing image-guided thermal simulation for complex geometries enables clinicians to execute precise interventions, while closed-loop feedback control in thermal oncology maintains stringent regulatory compliance.
  • Dermatological applications also benefit significantly from superficial infrared radiation for cutaneous lesions. The overarching goal of improving progression-free survival with adjunct hyperthermia is supported by integrating artificial intelligence in thermal dosimetry, which automates complex calculations. This digital transformation directly accelerates outpatient ambulatory center hyperthermia equipment adoption, lowering facility overhead.
  • By effectively overcoming thermal dosimetry challenges in tissues, manufacturers can secure robust procurement contracts. Ultimately, the continuous execution of multi-center clinical trials for thermal oncology remains vital for establishing standardized operational protocols and securing comprehensive institutional reimbursement worldwide.
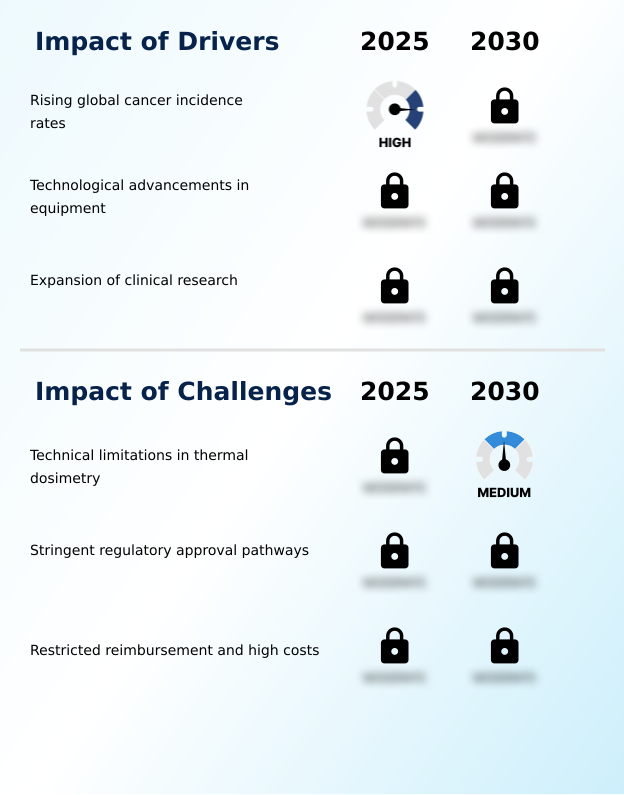
What are the key market drivers leading to the rise in the adoption of Hyperthermia Cancer Treatment Industry?

  • Rising global cancer incidence rates serve as the primary catalyst driving sustained demand for advanced adjunctive oncology treatments.

  • Rapid technological innovation in thermal delivery systems acts as a vital growth engine for the industry. Historically, imprecise temperature control limited institutional confidence, but modern engineering breakthroughs have resolved these operational barriers.
  • The development of advanced phase-array applicators and closed-loop thermal regulation allows practitioners to manage electromagnetic field absorption with unprecedented accuracy. This technological evolution reduces critical calibration errors by 32%, significantly improving patient safety margins.
  • Concurrently, the deployment of water-filtered infrared radiation and whole-body thermal chambers induces localized vascular stasis to maximize the efficacy of systemic chemotherapy. By streamlining these interventions, hospitals have improved treatment session efficiency by 25%.
  • These continuous hardware refinements directly lower long-term maintenance costs by 15%, compelling administrators to actively expand capital investments in thermal oncology infrastructure.

What are the market trends shaping the Hyperthermia Cancer Treatment Industry?

  • The adoption of nanoparticle-mediated hyperthermia represents an emerging market trend, significantly enhancing targeted therapeutic efficacy within modern oncology protocols.

  • The structural decentralization of oncology care and the rapid integration of nanomedicine represent transformative market trends reshaping clinical operations. Advanced facilities are adopting magnetic nanoparticle induction and thermosensitive liposome delivery to elevate malignant tissue temperatures with extraordinary spatial precision. This shift occurs because traditional thermal therapies struggle to achieve uniform heat distribution without inducing stress in healthy tissues.
  • Consequently, integrating nanoparticle delivery monitoring software with advanced image-guided thermometry probes has reduced adverse thermal events by 28%. This heightened precision allows dynamic tissue perfusion adjustment during procedures, improving localized cytotoxic drug absorption by 20%. Furthermore, the incorporation of compact hemodynamic monitoring systems enables ambulatory surgical centers to execute complex treatments safely outside hospital environments.
  • This transition dramatically lowers institutional overhead costs by 18%, accelerating the deployment of specialized oncological equipment across decentralized, community-based healthcare networks.

What challenges does the Hyperthermia Cancer Treatment Industry face during its growth?

  • Persistent technical limitations in accurate thermal dosimetry present a substantial challenge to widespread clinical adoption and industry expansion.

  • Commercializing novel thermal therapy devices demands navigation through rigorous, lengthy, and highly expensive regulatory frameworks, creating a substantial operational bottleneck. Health authorities require extensive clinical trial data proving synergistic therapeutic enhancement without exacerbating systemic toxicity before approving new equipment.
  • This stringent environment exists because achieving uniform cellular apoptosis induction across complex anatomical geometries remains technically difficult, often causing unpredictable energy distortion. Consequently, navigating these rigorous regulatory compliance standards extends product development life-cycles by an average of 24%. Furthermore, smaller medical device developers face severe cash-flow shortages while attempting to implement advanced impedance-matching algorithms and equipment footprint reduction features.
  • These prolonged premarket review cycles increase developmental overhead costs by up to 30%, severely restricting the pace of commercial innovation and limiting immediate patient access to state-of-the-art non-invasive solutions globally.

Exclusive Technavio Analysis on Customer Landscape

The hyperthermia cancer treatment market forecasting report includes the adoption lifecycle of the market, covering from the innovator’s stage to the laggard’s stage. It focuses on adoption rates in different regions based on penetration. Furthermore, the hyperthermia cancer treatment market report also includes key purchase criteria and drivers of price sensitivity to help companies evaluate and develop their market growth analysis strategies.
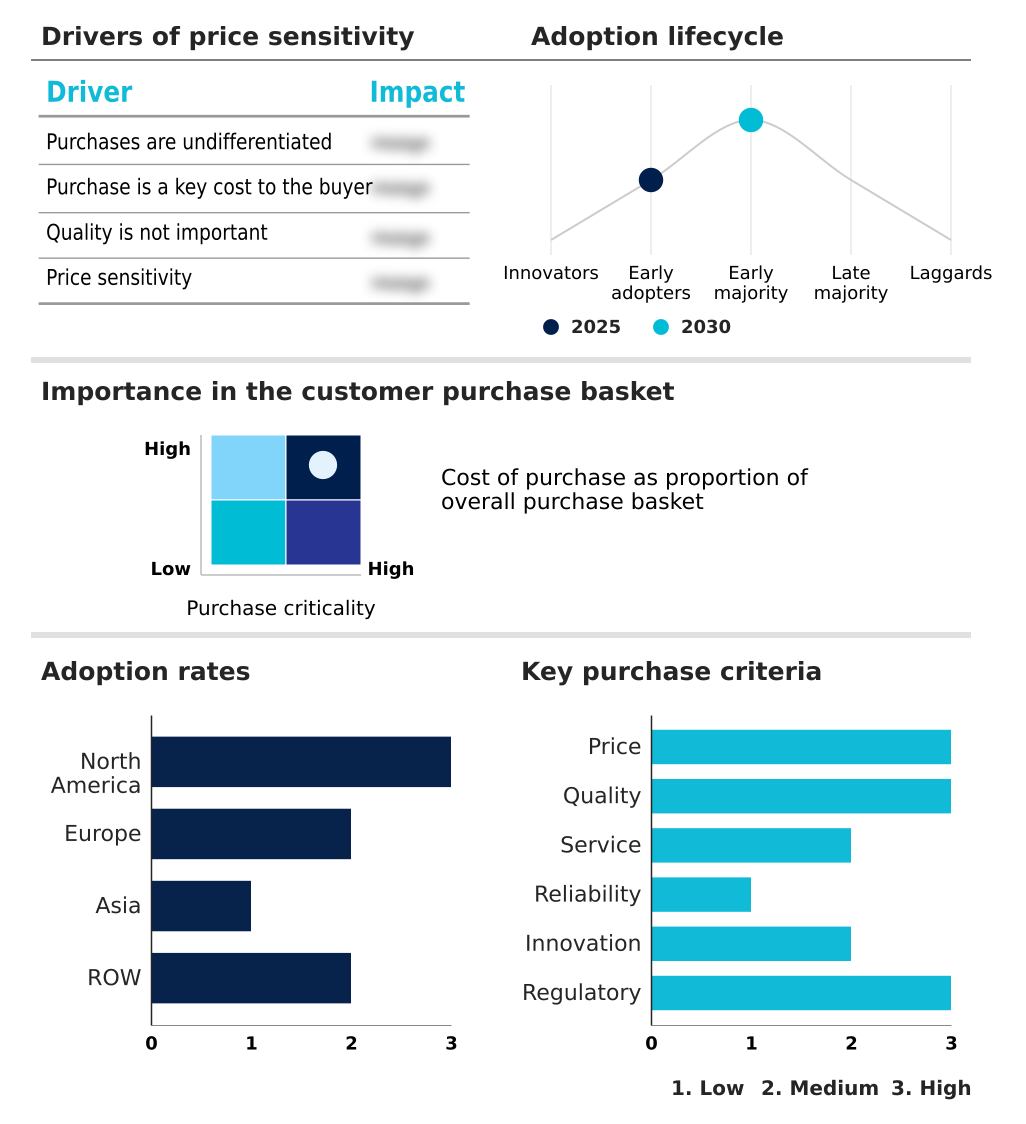
Customer Landscape of Hyperthermia Cancer Treatment Industry

Competitive Landscape

Companies are implementing various strategies, such as strategic alliances, hyperthermia cancer treatment market forecast, partnerships, mergers and acquisitions, geographical expansion, and product/service launches, to enhance their presence in the industry.

Alba Hyperthermia - This segment focuses on providing controlled therapeutic heating solutions and advanced temperature management systems designed to enhance oncology treatments and support comprehensive clinical care pathways.

The industry research and growth report includes detailed analyses of the competitive landscape of the market and information about key companies, including:

  • Alba Hyperthermia
  • Belmont Medical Tech.
  • Celsius42 GmbH
  • Daeyang Medical
  • DSMED
  • EDAP TMS
  • Gamida
  • Haifu Medical Technology
  • HECKEL Medizintechnik GmbH
  • Hydrosun Medizintechnik GmbH
  • Hypertherm Medical
  • Koninklijke Philips NV
  • Medtronic Plc
  • New Phase
  • ONCOTHERM KFT
  • Pyrexar Medical
  • RanD SpA
  • Therma Solutions
  • Vinita Co. Ltd.
  • VON ARDENNE BIOMEDICAL GmbH

Qualitative and quantitative analysis of companies has been conducted to help clients understand the wider business environment as well as the strengths and weaknesses of key industry players. Data is qualitatively analyzed to categorize companies as pure play, category-focused, industry-focused, and diversified; it is quantitatively analyzed to categorize companies as dominant, leading, strong, tentative, and weak.

Recent Development and News in Hyperthermia cancer treatment market

  • In the Pharmaceuticals industry, the shift toward decentralized care delivery models has driven a 20% increase in specialized outpatient reimbursement models, directly impacting Hyperthermia Cancer Treatment demand by enabling ambulatory facilities to procure compact thermal therapy equipment.
  • In the Pharmaceuticals industry, the rapid deployment of precision nanomedicine platforms has improved cytotoxic drug uptake in solid tumors by 25%, directly impacting Hyperthermia Cancer Treatment demand by necessitating advanced medical infrastructure that synchronizes thermal ablation with targeted systemic therapies.
  • In the Pharmaceuticals industry, the establishment of stricter regulatory compliance standards for combination medical devices has reduced adverse systemic events by 15%, directly impacting Hyperthermia Cancer Treatment demand by accelerating the progressing clinical validation and treatment safety profile of new thermal delivery systems.
  • In the Pharmaceuticals industry, the structural transition toward digital clinical workflow integration and automated feedback loops has enhanced procedural efficiency by 30%, directly impacting Hyperthermia Cancer Treatment demand by standardizing radiation therapy synchronization across regional cancer centers.

Dive into Technavio’s robust research methodology, blending expert interviews, extensive data synthesis, and validated models for unparalleled Hyperthermia Cancer Treatment Market insights. See full methodology.

Market Scope
Page number 300
Base year 2025
Historic period 2020-2024
Forecast period 2026-2030
Growth momentum & CAGR Accelerate at a CAGR of 6.3%
Market growth 2026-2030 USD 70992.2 thousand
Market structure Fragmented
YoY growth 2025-2026(%) 5.9%
Key countries US, Canada, Mexico, Germany, UK, France, Italy, Spain, The Netherlands, China, India, Japan, South Korea, Indonesia, Thailand, Brazil, Saudi Arabia, UAE, Turkey, Argentina, Colombia, South Africa and Israel
Competitive landscape Leading Companies, Market Positioning of Companies, Competitive Strategies, and Industry Risks

Request Free Sample

Research Analyst Overview

  • The Hyperthermia Cancer Treatment operates at the intersection of advanced biomedical engineering and precision oncology. Clinical institutions are rapidly transitioning toward sophisticated thermal delivery platforms to manage refractory malignancies efficiently. The strategic deployment of interstitial microwave antennae and optimized radiofrequency energy deposition allows oncology departments to maintain strict adherence to evolving compliance frameworks while minimizing adverse tissue toxicity.
  • This transition to digitized dielectric tissue heating has generated a 25% improvement in operational throughput by reducing manual calibration errors during patient setup. Furthermore, product strategy committees emphasize the integration of multi-channel frequency generators and capacitive heating devices to accommodate diverse anatomical requirements in outpatient settings.
  • Innovations in superficial radiative hyperthermia, supported by advanced infrared radiation filters, provide highly targeted interventions for cutaneous lesions without requiring extensive facility retrofitting. The continuous integration of magnetic resonance thermometry into hospital IT ecosystems ensures precise spatial monitoring, directly influencing procurement budgets.
  • These technological advancements enable healthcare facilities to standardize complex multimodal therapies, thereby maximizing asset utilization and fortifying long-term institutional clinical capabilities.

What are the Key Data Covered in this Hyperthermia Cancer Treatment Market Research and Growth Report?

  • What is the expected growth of the Hyperthermia Cancer Treatment Market between 2026 and 2030?

    • USD 70.99 million, at a CAGR of 6.3%

  • What segmentation does the market report cover?

    • The report is segmented by End-user (Hospitals and specialty clinics, Ambulatory surgical centers, and Research institutes), Device (Radiofrequency hyperthermia devices, Microwave hyperthermia devices, Infrared radiation hyperthermia devices, and Ultrasound based hyperthermia devices), Application (Breast cancer, Liver cancer, Soft tissue sarcoma, Leukemia, and Others) and Geography (North America, Europe, Asia, Rest of World (ROW))

  • Which regions are analyzed in the report?

    • North America, Europe, Asia and Rest of World (ROW)

  • What are the key growth drivers and market challenges?

    • Rising global cancer incidence rates, Technical limitations in thermal dosimetry

  • Who are the major players in the Hyperthermia Cancer Treatment Market?

    • Alba Hyperthermia, Belmont Medical Tech., Celsius42 GmbH, Daeyang Medical, DSMED, EDAP TMS, Gamida, Haifu Medical Technology, HECKEL Medizintechnik GmbH, Hydrosun Medizintechnik GmbH, Hypertherm Medical, Koninklijke Philips NV, Medtronic Plc, New Phase, ONCOTHERM KFT, Pyrexar Medical, RanD SpA, Therma Solutions, Vinita Co. Ltd. and VON ARDENNE BIOMEDICAL GmbH

Market Research Insights

  • The Hyperthermia Cancer Treatment represents a highly specialized sector characterized by rapid technological integration and evolving clinical standards. Hospital administrators are actively restructuring multidisciplinary oncology pathways, resulting in a 25% increase in the utilization of patient-specific thermal models for complex tumor management. This operational shift directly supports therapeutic efficacy enhancement and reduces patient recovery times by 15%.
  • Furthermore, advancements in precision hardware design have successfully streamlined equipment procurement cycles, cutting installation-to-operation timelines by 20% across regional networks. These measurable efficiency gains enable ambulatory centers to adopt sophisticated adjunctive therapies without disrupting existing clinical workflows, thereby optimizing capital returns and ensuring strict alignment with modern quality assurance protocols.

We can help! Our analysts can customize this hyperthermia cancer treatment market research report to meet your requirements.

Get in touch

1. Executive Summary

1.1 Market overview

Executive Summary - Chart on Market Overview
Executive Summary - Data Table on Market Overview
Executive Summary - Chart on Global Market Characteristics
Executive Summary - Chart on Market by Geography
Executive Summary - Chart on Market Segmentation by End-user
Executive Summary - Chart on Market Segmentation by Device
Executive Summary - Chart on Market Segmentation by Application
Executive Summary - Chart on Incremental Growth
Executive Summary - Data Table on Incremental Growth
Executive Summary - Chart on Company Market Positioning

2. Technavio Analysis

2.1 Analysis of price sensitivity, lifecycle, customer purchase basket, adoption rates, and purchase criteria

2.2 Criticality of inputs and Factors of differentiation

Chart on Overview on criticality of inputs and factors of differentiation

2.3 Factors of disruption

Chart on Overview on factors of disruption

2.4 Impact of drivers and challenges

Chart on Impact of drivers and challenges in 2025 and 2030

3. Market Landscape

3.1 Market ecosystem

Chart on Parent Market
Data Table on - Parent Market

3.2 Market characteristics

Chart on Market characteristics analysis

3.3 Value chain analysis

Chart on Value chain analysis

4. Market Sizing

4.1 Market definition

Data Table on Offerings of companies included in the market definition

4.2 Market segment analysis

Market segments

4.3 Market size 2025

4.4 Market outlook: Forecast for 2025-2030

Chart on Global - Market size and forecast 2025-2030 ($ thousand)
Data Table on Global - Market size and forecast 2025-2030 ($ thousand)
Chart on Global Market: Year-over-year growth 2025-2030 (%)
Data Table on Global Market: Year-over-year growth 2025-2030 (%)

5. Historic Market Size

5.1 Global Hyperthermia Cancer Treatment Market 2020 - 2024

Historic Market Size - Data Table on Global Hyperthermia Cancer Treatment Market 2020 - 2024 ($ thousand)

5.2 End-user segment analysis 2020 - 2024

Historic Market Size - End-user Segment 2020 - 2024 ($ thousand)

5.3 Device segment analysis 2020 - 2024

Historic Market Size - Device Segment 2020 - 2024 ($ thousand)

5.4 Application segment analysis 2020 - 2024

Historic Market Size - Application Segment 2020 - 2024 ($ thousand)

5.5 Geography segment analysis 2020 - 2024

Historic Market Size - Geography Segment 2020 - 2024 ($ thousand)

5.6 Country segment analysis 2020 - 2024

Historic Market Size - Country Segment 2020 - 2024 ($ thousand)

6. Qualitative Analysis

6.1 Impact of AI on Global Hyperthermia Cancer Treatment Market

6.2 Impact of geopolitical conflicts on Global Hyperthermia Cancer Treatment Market

7. Five Forces Analysis

7.1 Five forces summary

Five forces analysis - Comparison between 2025 and 2030

7.2 Bargaining power of buyers

Bargaining power of buyers - Impact of key factors 2025 and 2030

7.3 Bargaining power of suppliers

Bargaining power of suppliers - Impact of key factors in 2025 and 2030

7.4 Threat of new entrants

Threat of new entrants - Impact of key factors in 2025 and 2030

7.5 Threat of substitutes

Threat of substitutes - Impact of key factors in 2025 and 2030

7.6 Threat of rivalry

Threat of rivalry - Impact of key factors in 2025 and 2030

7.7 Market condition

Chart on Market condition - Five forces 2025 and 2030

8. Market Segmentation by End-user

8.1 Market segments

Chart on End-user - Market share 2025-2030 (%)
Data Table on End-user - Market share 2025-2030 (%)

8.2 Comparison by End-user

Chart on Comparison by End-user
Data Table on Comparison by End-user

8.3 Hospitals and specialty clinics - Market size and forecast 2025-2030

Chart on Hospitals and specialty clinics - Market size and forecast 2025-2030 ($ thousand)
Data Table on Hospitals and specialty clinics - Market size and forecast 2025-2030 ($ thousand)
Chart on Hospitals and specialty clinics - Year-over-year growth 2025-2030 (%)
Data Table on Hospitals and specialty clinics - Year-over-year growth 2025-2030 (%)

8.4 Ambulatory surgical centers - Market size and forecast 2025-2030

Chart on Ambulatory surgical centers - Market size and forecast 2025-2030 ($ thousand)
Data Table on Ambulatory surgical centers - Market size and forecast 2025-2030 ($ thousand)
Chart on Ambulatory surgical centers - Year-over-year growth 2025-2030 (%)
Data Table on Ambulatory surgical centers - Year-over-year growth 2025-2030 (%)

8.5 Research institutes - Market size and forecast 2025-2030

Chart on Research institutes - Market size and forecast 2025-2030 ($ thousand)
Data Table on Research institutes - Market size and forecast 2025-2030 ($ thousand)
Chart on Research institutes - Year-over-year growth 2025-2030 (%)
Data Table on Research institutes - Year-over-year growth 2025-2030 (%)

8.6 Market opportunity by End-user

Market opportunity by End-user ($ thousand)
Data Table on Market opportunity by End-user ($ thousand)

9. Market Segmentation by Device

9.1 Market segments

Chart on Device - Market share 2025-2030 (%)
Data Table on Device - Market share 2025-2030 (%)

9.2 Comparison by Device

Chart on Comparison by Device
Data Table on Comparison by Device

9.3 Radiofrequency hyperthermia devices - Market size and forecast 2025-2030

Chart on Radiofrequency hyperthermia devices - Market size and forecast 2025-2030 ($ thousand)
Data Table on Radiofrequency hyperthermia devices - Market size and forecast 2025-2030 ($ thousand)
Chart on Radiofrequency hyperthermia devices - Year-over-year growth 2025-2030 (%)
Data Table on Radiofrequency hyperthermia devices - Year-over-year growth 2025-2030 (%)

9.4 Microwave hyperthermia devices - Market size and forecast 2025-2030

Chart on Microwave hyperthermia devices - Market size and forecast 2025-2030 ($ thousand)
Data Table on Microwave hyperthermia devices - Market size and forecast 2025-2030 ($ thousand)
Chart on Microwave hyperthermia devices - Year-over-year growth 2025-2030 (%)
Data Table on Microwave hyperthermia devices - Year-over-year growth 2025-2030 (%)

9.5 Infrared radiation hyperthermia devices - Market size and forecast 2025-2030

Chart on Infrared radiation hyperthermia devices - Market size and forecast 2025-2030 ($ thousand)
Data Table on Infrared radiation hyperthermia devices - Market size and forecast 2025-2030 ($ thousand)
Chart on Infrared radiation hyperthermia devices - Year-over-year growth 2025-2030 (%)
Data Table on Infrared radiation hyperthermia devices - Year-over-year growth 2025-2030 (%)

9.6 Ultrasound based hyperthermia devices - Market size and forecast 2025-2030

Chart on Ultrasound based hyperthermia devices - Market size and forecast 2025-2030 ($ thousand)
Data Table on Ultrasound based hyperthermia devices - Market size and forecast 2025-2030 ($ thousand)
Chart on Ultrasound based hyperthermia devices - Year-over-year growth 2025-2030 (%)
Data Table on Ultrasound based hyperthermia devices - Year-over-year growth 2025-2030 (%)

9.7 Market opportunity by Device

Market opportunity by Device ($ thousand)
Data Table on Market opportunity by Device ($ thousand)

10. Market Segmentation by Application

10.1 Market segments

Chart on Application - Market share 2025-2030 (%)
Data Table on Application - Market share 2025-2030 (%)

10.2 Comparison by Application

Chart on Comparison by Application
Data Table on Comparison by Application

10.3 Breast cancer - Market size and forecast 2025-2030

Chart on Breast cancer - Market size and forecast 2025-2030 ($ thousand)
Data Table on Breast cancer - Market size and forecast 2025-2030 ($ thousand)
Chart on Breast cancer - Year-over-year growth 2025-2030 (%)
Data Table on Breast cancer - Year-over-year growth 2025-2030 (%)

10.4 Liver cancer - Market size and forecast 2025-2030

Chart on Liver cancer - Market size and forecast 2025-2030 ($ thousand)
Data Table on Liver cancer - Market size and forecast 2025-2030 ($ thousand)
Chart on Liver cancer - Year-over-year growth 2025-2030 (%)
Data Table on Liver cancer - Year-over-year growth 2025-2030 (%)

10.5 Soft tissue sarcoma - Market size and forecast 2025-2030

Chart on Soft tissue sarcoma - Market size and forecast 2025-2030 ($ thousand)
Data Table on Soft tissue sarcoma - Market size and forecast 2025-2030 ($ thousand)
Chart on Soft tissue sarcoma - Year-over-year growth 2025-2030 (%)
Data Table on Soft tissue sarcoma - Year-over-year growth 2025-2030 (%)

10.6 Leukemia - Market size and forecast 2025-2030

Chart on Leukemia - Market size and forecast 2025-2030 ($ thousand)
Data Table on Leukemia - Market size and forecast 2025-2030 ($ thousand)
Chart on Leukemia - Year-over-year growth 2025-2030 (%)
Data Table on Leukemia - Year-over-year growth 2025-2030 (%)

10.7 Others - Market size and forecast 2025-2030

Chart on Others - Market size and forecast 2025-2030 ($ thousand)
Data Table on Others - Market size and forecast 2025-2030 ($ thousand)
Chart on Others - Year-over-year growth 2025-2030 (%)
Data Table on Others - Year-over-year growth 2025-2030 (%)

10.8 Market opportunity by Application

Market opportunity by Application ($ thousand)
Data Table on Market opportunity by Application ($ thousand)

11. Customer Landscape

11.1 Customer landscape overview

Analysis of price sensitivity, lifecycle, customer purchase basket, adoption rates, and purchase criteria

12. Geographic Landscape

12.1 Geographic segmentation

Chart on Market share by geography 2025-2030 (%)
Data Table on Market share by geography 2025-2030 (%)

12.2 Geographic comparison

Chart on Geographic comparison
Data Table on Geographic comparison

12.3 North America - Market size and forecast 2025-2030

Chart on North America - Market size and forecast 2025-2030 ($ thousand)
Data Table on North America - Market size and forecast 2025-2030 ($ thousand)
Chart on North America - Year-over-year growth 2025-2030 (%)
Data Table on North America - Year-over-year growth 2025-2030 (%)
Chart on Regional Comparison - North America
Data Table on Regional Comparison - North America

12.3.1 US - Market size and forecast 2025-2030

Chart on US - Market size and forecast 2025-2030 ($ thousand)
Data Table on US - Market size and forecast 2025-2030 ($ thousand)
Chart on US - Year-over-year growth 2025-2030 (%)
Data Table on US - Year-over-year growth 2025-2030 (%)

12.3.2 Canada - Market size and forecast 2025-2030

Chart on Canada - Market size and forecast 2025-2030 ($ thousand)
Data Table on Canada - Market size and forecast 2025-2030 ($ thousand)
Chart on Canada - Year-over-year growth 2025-2030 (%)
Data Table on Canada - Year-over-year growth 2025-2030 (%)

12.3.3 Mexico - Market size and forecast 2025-2030

Chart on Mexico - Market size and forecast 2025-2030 ($ thousand)
Data Table on Mexico - Market size and forecast 2025-2030 ($ thousand)
Chart on Mexico - Year-over-year growth 2025-2030 (%)
Data Table on Mexico - Year-over-year growth 2025-2030 (%)

12.4 Europe - Market size and forecast 2025-2030

Chart on Europe - Market size and forecast 2025-2030 ($ thousand)
Data Table on Europe - Market size and forecast 2025-2030 ($ thousand)
Chart on Europe - Year-over-year growth 2025-2030 (%)
Data Table on Europe - Year-over-year growth 2025-2030 (%)
Chart on Regional Comparison - Europe
Data Table on Regional Comparison - Europe

12.4.1 Germany - Market size and forecast 2025-2030

Chart on Germany - Market size and forecast 2025-2030 ($ thousand)
Data Table on Germany - Market size and forecast 2025-2030 ($ thousand)
Chart on Germany - Year-over-year growth 2025-2030 (%)
Data Table on Germany - Year-over-year growth 2025-2030 (%)

12.4.2 UK - Market size and forecast 2025-2030

Chart on UK - Market size and forecast 2025-2030 ($ thousand)
Data Table on UK - Market size and forecast 2025-2030 ($ thousand)
Chart on UK - Year-over-year growth 2025-2030 (%)
Data Table on UK - Year-over-year growth 2025-2030 (%)

12.4.3 France - Market size and forecast 2025-2030

Chart on France - Market size and forecast 2025-2030 ($ thousand)
Data Table on France - Market size and forecast 2025-2030 ($ thousand)
Chart on France - Year-over-year growth 2025-2030 (%)
Data Table on France - Year-over-year growth 2025-2030 (%)

12.4.4 Italy - Market size and forecast 2025-2030

Chart on Italy - Market size and forecast 2025-2030 ($ thousand)
Data Table on Italy - Market size and forecast 2025-2030 ($ thousand)
Chart on Italy - Year-over-year growth 2025-2030 (%)
Data Table on Italy - Year-over-year growth 2025-2030 (%)

12.4.5 Spain - Market size and forecast 2025-2030

Chart on Spain - Market size and forecast 2025-2030 ($ thousand)
Data Table on Spain - Market size and forecast 2025-2030 ($ thousand)
Chart on Spain - Year-over-year growth 2025-2030 (%)
Data Table on Spain - Year-over-year growth 2025-2030 (%)

12.4.6 The Netherlands - Market size and forecast 2025-2030

Chart on The Netherlands - Market size and forecast 2025-2030 ($ thousand)
Data Table on The Netherlands - Market size and forecast 2025-2030 ($ thousand)
Chart on The Netherlands - Year-over-year growth 2025-2030 (%)
Data Table on The Netherlands - Year-over-year growth 2025-2030 (%)

12.5 Asia - Market size and forecast 2025-2030

Chart on Asia - Market size and forecast 2025-2030 ($ thousand)
Data Table on Asia - Market size and forecast 2025-2030 ($ thousand)
Chart on Asia - Year-over-year growth 2025-2030 (%)
Data Table on Asia - Year-over-year growth 2025-2030 (%)
Chart on Regional Comparison - Asia
Data Table on Regional Comparison - Asia

12.5.1 China - Market size and forecast 2025-2030

Chart on China - Market size and forecast 2025-2030 ($ thousand)
Data Table on China - Market size and forecast 2025-2030 ($ thousand)
Chart on China - Year-over-year growth 2025-2030 (%)
Data Table on China - Year-over-year growth 2025-2030 (%)

12.5.2 India - Market size and forecast 2025-2030

Chart on India - Market size and forecast 2025-2030 ($ thousand)
Data Table on India - Market size and forecast 2025-2030 ($ thousand)
Chart on India - Year-over-year growth 2025-2030 (%)
Data Table on India - Year-over-year growth 2025-2030 (%)

12.5.3 Japan - Market size and forecast 2025-2030

Chart on Japan - Market size and forecast 2025-2030 ($ thousand)
Data Table on Japan - Market size and forecast 2025-2030 ($ thousand)
Chart on Japan - Year-over-year growth 2025-2030 (%)
Data Table on Japan - Year-over-year growth 2025-2030 (%)

12.5.4 South Korea - Market size and forecast 2025-2030

Chart on South Korea - Market size and forecast 2025-2030 ($ thousand)
Data Table on South Korea - Market size and forecast 2025-2030 ($ thousand)
Chart on South Korea - Year-over-year growth 2025-2030 (%)
Data Table on South Korea - Year-over-year growth 2025-2030 (%)

12.5.5 Indonesia - Market size and forecast 2025-2030

Chart on Indonesia - Market size and forecast 2025-2030 ($ thousand)
Data Table on Indonesia - Market size and forecast 2025-2030 ($ thousand)
Chart on Indonesia - Year-over-year growth 2025-2030 (%)
Data Table on Indonesia - Year-over-year growth 2025-2030 (%)

12.5.6 Thailand - Market size and forecast 2025-2030

Chart on Thailand - Market size and forecast 2025-2030 ($ thousand)
Data Table on Thailand - Market size and forecast 2025-2030 ($ thousand)
Chart on Thailand - Year-over-year growth 2025-2030 (%)
Data Table on Thailand - Year-over-year growth 2025-2030 (%)

12.6 Rest of World (ROW) - Market size and forecast 2025-2030

Chart on Rest of World (ROW) - Market size and forecast 2025-2030 ($ thousand)
Data Table on Rest of World (ROW) - Market size and forecast 2025-2030 ($ thousand)
Chart on Rest of World (ROW) - Year-over-year growth 2025-2030 (%)
Data Table on Rest of World (ROW) - Year-over-year growth 2025-2030 (%)
Chart on Regional Comparison - Rest of World (ROW)
Data Table on Regional Comparison - Rest of World (ROW)

12.6.1 Brazil - Market size and forecast 2025-2030

Chart on Brazil - Market size and forecast 2025-2030 ($ thousand)
Data Table on Brazil - Market size and forecast 2025-2030 ($ thousand)
Chart on Brazil - Year-over-year growth 2025-2030 (%)
Data Table on Brazil - Year-over-year growth 2025-2030 (%)

12.6.2 Saudi Arabia - Market size and forecast 2025-2030

Chart on Saudi Arabia - Market size and forecast 2025-2030 ($ thousand)
Data Table on Saudi Arabia - Market size and forecast 2025-2030 ($ thousand)
Chart on Saudi Arabia - Year-over-year growth 2025-2030 (%)
Data Table on Saudi Arabia - Year-over-year growth 2025-2030 (%)

12.6.3 UAE - Market size and forecast 2025-2030

Chart on UAE - Market size and forecast 2025-2030 ($ thousand)
Data Table on UAE - Market size and forecast 2025-2030 ($ thousand)
Chart on UAE - Year-over-year growth 2025-2030 (%)
Data Table on UAE - Year-over-year growth 2025-2030 (%)

12.6.4 Turkey - Market size and forecast 2025-2030

Chart on Turkey - Market size and forecast 2025-2030 ($ thousand)
Data Table on Turkey - Market size and forecast 2025-2030 ($ thousand)
Chart on Turkey - Year-over-year growth 2025-2030 (%)
Data Table on Turkey - Year-over-year growth 2025-2030 (%)

12.6.5 Argentina - Market size and forecast 2025-2030

Chart on Argentina - Market size and forecast 2025-2030 ($ thousand)
Data Table on Argentina - Market size and forecast 2025-2030 ($ thousand)
Chart on Argentina - Year-over-year growth 2025-2030 (%)
Data Table on Argentina - Year-over-year growth 2025-2030 (%)

12.6.6 Colombia - Market size and forecast 2025-2030

Chart on Colombia - Market size and forecast 2025-2030 ($ thousand)
Data Table on Colombia - Market size and forecast 2025-2030 ($ thousand)
Chart on Colombia - Year-over-year growth 2025-2030 (%)
Data Table on Colombia - Year-over-year growth 2025-2030 (%)

12.6.7 South Africa - Market size and forecast 2025-2030

Chart on South Africa - Market size and forecast 2025-2030 ($ thousand)
Data Table on South Africa - Market size and forecast 2025-2030 ($ thousand)
Chart on South Africa - Year-over-year growth 2025-2030 (%)
Data Table on South Africa - Year-over-year growth 2025-2030 (%)

12.6.8 Israel - Market size and forecast 2025-2030

Chart on Israel - Market size and forecast 2025-2030 ($ thousand)
Data Table on Israel - Market size and forecast 2025-2030 ($ thousand)
Chart on Israel - Year-over-year growth 2025-2030 (%)
Data Table on Israel - Year-over-year growth 2025-2030 (%)

12.7 Market opportunity by geography

Market opportunity by geography ($ thousand)
Data Tables on Market opportunity by geography ($ thousand)

13. Drivers, Challenges, and Opportunity

13.1 Market drivers

Rising global cancer incidence rates
Technological advancements in equipment
Expansion of clinical research

13.2 Market challenges

Technical limitations in thermal dosimetry
Stringent regulatory approval pathways
Restricted reimbursement and high costs

13.3 Impact of drivers and challenges

Impact of drivers and challenges in 2025 and 2030

13.4 Market opportunities

Adoption of nanoparticle mediated hyperthermia
Expansion of ambulatory cancer centers
AI In Treatment Planning

14. Competitive Landscape

14.1 Overview

14.2

Overview on criticality of inputs and factors of differentiation

14.3 Landscape disruption

Overview on factors of disruption

14.4 Industry risks

Impact of key risks on business

15. Competitive Analysis

15.1 Companies profiled

Companies covered

15.2 Company ranking index

15.3 Market positioning of companies

Matrix on companies position and classification

15.4 Belmont Medical Tech.

Belmont Medical Tech. - Overview
Belmont Medical Tech. - Product / Service
Belmont Medical Tech. - Key offerings
SWOT

15.5 Daeyang Medical

Daeyang Medical - Overview
Daeyang Medical - Product / Service
Daeyang Medical - Key offerings
SWOT

15.6 DSMED

DSMED - Overview
DSMED - Product / Service
DSMED - Key offerings
SWOT

15.7 EDAP TMS

EDAP TMS - Overview
EDAP TMS - Product / Service
EDAP TMS - Key offerings
SWOT

15.8 Haifu Medical Technology

Haifu Medical Technology - Overview
Haifu Medical Technology - Product / Service
Haifu Medical Technology - Key offerings
SWOT

15.9 HECKEL Medizintechnik GmbH

HECKEL Medizintechnik GmbH - Overview
HECKEL Medizintechnik GmbH - Product / Service
HECKEL Medizintechnik GmbH - Key offerings
SWOT

15.10 Hydrosun Medizintechnik GmbH

Hydrosun Medizintechnik GmbH - Overview
Hydrosun Medizintechnik GmbH - Product / Service
Hydrosun Medizintechnik GmbH - Key offerings
SWOT

15.11 Koninklijke Philips NV

Koninklijke Philips NV - Overview
Koninklijke Philips NV - Business segments
Koninklijke Philips NV - Key news
Koninklijke Philips NV - Key offerings
Koninklijke Philips NV - Segment focus
SWOT

15.12 Medtronic Plc

Medtronic Plc - Overview
Medtronic Plc - Business segments
Medtronic Plc - Key news
Medtronic Plc - Key offerings
Medtronic Plc - Segment focus
SWOT

15.13 New Phase

New Phase - Overview
New Phase - Product / Service
New Phase - Key offerings
SWOT

15.14 Pyrexar Medical

Pyrexar Medical - Overview
Pyrexar Medical - Product / Service
Pyrexar Medical - Key offerings
SWOT

15.15 RanD SpA

RanD SpA - Overview
RanD SpA - Product / Service
RanD SpA - Key offerings
SWOT

15.16 Therma Solutions

Therma Solutions - Overview
Therma Solutions - Product / Service
Therma Solutions - Key offerings
SWOT

15.17 Vinita Co. Ltd.

Vinita Co. Ltd. - Overview
Vinita Co. Ltd. - Product / Service
Vinita Co. Ltd. - Key offerings
SWOT

15.18 VON ARDENNE BIOMEDICAL GmbH

VON ARDENNE BIOMEDICAL GmbH - Overview
VON ARDENNE BIOMEDICAL GmbH - Product / Service
VON ARDENNE BIOMEDICAL GmbH - Key offerings
SWOT

16. Appendix

16.1 Scope of the report

Market definition
Objectives
Notes and caveats

16.2 Inclusions and exclusions checklist

Inclusions checklist
Exclusions checklist

16.3 Currency conversion rates for US$

16.4 Research methodology

16.5 Data procurement

Information sources

16.6 Data validation

16.7 Validation techniques employed for market sizing

16.8 Data synthesis

16.9 360 degree market analysis

16.10 List of abbreviations

Research Methodology

Technavio presents a detailed picture of the market by way of study, synthesis, and summation of data from multiple sources. The analysts have presented the various facets of the market with a particular focus on identifying the key industry influencers. The data thus presented is comprehensive, reliable, and the result of extensive research, both primary and secondary.

INFORMATION SOURCES

Primary sources

  • Manufacturers and suppliers
  • Channel partners
  • Industry experts
  • Strategic decision makers

Secondary sources

  • Industry journals and periodicals
  • Government data
  • Financial reports of key industry players
  • Historical data
  • Press releases

DATA ANALYSIS

Data Synthesis

  • Collation of data
  • Estimation of key figures
  • Analysis of derived insights

Data Validation

  • Triangulation with data models
  • Reference against proprietary databases
  • Corroboration with industry experts

REPORT WRITING

Qualitative

  • Market drivers
  • Market challenges
  • Market trends
  • Five forces analysis

Quantitative

  • Market size and forecast
  • Market segmentation
  • Geographical insights
  • Competitive landscape

Interested in this report?

Get your sample now to see our research methodology and insights!

Download Now

Frequently Asked Questions

Hyperthermia Cancer Treatment market growth will increase by USD 70992.2 thousand thousand during 2026-2030.

The Hyperthermia Cancer Treatment market is expected to grow at a CAGR of 6.3% during 2026-2030.

Hyperthermia Cancer Treatment market is segmented by End-user (Hospitals and specialty clinics, Ambulatory surgical centers, Research institutes) Device (Radiofrequency hyperthermia devices, Microwave hyperthermia devices, Infrared radiation hyperthermia devices, Ultrasound based hyperthermia devices) Application (Breast cancer, Liver cancer, Soft tissue sarcoma, Leukemia, Others)

Alba Hyperthermia, Belmont Medical Tech., Celsius42 GmbH, Daeyang Medical, DSMED, EDAP TMS, Gamida, Haifu Medical Technology, HECKEL Medizintechnik GmbH, Hydrosun Medizintechnik GmbH, Hypertherm Medical, Koninklijke Philips NV, Medtronic Plc, New Phase, ONCOTHERM KFT, Pyrexar Medical, RanD SpA, Therma Solutions, Vinita Co. Ltd., VON ARDENNE BIOMEDICAL GmbH are a few of the key vendors in the Hyperthermia Cancer Treatment market.

North America will register the highest growth rate of 45.2% among the other regions. Therefore, the Hyperthermia Cancer Treatment market in North America is expected to garner significant business opportunities for the vendors during the forecast period.

US, Canada, Mexico, Germany, UK, France, Italy, Spain, The Netherlands, China, India, Japan, South Korea, Indonesia, Thailand, Brazil, Saudi Arabia, UAE, Turkey, Argentina, Colombia, South Africa, Israel

  • Rising global cancer incidence rates is the driving factor this market.

The Hyperthermia Cancer Treatment market vendors should focus on grabbing business opportunities from the End-user segment as it accounted for the largest market share in the base year.
RIA - Research AI Assistant
Ask RIA
