Life Jacket Market Analysis North America, Europe, APAC, South America, Middle East and Africa - US, China, Australia, UK, Brazil - Size and Forecast 2023-2027
| Published: Dec 2022 | Pages: 155 | SKU: IRTNTR71007 |
Life Jacket Market Report 2023-2027
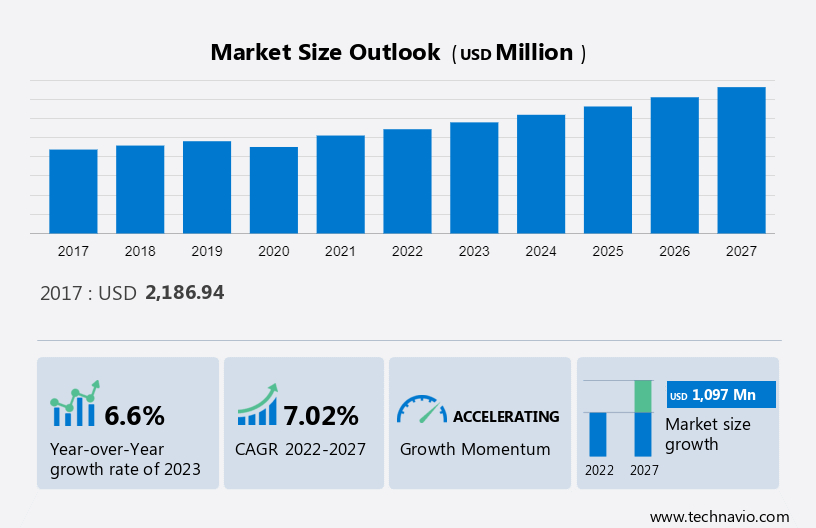
The Life Jacket Market size is estimated to grow at a CAGR of 7.02% between 2022 and 2027. The size of the market is forecast to increase by USD 1,097 million. The growth of the market depends on several factors, including the growing popularity of water sports tourism, increased demand for life jackets, and rising awareness about multiple advantages of water sporting activities.
To learn more about this report, Download Sample PDF
This life jacket market report extensively covers market segmentation by End-user (commercial operators, professional users, and swift water rescue users), Product (inherent and inflatable), and Geography (North America, Europe, APAC, South America, and Middle East and Africa). It also includes an in-depth analysis of drivers, trends, and challenges. Furthermore, the report includes historic market data from 2017 - 2021.
The life jacket market share growth of the commercial operators segment will be significant during the forecast period. Staffed by a team of professionals, commercial operators plan every detail of the trip and even customize trips. Such operators also provide a retail shop with the required gear for the sport.
Get a glance at the market contribution of various segments Download Sample PDF
The commercial operators segment was valued at USD 1,347.16 million in 2017 and continued to grow until 2021. Commercial operators exist around popular water sports destinations and offer attractive packages and professional guidance for adventure water sports. These operators are certified to teach and guide river rescue and water sports activities. The number of recreational travelers has grown globally, led by increased purchasing power. This segment dominates the market and is expected to continue dominating the global market during the forecast period.
Expanding water sports infrastructure for a better experience is the primary trend in the market. The recreational water sports market has been providing a novel business opportunity to many coastal cities or regions with water bodies. Many initiatives have been undertaken to promote the proper growth and expansion of water sporting facilities across the globe. Europe has been introducing initiatives aimed at strengthening the water sports industry.
The Facilities for the Water Sports Industry (FAWI) project aims at improving facilities for the water sports industry. The project focuses on professionalizing and economically strengthening the water sports industry through sustainable development, upgrades, positioning, quality improvements, and cross-border collaborations in the water sports segment. Such initiatives are driving the growth of the overall market at large.
The frequent need for maintenance of life jackets is the major challenge impeding the market growth. Life jacket fabrics wear out and lose efficiency with constant use. Apart from this, foam compression strength can impact the performance of foam life jackets. This necessitates the inspection of life jackets at regular intervals is necessary to avoid last-minute hassles or fatal accidents.
The common reasons behind the failure of life jackets are leaks, fabric degradation, or inadequately installed CO2 cylinders. Owing to a large number of such issues, regular maintenance becomes difficult. Subsequently, market competitors would be under pressure from government bodies and customers to design life jackets that require less maintenance. This restricts the market growth to a large extent.
Life Jacket Market Regions
For more insights on the market share of various regions Download PDF Sample now!
APAC is estimated to contribute 32% to the growth of the global market during the forecast period. Technavio’s analysts have elaborately explained the regional trends and drivers that shape the market during the forecast period.
North America accounts for the largest share of the global life jacket market. The US is one of the major contributors to the market, owing to the popularity of water sports in the country. This can be attributed to the growth in inbound tourism. An increasing number of baby boomers are taking up water sports activities as a form of exercise in the US. This is one of the key factors contributing to market growth.
The rise in dual-income households has contributed to increased participation in outdoor recreational and sports activities. This has led to enhanced participation in different types of water sports and, thus, increased demand for life jackets. The participation of women in water sports has also increased in the region. The aforementioned factors fuel the growth of the market in the region.
Key Companies and Market Share Life Jacket Market Analysis?
Companies are implementing various strategies, such as strategic alliances, partnerships, mergers and acquisitions, geographical expansion, and product/service launches, to enhance their presence in the market.
Alliance Marine - The company offers inflatable life jackets such as infant life jackets, lil legends foam jackets, hydrostatic inflatable PFD, Khimera dual flotation, and automatic inflatable jackets under their subsidiary named Mustang Survival Corp. The company offers marine equipment under various brands such as Plastimo, Intermer, VDM Reya, Seimi, Berra marine service, and Berthelot.
The research report also includes detailed analyses of the competitive landscape of the market and information about 15 market companies, including:
- Absolute Outdoor Inc.
- Aqua Leisure Recreation LLC
- Aqua Life
- Dongguan City Bestway Sports Goods Co. Ltd.
- Ganesh Manufacturing
- Grand Ocean Marine Co. Ltd.
- H3O Water Sports
- Jiangsu Baizhou Safety Technology Co. Ltd.
- Johnson Outdoors Inc.
- Kibo Software Inc.
- Majestic Marine and Engineering Services
- Newell Brands Inc.
- SeaSafe Systems Ltd.
- Spinlock Ltd.
- Stormy Lifejackets Pty Ltd.
- Survitec Group Ltd.
- VIKING LIFE SAVING EQUIPMENT AS
- Wing Group
- Air Liquide SA
Qualitative and quantitative analysis of companies has been conducted to help clients understand the wider business environment as well as the strengths and weaknesses of key market players. Data is qualitatively analyzed to categorize companies as pure play, category-focused, industry-focused, and diversified; it is quantitatively analyzed to categorize companies as dominant, leading, strong, tentative, and weak.
|
Life Jacket Market Scope |
|
|
Report Coverage |
Details |
|
Page number |
155 |
|
Base year |
2022 |
|
Historic period |
2017 - 2021 |
|
Forecast period |
2023-2027 |
|
Growth momentum & CAGR |
Accelerate at a CAGR of 7.02% |
|
Market growth 2023-2027 |
USD 1,097 million |
|
Market structure |
Fragmented |
|
YoY growth 2022-2023(%) |
6.6 |
|
Regional analysis |
North America, Europe, APAC, South America, and Middle East and Africa |
|
Performing market contribution |
APAC at 32% |
|
Key countries |
US, China, Australia, UK, and Brazil |
|
Competitive landscape |
Leading Companies, Market Positioning of Companies, Competitive Strategies, and Industry Risks |
|
Key companies profiled |
Absolute Outdoor Inc., Aqua Leisure Recreation LLC, Aqua Life, Dongguan City Bestway Sports Goods Co. Ltd., Ganesh Manufacturing, Grand Ocean Marine Co. Ltd., H3O Water Sports, Jiangsu Baizhou Safety Technology Co. Ltd., Johnson Outdoors Inc., Kibo Software Inc., Majestic Marine and Engineering Services, Newell Brands Inc., SeaSafe Systems Ltd., Spinlock Ltd., Stormy Lifejackets Pty Ltd., Survitec Group Ltd., VIKING LIFE SAVING EQUIPMENT AS, Wing Group, Air Liquide SA, and Alliance Marine |
|
Market dynamics |
Parent market analysis, Market growth inducers and obstacles, Fast-growing and slow-growing segment analysis, COVID 19 impact and recovery analysis and future consumer dynamics, Market condition analysis for forecast period |
|
Customization purview |
If our report has not included the data that you are looking for, you can reach out to our analysts and get segments customized. |
What are the Key Data Covered in this Life Jacket Market Research Report?
- CAGR of the market during the forecast period
- Detailed information on factors that will drive the growth of the market between 2023 and 2027
- Precise estimation of the size of the market size and its contribution of the market in focus to the parent market
- Accurate predictions about upcoming trends and changes in consumer behaviour
- Growth of the market industry across North America, Europe, APAC, South America, and Middle East and Africa
- Thorough analysis of the market’s competitive landscape and detailed information about companies
- Comprehensive analysis of factors that will challenge the growth of market companies
We can help! Our analysts can customize this market research report to meet your requirements.
1 Executive Summary
- 1.1 Market overview
- Exhibit 01: Executive Summary – Chart on Market Overview
- Exhibit 02: Executive Summary – Data Table on Market Overview
- Exhibit 03: Executive Summary – Chart on Global Market Characteristics
- Exhibit 04: Executive Summary – Chart on Market by Geography
- Exhibit 05: Executive Summary – Chart on Market Segmentation by End-user
- Exhibit 06: Executive Summary – Chart on Market Segmentation by Product
- Exhibit 07: Executive Summary – Chart on Incremental Growth
- Exhibit 08: Executive Summary – Data Table on Incremental Growth
- Exhibit 09: Executive Summary – Chart on Vendor Market Positioning
2 Market Landscape
- 2.1 Market ecosystem
- Exhibit 10: Parent market
- Exhibit 11: Market Characteristics
3 Market Sizing
- 3.1 Market definition
- Exhibit 12: Offerings of vendors included in the market definition
- 3.2 Market segment analysis
- Exhibit 13: Market segments
- 3.3 Market size 2022
- 3.4 Market outlook: Forecast for 2022-2027
- Exhibit 14: Chart on Global - Market size and forecast 2022-2027 ($ million)
- Exhibit 15: Data Table on Global - Market size and forecast 2022-2027 ($ million)
- Exhibit 16: Chart on Global Market: Year-over-year growth 2022-2027 (%)
- Exhibit 17: Data Table on Global Market: Year-over-year growth 2022-2027 (%)
4 Historic Market Size
- 4.1 Global life jacket market 2017 - 2021
- Exhibit 18: Historic Market Size – Data Table on Global life jacket market 2017 - 2021 ($ million)
- 4.2 End-user Segment Analysis 2017 - 2021
- Exhibit 19: Historic Market Size – End-user Segment 2017 - 2021 ($ million)
- 4.3 Product Segment Analysis 2017 - 2021
- Exhibit 20: Historic Market Size – Product Segment 2017 - 2021 ($ million)
- 4.4 Geography Segment Analysis 2017 - 2021
- Exhibit 21: Historic Market Size – Geography Segment 2017 - 2021 ($ million)
- 4.5 Country Segment Analysis 2017 - 2021
- Exhibit 22: Historic Market Size – Country Segment 2017 - 2021 ($ million)
5 Five Forces Analysis
- 5.1 Five forces summary
- Exhibit 23: Five forces analysis - Comparison between 2022 and 2027
- 5.2 Bargaining power of buyers
- Exhibit 24: Chart on Bargaining power of buyers – Impact of key factors 2022 and 2027
- 5.3 Bargaining power of suppliers
- Exhibit 25: Bargaining power of suppliers – Impact of key factors in 2022 and 2027
- 5.4 Threat of new entrants
- Exhibit 26: Threat of new entrants – Impact of key factors in 2022 and 2027
- 5.5 Threat of substitutes
- Exhibit 27: Threat of substitutes – Impact of key factors in 2022 and 2027
- 5.6 Threat of rivalry
- Exhibit 28: Threat of rivalry – Impact of key factors in 2022 and 2027
- 5.7 Market condition
- Exhibit 29: Chart on Market condition - Five forces 2022 and 2027
6 Market Segmentation by End-user
- 6.1 Market segments
- Exhibit 30: Chart on End-user - Market share 2022-2027 (%)
- Exhibit 31: Data Table on End-user - Market share 2022-2027 (%)
- 6.2 Comparison by End-user
- Exhibit 32: Chart on Comparison by End-user
- Exhibit 33: Data Table on Comparison by End-user
- 6.3 Commercial operators - Market size and forecast 2022-2027
- Exhibit 34: Chart on Commercial operators - Market size and forecast 2022-2027 ($ million)
- Exhibit 35: Data Table on Commercial operators - Market size and forecast 2022-2027 ($ million)
- Exhibit 36: Chart on Commercial operators - Year-over-year growth 2022-2027 (%)
- Exhibit 37: Data Table on Commercial operators - Year-over-year growth 2022-2027 (%)
- 6.4 Professional users - Market size and forecast 2022-2027
- Exhibit 38: Chart on Professional users - Market size and forecast 2022-2027 ($ million)
- Exhibit 39: Data Table on Professional users - Market size and forecast 2022-2027 ($ million)
- Exhibit 40: Chart on Professional users - Year-over-year growth 2022-2027 (%)
- Exhibit 41: Data Table on Professional users - Year-over-year growth 2022-2027 (%)
- 6.5 Swift water rescue users - Market size and forecast 2022-2027
- Exhibit 42: Chart on Swift water rescue users - Market size and forecast 2022-2027 ($ million)
- Exhibit 43: Data Table on Swift water rescue users - Market size and forecast 2022-2027 ($ million)
- Exhibit 44: Chart on Swift water rescue users - Year-over-year growth 2022-2027 (%)
- Exhibit 45: Data Table on Swift water rescue users - Year-over-year growth 2022-2027 (%)
- 6.6 Market opportunity by End-user
- Exhibit 46: Market opportunity by End-user ($ million)
7 Market Segmentation by Product
- 7.1 Market segments
- Exhibit 47: Chart on Product - Market share 2022-2027 (%)
- Exhibit 48: Data Table on Product - Market share 2022-2027 (%)
- 7.2 Comparison by Product
- Exhibit 49: Chart on Comparison by Product
- Exhibit 50: Data Table on Comparison by Product
- 7.3 Inherent - Market size and forecast 2022-2027
- Exhibit 51: Chart on Inherent - Market size and forecast 2022-2027 ($ million)
- Exhibit 52: Data Table on Inherent - Market size and forecast 2022-2027 ($ million)
- Exhibit 53: Chart on Inherent - Year-over-year growth 2022-2027 (%)
- Exhibit 54: Data Table on Inherent - Year-over-year growth 2022-2027 (%)
- 7.4 Inflatable - Market size and forecast 2022-2027
- Exhibit 55: Chart on Inflatable - Market size and forecast 2022-2027 ($ million)
- Exhibit 56: Data Table on Inflatable - Market size and forecast 2022-2027 ($ million)
- Exhibit 57: Chart on Inflatable - Year-over-year growth 2022-2027 (%)
- Exhibit 58: Data Table on Inflatable - Year-over-year growth 2022-2027 (%)
- 7.5 Market opportunity by Product
- Exhibit 59: Market opportunity by Product ($ million)
8 Customer Landscape
- 8.1 Customer landscape overview
- Exhibit 60: Analysis of price sensitivity, lifecycle, customer purchase basket, adoption rates, and purchase criteria
9 Geographic Landscape
- 9.1 Geographic segmentation
- Exhibit 61: Chart on Market share by geography 2022-2027 (%)
- Exhibit 62: Data Table on Market share by geography 2022-2027 (%)
- 9.2 Geographic comparison
- Exhibit 63: Chart on Geographic comparison
- Exhibit 64: Data Table on Geographic comparison
- 9.3 North America - Market size and forecast 2022-2027
- Exhibit 65: Chart on North America - Market size and forecast 2022-2027 ($ million)
- Exhibit 66: Data Table on North America - Market size and forecast 2022-2027 ($ million)
- Exhibit 67: Chart on North America - Year-over-year growth 2022-2027 (%)
- Exhibit 68: Data Table on North America - Year-over-year growth 2022-2027 (%)
- 9.4 Europe - Market size and forecast 2022-2027
- Exhibit 69: Chart on Europe - Market size and forecast 2022-2027 ($ million)
- Exhibit 70: Data Table on Europe - Market size and forecast 2022-2027 ($ million)
- Exhibit 71: Chart on Europe - Year-over-year growth 2022-2027 (%)
- Exhibit 72: Data Table on Europe - Year-over-year growth 2022-2027 (%)
- 9.5 APAC - Market size and forecast 2022-2027
- Exhibit 73: Chart on APAC - Market size and forecast 2022-2027 ($ million)
- Exhibit 74: Data Table on APAC - Market size and forecast 2022-2027 ($ million)
- Exhibit 75: Chart on APAC - Year-over-year growth 2022-2027 (%)
- Exhibit 76: Data Table on APAC - Year-over-year growth 2022-2027 (%)
- 9.6 South America - Market size and forecast 2022-2027
- Exhibit 77: Chart on South America - Market size and forecast 2022-2027 ($ million)
- Exhibit 78: Data Table on South America - Market size and forecast 2022-2027 ($ million)
- Exhibit 79: Chart on South America - Year-over-year growth 2022-2027 (%)
- Exhibit 80: Data Table on South America - Year-over-year growth 2022-2027 (%)
- 9.7 Middle East and Africa - Market size and forecast 2022-2027
- Exhibit 81: Chart on Middle East and Africa - Market size and forecast 2022-2027 ($ million)
- Exhibit 82: Data Table on Middle East and Africa - Market size and forecast 2022-2027 ($ million)
- Exhibit 83: Chart on Middle East and Africa - Year-over-year growth 2022-2027 (%)
- Exhibit 84: Data Table on Middle East and Africa - Year-over-year growth 2022-2027 (%)
- 9.8 US - Market size and forecast 2022-2027
- Exhibit 85: Chart on US - Market size and forecast 2022-2027 ($ million)
- Exhibit 86: Data Table on US - Market size and forecast 2022-2027 ($ million)
- Exhibit 87: Chart on US - Year-over-year growth 2022-2027 (%)
- Exhibit 88: Data Table on US - Year-over-year growth 2022-2027 (%)
- 9.9 UK - Market size and forecast 2022-2027
- Exhibit 89: Chart on UK - Market size and forecast 2022-2027 ($ million)
- Exhibit 90: Data Table on UK - Market size and forecast 2022-2027 ($ million)
- Exhibit 91: Chart on UK - Year-over-year growth 2022-2027 (%)
- Exhibit 92: Data Table on UK - Year-over-year growth 2022-2027 (%)
- 9.10 China - Market size and forecast 2022-2027
- Exhibit 93: Chart on China - Market size and forecast 2022-2027 ($ million)
- Exhibit 94: Data Table on China - Market size and forecast 2022-2027 ($ million)
- Exhibit 95: Chart on China - Year-over-year growth 2022-2027 (%)
- Exhibit 96: Data Table on China - Year-over-year growth 2022-2027 (%)
- 9.11 Brazil - Market size and forecast 2022-2027
- Exhibit 97: Chart on Brazil - Market size and forecast 2022-2027 ($ million)
- Exhibit 98: Data Table on Brazil - Market size and forecast 2022-2027 ($ million)
- Exhibit 99: Chart on Brazil - Year-over-year growth 2022-2027 (%)
- Exhibit 100: Data Table on Brazil - Year-over-year growth 2022-2027 (%)
- 9.12 Australia - Market size and forecast 2022-2027
- Exhibit 101: Chart on Australia - Market size and forecast 2022-2027 ($ million)
- Exhibit 102: Data Table on Australia - Market size and forecast 2022-2027 ($ million)
- Exhibit 103: Chart on Australia - Year-over-year growth 2022-2027 (%)
- Exhibit 104: Data Table on Australia - Year-over-year growth 2022-2027 (%)
- 9.13 Market opportunity by geography
- Exhibit 105: Market opportunity by geography ($ million)
10 Drivers, Challenges, and Trends
- 10.1 Market drivers
- 10.2 Market challenges
- 10.3 Impact of drivers and challenges
- Exhibit 106: Impact of drivers and challenges in 2022 and 2027
- 10.4 Market trends
11 Vendor Landscape
- 11.1 Overview
- 11.2 Vendor landscape
- Exhibit 107: Overview on Criticality of inputs and Factors of differentiation
- 11.3 Landscape disruption
- Exhibit 108: Overview on factors of disruption
- 11.4 Industry risks
- Exhibit 109: Impact of key risks on business
12 Vendor Analysis
- 12.1 Vendors covered
- Exhibit 110: Vendors covered
- 12.2 Market positioning of vendors
- Exhibit 111: Matrix on vendor position and classification
- 12.3 Absolute Outdoor Inc.
- Exhibit 112: Absolute Outdoor Inc. - Overview
- Exhibit 113: Absolute Outdoor Inc. - Product / Service
- Exhibit 114: Absolute Outdoor Inc. - Key offerings
- 12.4 Alliance Marine
- Exhibit 115: Alliance Marine - Overview
- Exhibit 116: Alliance Marine - Product / Service
- Exhibit 117: Alliance Marine - Key offerings
- 12.5 Aqua Leisure Recreation LLC
- Exhibit 118: Aqua Leisure Recreation LLC - Overview
- Exhibit 119: Aqua Leisure Recreation LLC - Product / Service
- Exhibit 120: Aqua Leisure Recreation LLC - Key offerings
- 12.6 Dongguan City Bestway Sports Goods Co. Ltd.
- Exhibit 121: Dongguan City Bestway Sports Goods Co. Ltd. - Overview
- Exhibit 122: Dongguan City Bestway Sports Goods Co. Ltd. - Product / Service
- Exhibit 123: Dongguan City Bestway Sports Goods Co. Ltd. - Key offerings
- 12.7 Ganesh Manufacturing
- Exhibit 124: Ganesh Manufacturing - Overview
- Exhibit 125: Ganesh Manufacturing - Product / Service
- Exhibit 126: Ganesh Manufacturing - Key offerings
- 12.8 Grand Ocean Marine Co. Ltd.
- Exhibit 127: Grand Ocean Marine Co. Ltd. - Overview
- Exhibit 128: Grand Ocean Marine Co. Ltd. - Product / Service
- Exhibit 129: Grand Ocean Marine Co. Ltd. - Key offerings
- 12.9 Jiangsu Baizhou Safety Technology Co. Ltd.
- Exhibit 130: Jiangsu Baizhou Safety Technology Co. Ltd. - Overview
- Exhibit 131: Jiangsu Baizhou Safety Technology Co. Ltd. - Product / Service
- Exhibit 132: Jiangsu Baizhou Safety Technology Co. Ltd. - Key offerings
- 12.10 Johnson Outdoors Inc.
- Exhibit 133: Johnson Outdoors Inc. - Overview
- Exhibit 134: Johnson Outdoors Inc. - Business segments
- Exhibit 135: Johnson Outdoors Inc. - Key offerings
- Exhibit 136: Johnson Outdoors Inc. - Segment focus
- 12.11 Kibo Software Inc.
- Exhibit 137: Kibo Software Inc. - Overview
- Exhibit 138: Kibo Software Inc. - Product / Service
- Exhibit 139: Kibo Software Inc. - Key offerings
- 12.12 Majestic Marine and Engineering Services
- Exhibit 140: Majestic Marine and Engineering Services - Overview
- Exhibit 141: Majestic Marine and Engineering Services - Product / Service
- Exhibit 142: Majestic Marine and Engineering Services - Key offerings
- 12.13 Newell Brands Inc.
- Exhibit 143: Newell Brands Inc. - Overview
- Exhibit 144: Newell Brands Inc. - Business segments
- Exhibit 145: Newell Brands Inc. - Key news
- Exhibit 146: Newell Brands Inc. - Key offerings
- Exhibit 147: Newell Brands Inc. - Segment focus
- 12.14 Stormy Lifejackets Pty Ltd.
- Exhibit 148: Stormy Lifejackets Pty Ltd. - Overview
- Exhibit 149: Stormy Lifejackets Pty Ltd. - Product / Service
- Exhibit 150: Stormy Lifejackets Pty Ltd. - Key offerings
- 12.15 Survitec Group Ltd.
- Exhibit 151: Survitec Group Ltd. - Overview
- Exhibit 152: Survitec Group Ltd. - Product / Service
- Exhibit 153: Survitec Group Ltd. - Key offerings
- 12.16 VIKING LIFE SAVING EQUIPMENT AS
- Exhibit 154: VIKING LIFE SAVING EQUIPMENT AS - Overview
- Exhibit 155: VIKING LIFE SAVING EQUIPMENT AS - Product / Service
- Exhibit 156: VIKING LIFE SAVING EQUIPMENT AS - Key offerings
- 12.17 Wing Group
- Exhibit 157: Wing Group - Overview
- Exhibit 158: Wing Group - Product / Service
- Exhibit 159: Wing Group - Key offerings
13 Appendix
- 13.1 Scope of the report
- 13.2 Inclusions and exclusions checklist
- Exhibit 160: Inclusions checklist
- Exhibit 161: Exclusions checklist
- 13.3 Currency conversion rates for US$
- Exhibit 162: Currency conversion rates for US$
- 13.4 Research methodology
- Exhibit 163: Research methodology
- Exhibit 164: Validation techniques employed for market sizing
- Exhibit 165: Information sources
- 13.5 List of abbreviations
- Exhibit 166: List of abbreviations
Research Framework
Technavio presents a detailed picture of the market by way of study, synthesis, and summation of data from multiple sources. The analysts have presented the various facets of the market with a particular focus on identifying the key industry influencers. The data thus presented is comprehensive, reliable, and the result of extensive research, both primary and secondary.
INFORMATION SOURCES
Primary sources
- Manufacturers and suppliers
- Channel partners
- Industry experts
- Strategic decision makers
Secondary sources
- Industry journals and periodicals
- Government data
- Financial reports of key industry players
- Historical data
- Press releases
DATA ANALYSIS
Data Synthesis
- Collation of data
- Estimation of key figures
- Analysis of derived insights
Data Validation
- Triangulation with data models
- Reference against proprietary databases
- Corroboration with industry experts
REPORT WRITING
Qualitative
- Market drivers
- Market challenges
- Market trends
- Five forces analysis
Quantitative
- Market size and forecast
- Market segmentation
- Geographical insights
- Competitive landscape
PURCHASE FULL REPORT OF
life jacket market
Key Questions Answered
- What are the key global market and the regional market share?
- What are the revenue-generating key market segments?
- What are the key factors driving and challenging this market’s growth?
- Who are the key market vendors and their growth strategies?
- What are the latest trends influencing the growth of this market?
- What are the variables influencing the market growth in the primary regions?
- What are the factors influencing the growth of the parent market?
Why should you prefer Technavio's market insights report?
- Off-the-shelf research reports
- Reports can be tailored to meet the customer's needs
- Trusted by more than 100 fortune 500 organizations
- Information about the market's key drivers, trends, and challenges
- Parent market analysis
- Every week, 50,000 people visit our subscription platform
- Detailed vendors report with competitive landscape
- Covid-19 impact and recovery analysis
- Data on revenue-generating market segments
- Details on the market shares of various regions
- Five-force market analysis