Sports Tourism Market Analysis, Size, and Forecast 2026-2030: Europe (Germany, UK, and France), APAC (China, Japan, and India), North America (US, Canada, and Mexico), South America (Brazil and Argentina), Middle East and Africa (Saudi Arabia, UAE, and South Africa), and Rest of World (ROW)

Sports Tourism Market Analysis, Size, and Forecast 2026-2030:
Europe (Germany, UK, and France), APAC (China, Japan, and India), North America (US, Canada, and Mexico), South America (Brazil and Argentina), Middle East and Africa (Saudi Arabia, UAE, and South Africa), and Rest of World (ROW)

Published: Mar 2026 289 Pages SKU: IRTNTR44823

Market Overview at a Glance

$818.5 B
Market Opportunity
13.4%
CAGR 2025 - 2030
35.2%
Europe Growth
$501.8 B
Domestic sports tourism segment 2024

Sports Tourism Market Size 2026-2030

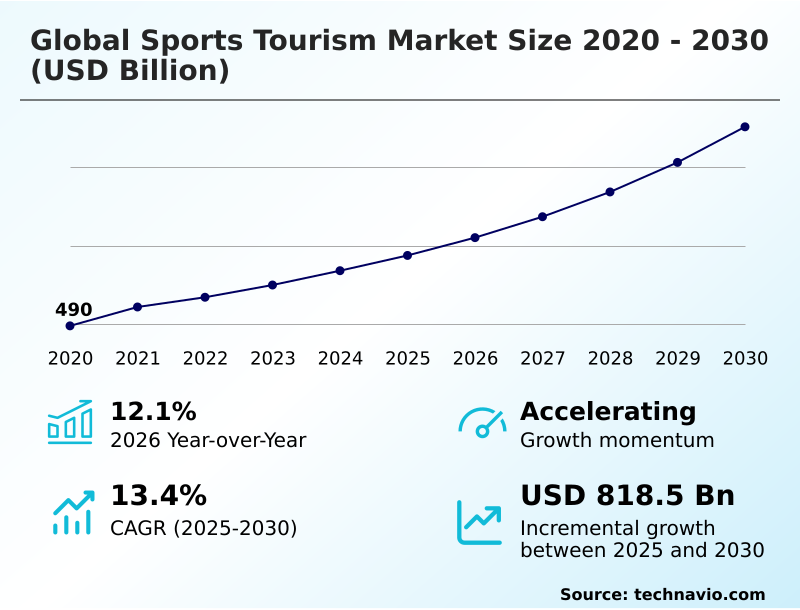
The sports tourism market size is valued to increase by USD 818.5 billion, at a CAGR of 13.4% from 2025 to 2030. Expansion of global mega-event calendars and metropolitan infrastructure investment will drive the sports tourism market.

Major Market Trends & Insights

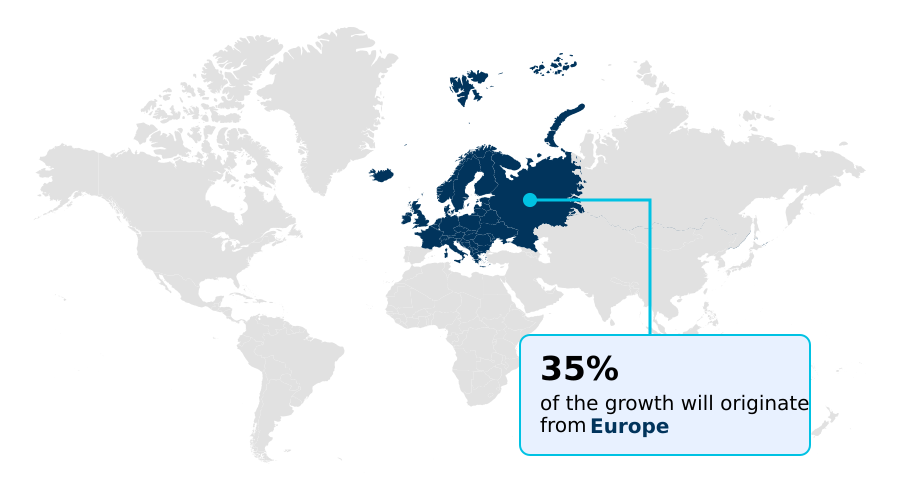
  • Europe dominated the market and accounted for a 35.2% growth during the forecast period.
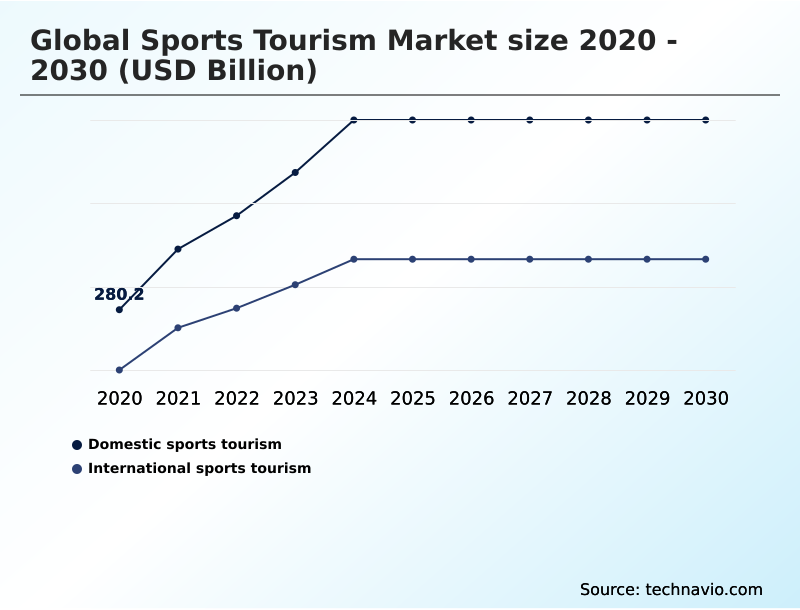
  • By Type - Domestic sports tourism segment was valued at USD 501.8 billion in 2024
  • By Product - Soccer tourism segment accounted for the largest market revenue share in 2024

Market Size & Forecast

  • Market Opportunities: USD 1266.6 billion
  • Market Future Opportunities: USD 818.5 billion
  • CAGR from 2025 to 2030 : 13.4%

Market Summary

  • The sports tourism market is a rapidly evolving sector characterized by the convergence of travel, entertainment, and technology. Growth is fueled by an increasing number of global sporting events and a rising consumer demand for experiential travel packages that go beyond simple spectating.
  • Key trends include the integration of digital fan identity systems for seamless venue access control and the push for sustainable travel solutions to meet environmental mandates. The market encompasses everything from mass-participation events to luxury sports packages for high-profile championships.
  • A significant challenge lies in managing the complex logistics and security for these events, which increasingly rely on real-time data analytics for crowd flow management. For instance, a host city's tourism authority might leverage anonymized data from fan engagement platforms to dynamically adjust public transport schedules and push localized retail promotions, improving the visitor experience while boosting ancillary revenue streams.
  • This approach, blending operational efficiency with hyper-personalized fan journeys, highlights the industry's shift towards data-driven destination management and the importance of a robust digital infrastructure, including advanced biometric recognition and secure payment systems, to support the entire fan journey.

What will be the Size of the Sports Tourism Market during the forecast period?

Get Key Insights on Market Forecast (PDF) Request Free Sample

How is the Sports Tourism Market Segmented?

The sports tourism industry research report provides comprehensive data (region-wise segment analysis), with forecasts and estimates in "USD billion" for the period 2026-2030, as well as historical data from 2020-2024 for the following segments.

  • Type
    • Domestic sports tourism
    • International sports tourism
  • Product
    • Soccer tourism
    • Cricket tourism
    • Tennis tourism
    • Others
  • Area
    • Passive sports tourism
    • Active sports tourism
  • Geography
    • Europe
      • Germany
      • UK
      • France
    • APAC
      • China
      • Japan
      • India
    • North America
      • US
      • Canada
      • Mexico
    • South America
      • Brazil
      • Argentina
    • Middle East and Africa
      • Saudi Arabia
      • UAE
      • South Africa
    • Rest of World (ROW)

By Type Insights

The domestic sports tourism segment is estimated to witness significant growth during the forecast period.

Domestic sports tourism represents a significant economic engine, driven by residents traveling within their own country for participatory sports events and to support national leagues.

This segment, crucial for regional economic development, is bolstered by destination branding initiatives and infrastructure investment planning focused on enhancing accessibility.

Growth is propelled by robust scholastic competitions and youth sports tournaments, which foster community engagement programs and grassroots talent development in sports. The appeal lies in lower travel friction and cost, attracting a broad demographic.

Targeted initiatives designed around sports heritage tours and major league schedules have proven effective, with some programs increasing regional travel intent by over 20% by creating holistic experiential travel packages.

This demonstrates a successful model for travel and hospitality integration at a national level.

Request Free Sample

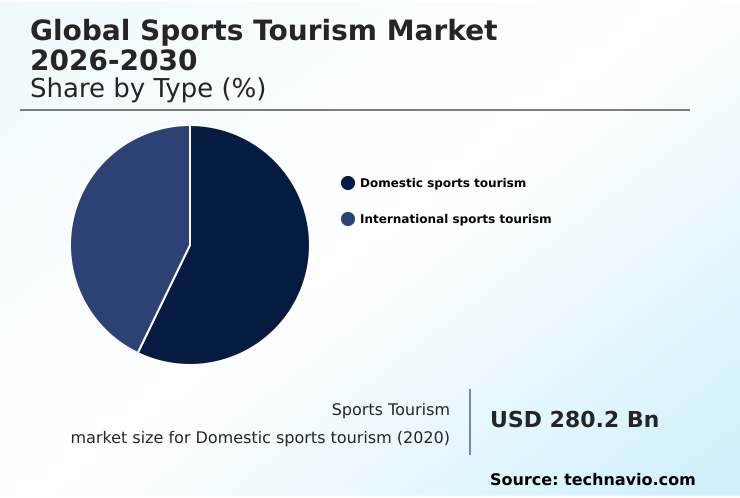
The Domestic sports tourism segment was valued at USD 501.8 billion in 2024 and showed a gradual increase during the forecast period.

Request Free Sample

Regional Analysis

Europe is estimated to contribute 35.2% to the growth of the global market during the forecast period.Technavio’s analysts have elaborately explained the regional trends and drivers that shape the market during the forecast period.

See How Sports Tourism Market Demand is Rising in Europe Request Free Sample

The geographic landscape is dynamic, with APAC exhibiting the fastest growth potential, outpacing Europe by nearly 1.5 percentage points annually, driven by government-led sports diplomacy initiatives.

North America remains a commercial powerhouse, distinguished by its mature leagues and high-value premium hospitality programs. In Europe, a focus on sustainability is paramount, with projects aiming to reduce fan transit times by 20% through integrated rail networks.

Emerging economies in the Middle East are investing heavily in smart stadium technology and e-sports tourism events, utilizing contactless payment solutions to enhance the fan experience.

This global competition fosters innovation in ticketing revenue models and requires acute tourism impact assessment for venue capacity optimization, sponsorship value analysis, and effective customer relationship management to ensure sustainable growth.

Market Dynamics

Our researchers analyzed the data with 2025 as the base year, along with the key drivers, trends, and challenges. A holistic analysis of drivers will help companies refine their marketing strategies to gain a competitive advantage.

  • Strategic analysis of the sports tourism market reveals several interconnected growth vectors. Understanding the economic impact of sports mega-events is crucial for national governments planning long-term infrastructure. A key focus is on the infrastructure requirements for hosting olympics, which sets a benchmark for urban development.
  • Concurrently, there is a strong push for sustainable travel solutions for fans, with an emphasis on environmental sustainability in sports venues. The digital transformation in fan experience is another critical area, where leveraging data for personalized fan journeys is paramount. This includes exploring the role of biometrics in stadium security to manage large crowds efficiently.
  • Firms offering luxury sports travel packages analysis find that high-net-worth individuals prioritize exclusivity and seamless logistics. The challenges in sports event logistics are being addressed through technology and better cross-border sports event collaboration.
  • A significant opportunity lies in the sports tourism market in emerging economies, where the growth of women's sports tourism is notable; marketing campaigns for these events show up to 30% higher digital engagement than traditional campaigns. The impact of esports on travel industry cannot be overstated, creating a new demographic of tech-savvy travelers.
  • Niche segments also show strong potential, with fan engagement strategies for soccer tourism evolving constantly. Analysis shows that revenue generation from tennis grand slams remains highly profitable, while cricket tourism trends in South Asia continue to drive significant travel volumes.
  • Finally, addressing cybersecurity threats in sports tourism and understanding corporate hospitality trends in motorsports are vital for specialized operators navigating the future of participatory sports events.

What are the key market drivers leading to the rise in the adoption of Sports Tourism Industry?

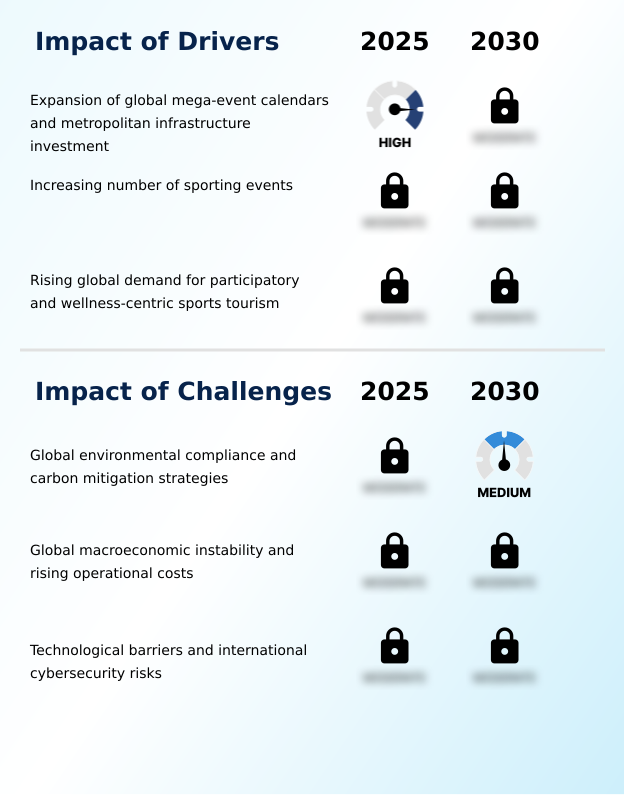
  • The expansion of global mega-event calendars, coupled with significant metropolitan infrastructure investment, is a key driver propelling market growth.

  • The expansion of global mega-event calendars is a primary driver, compelling significant infrastructure investment planning and spurring regional economic development.
  • These events create a surge in demand for corporate sports hospitality and official event travel packages, managed through sophisticated sports event logistics.
  • The rising global demand for wellness-centric tourism and active participation in mass-participation events like marathons has also become critical. These active tourists, who often travel for longer durations, increase the stability of revenue streams for hosts.
  • For example, destinations with certified active-tourism infrastructure report visitor-stay durations that are 25% longer than spectator-focused locations. Effective destination marketing strategies are now highlighting both spectator sports experiences and unique participatory opportunities, supported by strong brand partnership activation.

What are the market trends shaping the Sports Tourism Industry?

  • The integration of environmental sustainability and the development of green infrastructure represent a prominent upcoming trend. This shift is reshaping the market as stakeholders prioritize eco-friendly travel solutions.

  • A major trend is the shift toward ecological sustainability, with a focus on green stadium infrastructure and sustainable travel solutions. Host cities are now expected to provide comprehensive environmental impact reporting, a key factor in global mega-event bidding.
  • This has led to the development of high-speed rail corridors, reducing reliance on aviation and cutting transit-related carbon emissions by up to 30%. Concurrently, the digital transformation is creating hyper-personalized fan journeys through fan journey mapping and digital ecosystem development. This allows for customized ancillary revenue generation.
  • The proliferation of women’s athletic competitions, supported by inclusive tourism design, is also diversifying the market, showing a 40% higher family-demographic engagement in some emerging regions.

What challenges does the Sports Tourism Industry face during its growth?

  • Adherence to global environmental compliance standards and the implementation of effective carbon mitigation strategies present a key challenge to industry growth.

  • A formidable challenge is aligning mass international travel with stringent carbon mitigation strategies and regulatory policy adherence. The mandated use of sustainable aviation fuel, for instance, can increase operational costs for team travel logistics by over 15%, creating pricing pressure. Concurrently, the rapid digital transformation introduces significant risks related to cybersecurity in travel and data privacy compliance.
  • Implementing secure biometric security protocols and digital ticketing systems across varying international standards is complex and resource-intensive. A single data breach can compromise millions of user records, necessitating robust risk management for events and crisis communication planning. Furthermore, macroeconomic volatility impacts the entire supply chain for hospitality, affecting everything from operational costs to consumer spending power.

Exclusive Technavio Analysis on Customer Landscape

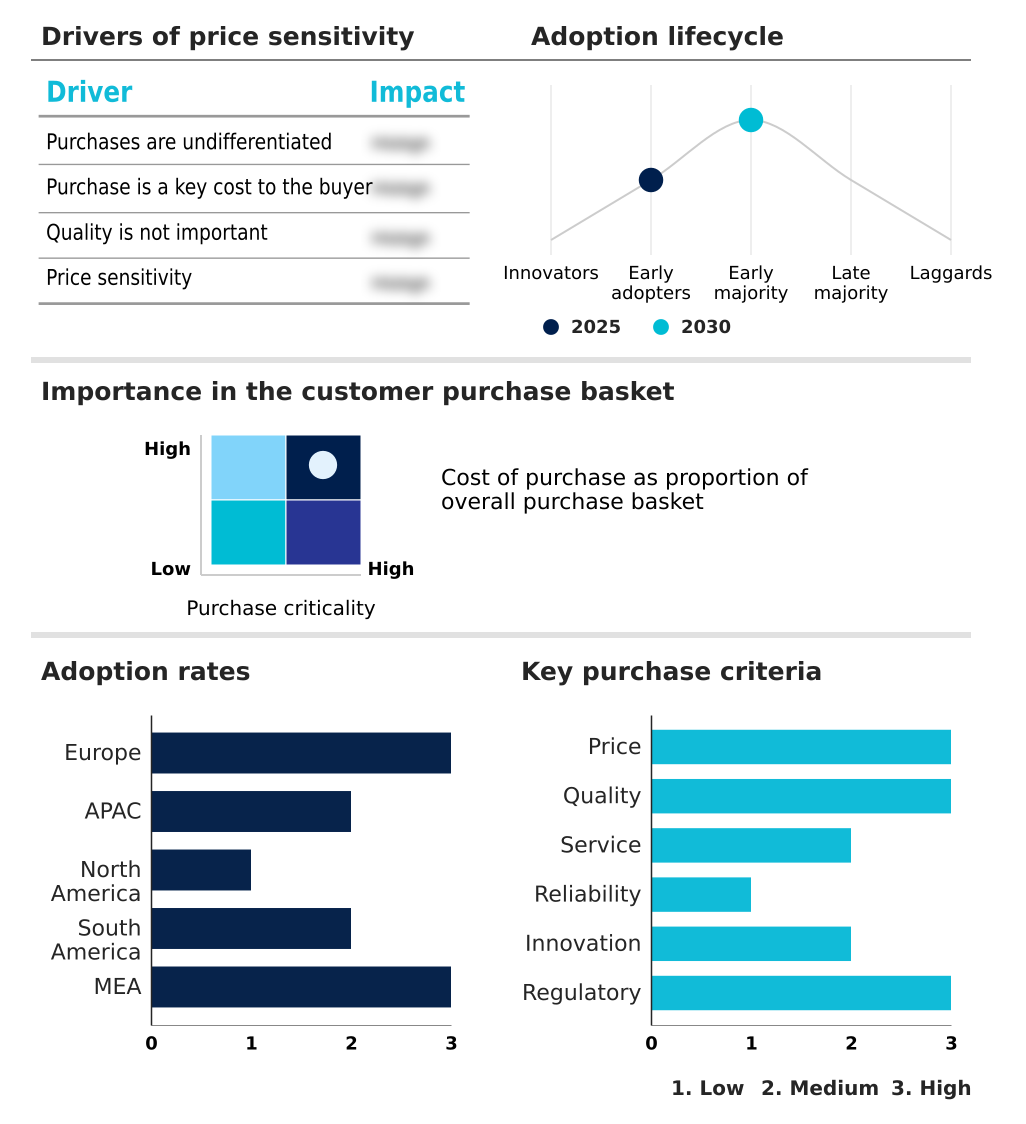
The sports tourism market forecasting report includes the adoption lifecycle of the market, covering from the innovator’s stage to the laggard’s stage. It focuses on adoption rates in different regions based on penetration. Furthermore, the sports tourism market report also includes key purchase criteria and drivers of price sensitivity to help companies evaluate and develop their market growth analysis strategies.

Customer Landscape of Sports Tourism Industry

Competitive Landscape

Companies are implementing various strategies, such as strategic alliances, sports tourism market forecast, partnerships, mergers and acquisitions, geographical expansion, and product/service launches, to enhance their presence in the industry.

ATPI Group - Delivers integrated corporate travel and MICE event logistics, specializing in complex team travel and corporate sports hospitality for global athletic delegations.

The industry research and growth report includes detailed analyses of the competitive landscape of the market and information about key companies, including:

  • ATPI Group
  • BAC Sports Ltd.
  • DTB Sports Management Ltd.
  • Expedia Group Inc.
  • Fanatic Sports Pvt. Ltd.
  • Gala Management Services Ltd.
  • Global Sports Experiences
  • Global Sports Travel Ltd.
  • ISM Inc.
  • ITC Travel Group
  • JTB India Pvt. Ltd.
  • Match Hospitality AG
  • Quint
  • Sporta Technologies Pvt. Ltd.
  • Sports Tours International Ltd.
  • Sportsnet Corp. Pty Ltd.
  • STH Group Ltd.
  • Thomas Cook India Ltd.
  • Victory Sports Tours

Qualitative and quantitative analysis of companies has been conducted to help clients understand the wider business environment as well as the strengths and weaknesses of key industry players. Data is qualitatively analyzed to categorize companies as pure play, category-focused, industry-focused, and diversified; it is quantitatively analyzed to categorize companies as dominant, leading, strong, tentative, and weak.

Recent Development and News in Sports tourism market

  • In August, 2025, the North American Hospitality Alliance, a consortium of major hotel chains and sports venues, introduced the Universal Fan Identity Protocol, which utilizes advanced biometric recognition to allow international travelers to check into hotels and access venues without physical documentation.
  • In May, 2025, the European Union Agency for Railways, in coordination with several continental athletic federations, launched the Green Stadium Connection project, establishing a dedicated high-speed rail corridor for spectators traveling between major tournament host cities in France, Germany, and the Netherlands.
  • In April, 2025, the Saudi Ministry of Tourism inaugurated the Riyadh Sports Aviation Hub, a specialized airport terminal expansion designed to manage a projected 30% increase in international fan arrivals for upcoming and future championships.
  • In April, 2025, the Ministry of Tourism in Brazil, in partnership with the Brazilian Football Confederation, launched the Rota da Paixao (Route of Passion) initiative to stimulate interstate travel by creating curated tourism packages centered around the national football league schedule.

Dive into Technavio’s robust research methodology, blending expert interviews, extensive data synthesis, and validated models for unparalleled Sports Tourism Market insights. See full methodology.

Market Scope
Page number 289
Base year 2025
Historic period 2020-2024
Forecast period 2026-2030
Growth momentum & CAGR Accelerate at a CAGR of 13.4%
Market growth 2026-2030 USD 818.5 billion
Market structure Fragmented
YoY growth 2025-2026(%) 12.1%
Key countries Germany, UK, France, Italy, Spain, The Netherlands, China, Japan, India, South Korea, Australia, Indonesia, US, Canada, Mexico, Brazil, Argentina, Chile, Saudi Arabia, UAE, South Africa, Israel and Turkey
Competitive landscape Leading Companies, Market Positioning of Companies, Competitive Strategies, and Industry Risks

Request Free Sample

Research Analyst Overview

  • The sports tourism market is defined by a strategic push towards creating holistic spectator sports experiences and immersive fan experiences. This involves deploying smart stadium technology, augmented reality stadium tours, and comprehensive fan engagement platforms to deepen connections with attendees. The operational backbone relies on sophisticated team travel logistics and biometric security protocols for secure venue access control.
  • At a boardroom level, the adoption of sustainable travel solutions and circular economy principles is no longer optional; it is integral to corporate ESG strategy and brand reputation, influencing decisions on everything from utilizing sustainable aviation fuel to implementing green stadium infrastructure.
  • The deployment of biometric recognition for digital ticketing systems and contactless payment solutions has demonstrably improved efficiency, reducing venue entry processing times by over 40% at major events. This drive for efficiency extends to offerings like participatory sports events, youth sports tournaments, and specialized sports heritage tours, all supported by dynamic pricing models.
  • Firms are also focused on developing official event travel packages, corporate sports hospitality, and luxury sports packages that generate significant ancillary revenue, with a growing interest in the burgeoning e-sports tourism and wellness-centric tourism segments, which are shaped by sports diplomacy initiatives and require advanced real-time data analytics for crowd flow management and delivery of premium hospitality programs.

What are the Key Data Covered in this Sports Tourism Market Research and Growth Report?

  • What is the expected growth of the Sports Tourism Market between 2026 and 2030?

    • USD 818.5 billion, at a CAGR of 13.4%

  • What segmentation does the market report cover?

    • The report is segmented by Type (Domestic sports tourism, and International sports tourism), Product (Soccer tourism, Cricket tourism, Tennis tourism, and Others), Area (Passive sports tourism, and Active sports tourism) and Geography (Europe, APAC, North America, South America, Middle East and Africa)

  • Which regions are analyzed in the report?

    • Europe, APAC, North America, South America and Middle East and Africa

  • What are the key growth drivers and market challenges?

    • Expansion of global mega-event calendars and metropolitan infrastructure investment, Global environmental compliance and carbon mitigation strategies

  • Who are the major players in the Sports Tourism Market?

    • ATPI Group, BAC Sports Ltd., DTB Sports Management Ltd., Expedia Group Inc., Fanatic Sports Pvt. Ltd., Gala Management Services Ltd., Global Sports Experiences, Global Sports Travel Ltd., ISM Inc., ITC Travel Group, JTB India Pvt. Ltd., Match Hospitality AG, Quint, Sporta Technologies Pvt. Ltd., Sports Tours International Ltd., Sportsnet Corp. Pty Ltd., STH Group Ltd., Thomas Cook India Ltd. and Victory Sports Tours

Market Research Insights

  • The dynamics of the sports tourism market are shaped by a strategic push toward enhancing the fan experience while navigating economic pressures. The adoption of integrated digital platforms for ticketing and hospitality has been shown to reduce entry friction at major venues by over 25%.
  • Concurrently, operators are implementing dynamic pricing models, which have helped increase ancillary revenues by up to 15% during peak demand periods. This balancing act requires sophisticated customer relationship management and robust brand partnership activation to maintain loyalty. As firms focus on destination marketing strategies, they must also manage complex sports event logistics and ensure data privacy compliance.
  • The market's resilience is tested by the need for continuous infrastructure investment planning, with successful outcomes depending on effective travel and hospitality integration and rigorous tourism impact assessment to justify expenditures and ensure sustainable, long-term regional economic development.

We can help! Our analysts can customize this sports tourism market research report to meet your requirements.

Get in touch

1. Executive Summary

1.1 Market overview

Executive Summary - Chart on Market Overview
Executive Summary - Data Table on Market Overview
Executive Summary - Chart on Global Market Characteristics
Executive Summary - Chart on Market by Geography
Executive Summary - Chart on Market Segmentation by Type
Executive Summary - Chart on Market Segmentation by Product
Executive Summary - Chart on Market Segmentation by Area
Executive Summary - Chart on Incremental Growth
Executive Summary - Data Table on Incremental Growth
Executive Summary - Chart on Company Market Positioning

2. Technavio Analysis

2.1 Analysis of price sensitivity, lifecycle, customer purchase basket, adoption rates, and purchase criteria

2.2 Criticality of inputs and Factors of differentiation

Chart on Overview on criticality of inputs and factors of differentiation

2.3 Factors of disruption

Chart on Overview on factors of disruption

2.4 Impact of drivers and challenges

Chart on Impact of drivers and challenges in 2025 and 2030

3. Market Landscape

3.1 Market ecosystem

Chart on Parent Market
Data Table on - Parent Market

3.2 Market characteristics

Chart on Market characteristics analysis

3.3 Value chain analysis

Chart on Value chain analysis

4. Market Sizing

4.1 Market definition

Data Table on Offerings of companies included in the market definition

4.2 Market segment analysis

Market segments

4.3 Market size 2025

4.4 Market outlook: Forecast for 2025-2030

Chart on Global - Market size and forecast 2025-2030 ($ billion)
Data Table on Global - Market size and forecast 2025-2030 ($ billion)
Chart on Global Market: Year-over-year growth 2025-2030 (%)
Data Table on Global Market: Year-over-year growth 2025-2030 (%)

5. Historic Market Size

5.1 Global Sports Tourism Market 2020 - 2024

Historic Market Size - Data Table on Global Sports Tourism Market 2020 - 2024 ($ billion)

5.2 Type segment analysis 2020 - 2024

Historic Market Size - Type Segment 2020 - 2024 ($ billion)

5.3 Product segment analysis 2020 - 2024

Historic Market Size - Product Segment 2020 - 2024 ($ billion)

5.4 Area segment analysis 2020 - 2024

Historic Market Size - Area Segment 2020 - 2024 ($ billion)

5.5 Geography segment analysis 2020 - 2024

Historic Market Size - Geography Segment 2020 - 2024 ($ billion)

5.6 Country segment analysis 2020 - 2024

Historic Market Size - Country Segment 2020 - 2024 ($ billion)

6. Qualitative Analysis

6.1 Impact of AI on Global Sports Tourism Market

7. Five Forces Analysis

7.1 Five forces summary

Five forces analysis - Comparison between 2025 and 2030

7.2 Bargaining power of buyers

Bargaining power of buyers - Impact of key factors 2025 and 2030

7.3 Bargaining power of suppliers

Bargaining power of suppliers - Impact of key factors in 2025 and 2030

7.4 Threat of new entrants

Threat of new entrants - Impact of key factors in 2025 and 2030

7.5 Threat of substitutes

Threat of substitutes - Impact of key factors in 2025 and 2030

7.6 Threat of rivalry

Threat of rivalry - Impact of key factors in 2025 and 2030

7.7 Market condition

Chart on Market condition - Five forces 2025 and 2030

8. Market Segmentation by Type

8.1 Market segments

Chart on Type - Market share 2025-2030 (%)
Data Table on Type - Market share 2025-2030 (%)

8.2 Comparison by Type

Chart on Comparison by Type
Data Table on Comparison by Type

8.3 Domestic sports tourism - Market size and forecast 2025-2030

Chart on Domestic sports tourism - Market size and forecast 2025-2030 ($ billion)
Data Table on Domestic sports tourism - Market size and forecast 2025-2030 ($ billion)
Chart on Domestic sports tourism - Year-over-year growth 2025-2030 (%)
Data Table on Domestic sports tourism - Year-over-year growth 2025-2030 (%)

8.4 International sports tourism - Market size and forecast 2025-2030

Chart on International sports tourism - Market size and forecast 2025-2030 ($ billion)
Data Table on International sports tourism - Market size and forecast 2025-2030 ($ billion)
Chart on International sports tourism - Year-over-year growth 2025-2030 (%)
Data Table on International sports tourism - Year-over-year growth 2025-2030 (%)

8.5 Market opportunity by Type

Market opportunity by Type ($ billion)
Data Table on Market opportunity by Type ($ billion)

9. Market Segmentation by Product

9.1 Market segments

Chart on Product - Market share 2025-2030 (%)
Data Table on Product - Market share 2025-2030 (%)

9.2 Comparison by Product

Chart on Comparison by Product
Data Table on Comparison by Product

9.3 Soccer tourism - Market size and forecast 2025-2030

Chart on Soccer tourism - Market size and forecast 2025-2030 ($ billion)
Data Table on Soccer tourism - Market size and forecast 2025-2030 ($ billion)
Chart on Soccer tourism - Year-over-year growth 2025-2030 (%)
Data Table on Soccer tourism - Year-over-year growth 2025-2030 (%)

9.4 Cricket tourism - Market size and forecast 2025-2030

Chart on Cricket tourism - Market size and forecast 2025-2030 ($ billion)
Data Table on Cricket tourism - Market size and forecast 2025-2030 ($ billion)
Chart on Cricket tourism - Year-over-year growth 2025-2030 (%)
Data Table on Cricket tourism - Year-over-year growth 2025-2030 (%)

9.5 Tennis tourism - Market size and forecast 2025-2030

Chart on Tennis tourism - Market size and forecast 2025-2030 ($ billion)
Data Table on Tennis tourism - Market size and forecast 2025-2030 ($ billion)
Chart on Tennis tourism - Year-over-year growth 2025-2030 (%)
Data Table on Tennis tourism - Year-over-year growth 2025-2030 (%)

9.6 Others - Market size and forecast 2025-2030

Chart on Others - Market size and forecast 2025-2030 ($ billion)
Data Table on Others - Market size and forecast 2025-2030 ($ billion)
Chart on Others - Year-over-year growth 2025-2030 (%)
Data Table on Others - Year-over-year growth 2025-2030 (%)

9.7 Market opportunity by Product

Market opportunity by Product ($ billion)
Data Table on Market opportunity by Product ($ billion)

10. Market Segmentation by Area

10.1 Market segments

Chart on Area - Market share 2025-2030 (%)
Data Table on Area - Market share 2025-2030 (%)

10.2 Comparison by Area

Chart on Comparison by Area
Data Table on Comparison by Area

10.3 Passive sports tourism - Market size and forecast 2025-2030

Chart on Passive sports tourism - Market size and forecast 2025-2030 ($ billion)
Data Table on Passive sports tourism - Market size and forecast 2025-2030 ($ billion)
Chart on Passive sports tourism - Year-over-year growth 2025-2030 (%)
Data Table on Passive sports tourism - Year-over-year growth 2025-2030 (%)

10.4 Active sports tourism - Market size and forecast 2025-2030

Chart on Active sports tourism - Market size and forecast 2025-2030 ($ billion)
Data Table on Active sports tourism - Market size and forecast 2025-2030 ($ billion)
Chart on Active sports tourism - Year-over-year growth 2025-2030 (%)
Data Table on Active sports tourism - Year-over-year growth 2025-2030 (%)

10.5 Market opportunity by Area

Market opportunity by Area ($ billion)
Data Table on Market opportunity by Area ($ billion)

11. Customer Landscape

11.1 Customer landscape overview

Analysis of price sensitivity, lifecycle, customer purchase basket, adoption rates, and purchase criteria

12. Geographic Landscape

12.1 Geographic segmentation

Chart on Market share by geography 2025-2030 (%)
Data Table on Market share by geography 2025-2030 (%)

12.2 Geographic comparison

Chart on Geographic comparison
Data Table on Geographic comparison

12.3 Europe - Market size and forecast 2025-2030

Chart on Europe - Market size and forecast 2025-2030 ($ billion)
Data Table on Europe - Market size and forecast 2025-2030 ($ billion)
Chart on Europe - Year-over-year growth 2025-2030 (%)
Data Table on Europe - Year-over-year growth 2025-2030 (%)
Chart on Regional Comparison - Europe
Data Table on Regional Comparison - Europe

12.3.1 Germany - Market size and forecast 2025-2030

Chart on Germany - Market size and forecast 2025-2030 ($ billion)
Data Table on Germany - Market size and forecast 2025-2030 ($ billion)
Chart on Germany - Year-over-year growth 2025-2030 (%)
Data Table on Germany - Year-over-year growth 2025-2030 (%)

12.3.2 UK - Market size and forecast 2025-2030

Chart on UK - Market size and forecast 2025-2030 ($ billion)
Data Table on UK - Market size and forecast 2025-2030 ($ billion)
Chart on UK - Year-over-year growth 2025-2030 (%)
Data Table on UK - Year-over-year growth 2025-2030 (%)

12.3.3 France - Market size and forecast 2025-2030

Chart on France - Market size and forecast 2025-2030 ($ billion)
Data Table on France - Market size and forecast 2025-2030 ($ billion)
Chart on France - Year-over-year growth 2025-2030 (%)
Data Table on France - Year-over-year growth 2025-2030 (%)

12.3.4 Italy - Market size and forecast 2025-2030

Chart on Italy - Market size and forecast 2025-2030 ($ billion)
Data Table on Italy - Market size and forecast 2025-2030 ($ billion)
Chart on Italy - Year-over-year growth 2025-2030 (%)
Data Table on Italy - Year-over-year growth 2025-2030 (%)

12.3.5 Spain - Market size and forecast 2025-2030

Chart on Spain - Market size and forecast 2025-2030 ($ billion)
Data Table on Spain - Market size and forecast 2025-2030 ($ billion)
Chart on Spain - Year-over-year growth 2025-2030 (%)
Data Table on Spain - Year-over-year growth 2025-2030 (%)

12.3.6 The Netherlands - Market size and forecast 2025-2030

Chart on The Netherlands - Market size and forecast 2025-2030 ($ billion)
Data Table on The Netherlands - Market size and forecast 2025-2030 ($ billion)
Chart on The Netherlands - Year-over-year growth 2025-2030 (%)
Data Table on The Netherlands - Year-over-year growth 2025-2030 (%)

12.4 APAC - Market size and forecast 2025-2030

Chart on APAC - Market size and forecast 2025-2030 ($ billion)
Data Table on APAC - Market size and forecast 2025-2030 ($ billion)
Chart on APAC - Year-over-year growth 2025-2030 (%)
Data Table on APAC - Year-over-year growth 2025-2030 (%)
Chart on Regional Comparison - APAC
Data Table on Regional Comparison - APAC

12.4.1 China - Market size and forecast 2025-2030

Chart on China - Market size and forecast 2025-2030 ($ billion)
Data Table on China - Market size and forecast 2025-2030 ($ billion)
Chart on China - Year-over-year growth 2025-2030 (%)
Data Table on China - Year-over-year growth 2025-2030 (%)

12.4.2 Japan - Market size and forecast 2025-2030

Chart on Japan - Market size and forecast 2025-2030 ($ billion)
Data Table on Japan - Market size and forecast 2025-2030 ($ billion)
Chart on Japan - Year-over-year growth 2025-2030 (%)
Data Table on Japan - Year-over-year growth 2025-2030 (%)

12.4.3 India - Market size and forecast 2025-2030

Chart on India - Market size and forecast 2025-2030 ($ billion)
Data Table on India - Market size and forecast 2025-2030 ($ billion)
Chart on India - Year-over-year growth 2025-2030 (%)
Data Table on India - Year-over-year growth 2025-2030 (%)

12.4.4 South Korea - Market size and forecast 2025-2030

Chart on South Korea - Market size and forecast 2025-2030 ($ billion)
Data Table on South Korea - Market size and forecast 2025-2030 ($ billion)
Chart on South Korea - Year-over-year growth 2025-2030 (%)
Data Table on South Korea - Year-over-year growth 2025-2030 (%)

12.4.5 Australia - Market size and forecast 2025-2030

Chart on Australia - Market size and forecast 2025-2030 ($ billion)
Data Table on Australia - Market size and forecast 2025-2030 ($ billion)
Chart on Australia - Year-over-year growth 2025-2030 (%)
Data Table on Australia - Year-over-year growth 2025-2030 (%)

12.4.6 Indonesia - Market size and forecast 2025-2030

Chart on Indonesia - Market size and forecast 2025-2030 ($ billion)
Data Table on Indonesia - Market size and forecast 2025-2030 ($ billion)
Chart on Indonesia - Year-over-year growth 2025-2030 (%)
Data Table on Indonesia - Year-over-year growth 2025-2030 (%)

12.5 North America - Market size and forecast 2025-2030

Chart on North America - Market size and forecast 2025-2030 ($ billion)
Data Table on North America - Market size and forecast 2025-2030 ($ billion)
Chart on North America - Year-over-year growth 2025-2030 (%)
Data Table on North America - Year-over-year growth 2025-2030 (%)
Chart on Regional Comparison - North America
Data Table on Regional Comparison - North America

12.5.1 US - Market size and forecast 2025-2030

Chart on US - Market size and forecast 2025-2030 ($ billion)
Data Table on US - Market size and forecast 2025-2030 ($ billion)
Chart on US - Year-over-year growth 2025-2030 (%)
Data Table on US - Year-over-year growth 2025-2030 (%)

12.5.2 Canada - Market size and forecast 2025-2030

Chart on Canada - Market size and forecast 2025-2030 ($ billion)
Data Table on Canada - Market size and forecast 2025-2030 ($ billion)
Chart on Canada - Year-over-year growth 2025-2030 (%)
Data Table on Canada - Year-over-year growth 2025-2030 (%)

12.5.3 Mexico - Market size and forecast 2025-2030

Chart on Mexico - Market size and forecast 2025-2030 ($ billion)
Data Table on Mexico - Market size and forecast 2025-2030 ($ billion)
Chart on Mexico - Year-over-year growth 2025-2030 (%)
Data Table on Mexico - Year-over-year growth 2025-2030 (%)

12.6 South America - Market size and forecast 2025-2030

Chart on South America - Market size and forecast 2025-2030 ($ billion)
Data Table on South America - Market size and forecast 2025-2030 ($ billion)
Chart on South America - Year-over-year growth 2025-2030 (%)
Data Table on South America - Year-over-year growth 2025-2030 (%)
Chart on Regional Comparison - South America
Data Table on Regional Comparison - South America

12.6.1 Brazil - Market size and forecast 2025-2030

Chart on Brazil - Market size and forecast 2025-2030 ($ billion)
Data Table on Brazil - Market size and forecast 2025-2030 ($ billion)
Chart on Brazil - Year-over-year growth 2025-2030 (%)
Data Table on Brazil - Year-over-year growth 2025-2030 (%)

12.6.2 Argentina - Market size and forecast 2025-2030

Chart on Argentina - Market size and forecast 2025-2030 ($ billion)
Data Table on Argentina - Market size and forecast 2025-2030 ($ billion)
Chart on Argentina - Year-over-year growth 2025-2030 (%)
Data Table on Argentina - Year-over-year growth 2025-2030 (%)

12.6.3 Chile - Market size and forecast 2025-2030

Chart on Chile - Market size and forecast 2025-2030 ($ billion)
Data Table on Chile - Market size and forecast 2025-2030 ($ billion)
Chart on Chile - Year-over-year growth 2025-2030 (%)
Data Table on Chile - Year-over-year growth 2025-2030 (%)

12.7 Middle East and Africa - Market size and forecast 2025-2030

Chart on Middle East and Africa - Market size and forecast 2025-2030 ($ billion)
Data Table on Middle East and Africa - Market size and forecast 2025-2030 ($ billion)
Chart on Middle East and Africa - Year-over-year growth 2025-2030 (%)
Data Table on Middle East and Africa - Year-over-year growth 2025-2030 (%)
Chart on Regional Comparison - Middle East and Africa
Data Table on Regional Comparison - Middle East and Africa

12.7.1 Saudi Arabia - Market size and forecast 2025-2030

Chart on Saudi Arabia - Market size and forecast 2025-2030 ($ billion)
Data Table on Saudi Arabia - Market size and forecast 2025-2030 ($ billion)
Chart on Saudi Arabia - Year-over-year growth 2025-2030 (%)
Data Table on Saudi Arabia - Year-over-year growth 2025-2030 (%)

12.7.2 UAE - Market size and forecast 2025-2030

Chart on UAE - Market size and forecast 2025-2030 ($ billion)
Data Table on UAE - Market size and forecast 2025-2030 ($ billion)
Chart on UAE - Year-over-year growth 2025-2030 (%)
Data Table on UAE - Year-over-year growth 2025-2030 (%)

12.7.3 South Africa - Market size and forecast 2025-2030

Chart on South Africa - Market size and forecast 2025-2030 ($ billion)
Data Table on South Africa - Market size and forecast 2025-2030 ($ billion)
Chart on South Africa - Year-over-year growth 2025-2030 (%)
Data Table on South Africa - Year-over-year growth 2025-2030 (%)

12.7.4 Israel - Market size and forecast 2025-2030

Chart on Israel - Market size and forecast 2025-2030 ($ billion)
Data Table on Israel - Market size and forecast 2025-2030 ($ billion)
Chart on Israel - Year-over-year growth 2025-2030 (%)
Data Table on Israel - Year-over-year growth 2025-2030 (%)

12.7.5 Turkey - Market size and forecast 2025-2030

Chart on Turkey - Market size and forecast 2025-2030 ($ billion)
Data Table on Turkey - Market size and forecast 2025-2030 ($ billion)
Chart on Turkey - Year-over-year growth 2025-2030 (%)
Data Table on Turkey - Year-over-year growth 2025-2030 (%)

12.8 Market opportunity by geography

Market opportunity by geography ($ billion)
Data Tables on Market opportunity by geography ($ billion)

13. Drivers, Challenges, and Opportunity

13.1 Market drivers

Expansion of global mega-event calendars and metropolitan infrastructure investment
Increasing number of sporting events
Rising global demand for participatory and wellness-centric sports tourism

13.2 Market challenges

Global environmental compliance and carbon mitigation strategies
Global macroeconomic instability and rising operational costs
Technological barriers and international cybersecurity risks

13.3 Impact of drivers and challenges

Impact of drivers and challenges in 2025 and 2030

13.4 Market opportunities

Integration of environmental sustainability and green infrastructure
Digital transformation and implementation of hyper-personalized fan journeys
Proliferation of women athletic competitions and emerging market diversification

14. Competitive Landscape

14.1 Overview

14.2

Overview on criticality of inputs and factors of differentiation

14.3 Landscape disruption

Overview on factors of disruption

14.4 Industry risks

Impact of key risks on business

15. Competitive Analysis

15.1 Companies profiled

Companies covered

15.2 Company ranking index

15.3 Market positioning of companies

Matrix on companies position and classification

15.4 ATPI Group

ATPI Group - Overview
ATPI Group - Product / Service
ATPI Group - Key offerings
SWOT

15.5 BAC Sports Ltd.

BAC Sports Ltd. - Overview
BAC Sports Ltd. - Product / Service
BAC Sports Ltd. - Key offerings
SWOT

15.6 DTB Sports Management Ltd.

DTB Sports Management Ltd. - Overview
DTB Sports Management Ltd. - Product / Service
DTB Sports Management Ltd. - Key offerings
SWOT

15.7 Expedia Group Inc.

Expedia Group Inc. - Overview
Expedia Group Inc. - Business segments
Expedia Group Inc. - Key offerings
Expedia Group Inc. - Segment focus
SWOT

15.8 Fanatic Sports Pvt. Ltd.

Fanatic Sports Pvt. Ltd. - Overview
Fanatic Sports Pvt. Ltd. - Product / Service
Fanatic Sports Pvt. Ltd. - Key offerings
SWOT

15.9 Gala Management Services Ltd.

Gala Management Services Ltd. - Overview
Gala Management Services Ltd. - Product / Service
Gala Management Services Ltd. - Key offerings
SWOT

15.10 Global Sports Experiences

Global Sports Experiences - Overview
Global Sports Experiences - Product / Service
Global Sports Experiences - Key offerings
SWOT

15.11 Global Sports Travel Ltd.

Global Sports Travel Ltd. - Overview
Global Sports Travel Ltd. - Product / Service
Global Sports Travel Ltd. - Key offerings
SWOT

15.12 ISM Inc.

ISM Inc. - Overview
ISM Inc. - Product / Service
ISM Inc. - Key offerings
SWOT

15.13 ITC Travel Group

ITC Travel Group - Overview
ITC Travel Group - Product / Service
ITC Travel Group - Key offerings
SWOT

15.14 JTB India Pvt. Ltd.

JTB India Pvt. Ltd. - Overview
JTB India Pvt. Ltd. - Product / Service
JTB India Pvt. Ltd. - Key offerings
SWOT

15.15 Match Hospitality AG

Match Hospitality AG - Overview
Match Hospitality AG - Product / Service
Match Hospitality AG - Key offerings
SWOT

15.16 Quint

Quint - Overview
Quint - Product / Service
Quint - Key offerings
SWOT

15.17 Sports Tours International Ltd.

Sports Tours International Ltd. - Overview
Sports Tours International Ltd. - Product / Service
Sports Tours International Ltd. - Key offerings
SWOT

15.18 Thomas Cook India Ltd.

Thomas Cook India Ltd. - Overview
Thomas Cook India Ltd. - Business segments
Thomas Cook India Ltd. - Key offerings
Thomas Cook India Ltd. - Segment focus
SWOT

16. Appendix

16.1 Scope of the report

Market definition
Objectives
Notes and caveats

16.2 Inclusions and exclusions checklist

Inclusions checklist
Exclusions checklist

16.3 Currency conversion rates for US$

16.4 Research methodology

16.5 Data procurement

Information sources

16.6 Data validation

16.7 Validation techniques employed for market sizing

16.8 Data synthesis

16.9 360 degree market analysis

16.10 List of abbreviations

Research Methodology

Technavio presents a detailed picture of the market by way of study, synthesis, and summation of data from multiple sources. The analysts have presented the various facets of the market with a particular focus on identifying the key industry influencers. The data thus presented is comprehensive, reliable, and the result of extensive research, both primary and secondary.

INFORMATION SOURCES

Primary sources

  • Manufacturers and suppliers
  • Channel partners
  • Industry experts
  • Strategic decision makers

Secondary sources

  • Industry journals and periodicals
  • Government data
  • Financial reports of key industry players
  • Historical data
  • Press releases

DATA ANALYSIS

Data Synthesis

  • Collation of data
  • Estimation of key figures
  • Analysis of derived insights

Data Validation

  • Triangulation with data models
  • Reference against proprietary databases
  • Corroboration with industry experts

REPORT WRITING

Qualitative

  • Market drivers
  • Market challenges
  • Market trends
  • Five forces analysis

Quantitative

  • Market size and forecast
  • Market segmentation
  • Geographical insights
  • Competitive landscape

Interested in this report?

Get your sample now to see our research methodology and insights!

Download Now

Frequently Asked Questions

Sports Tourism market growth will increase by USD 818.5 billion during 2026-2030.

The Sports Tourism market is expected to grow at a CAGR of 13.4% during 2026-2030.

Sports Tourism market is segmented by Type (Domestic sports tourism, International sports tourism) Product (Soccer tourism, Cricket tourism, Tennis tourism, Others) Area (Passive sports tourism, Active sports tourism)

ATPI Group, BAC Sports Ltd., DTB Sports Management Ltd., Expedia Group Inc., Fanatic Sports Pvt. Ltd., Gala Management Services Ltd., Global Sports Experiences, Global Sports Travel Ltd., ISM Inc., ITC Travel Group, JTB India Pvt. Ltd., Match Hospitality AG, Quint, Sporta Technologies Pvt. Ltd., Sports Tours International Ltd., Sportsnet Corp. Pty Ltd., STH Group Ltd., Thomas Cook India Ltd., Victory Sports Tours are a few of the key vendors in the Sports Tourism market.

Europe will register the highest growth rate of 35.2% among the other regions. Therefore, the Sports Tourism market in Europe is expected to garner significant business opportunities for the vendors during the forecast period.

Germany, UK, France, Italy, Spain, The Netherlands, China, Japan, India, South Korea, Australia, Indonesia, US, Canada, Mexico, Brazil, Argentina, Chile, Saudi Arabia, UAE, South Africa, Israel, Turkey

  • Expansion of global mega-event calendars and metropolitan infrastructure investment is the driving factor this market.

The Sports Tourism market vendors should focus on grabbing business opportunities from the Type segment as it accounted for the largest market share in the base year.
RIA - Research AI Assistant
Ask RIA