Linerless Labels Market Analysis APAC, Europe, North America, South America, Middle East and Africa - US, China, Japan, UK, Germany - Size and Forecast 2023-2027
| Published: Oct 2023 | Pages: 173 | SKU: IRTNTR45476 |
Linerless Labels Market by Type, Product Type and Geography - Forecast 2023-2027
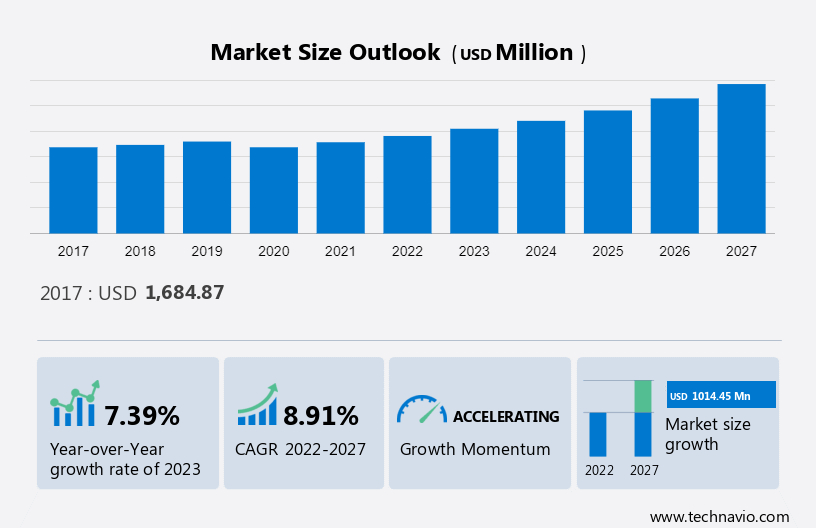
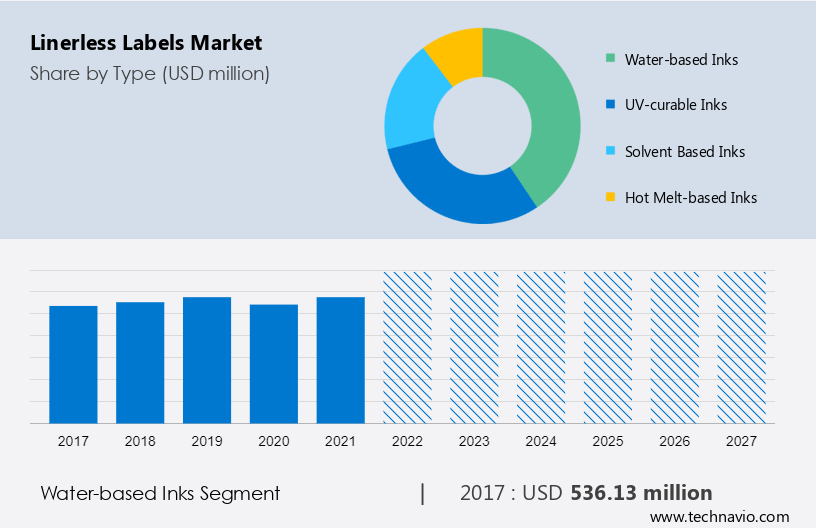
The linerless labels market size is forecast to increase by USD 1014.45 million between 2022 and 2027, accelerating at a CAGR of 8.91%. In 2017 China held the largest market share, projecting an annual revenue of USD 206.5 million .The report includes a comprehensive outlook on the Linerless Labels Market , offering forecasts for the industry segmented by Type, which comprises Water-based inks, UV-curable inks, Solvent-based inks, and Hot melt-based ink. Additionally, it categorizes Product Type into Food and beverages, Retail, Personal care, Pharmaceuticals, and Textiles and others and covers Geography regions, including APAC, Europe, North America, South America, and Middle East and Africa. The report provides market size, historical data spanning from 2017 to 2021, and future projections, all presented in terms of value in (USD million) for each of the mentioned segments.
What will be the Size of the Linerless Labels Market During the Forecast Period?
To learn more about this report, Download Report Sample
Linerless Labels Market Analysis
One of the key factors driving the linerless labels market growth is the rising awareness of sustainability. There is an increasing preference among consumers for companies that are committed to positive social and environmental impact. As a result, it has become essential for companies to adopt strategies that minimize their carbon footprint.
Moreover, there is an increasing adoption of linerless labels as it does not have any liners which in turn is reducing the wastage of paper thereby preventing the cluttering of landfills. Furthermore, the transportation cost is significantly reduced due to the reduction in weight, thereby enabling a larger number of linerless labels to be transported in a single trip. Hence, such factors are expected to drive market growth during the forecast period.
Linerless Labels Market Segment Trends
Water-Based Inks is the Leading Segment to Dominate the Market
The water-based inks segment is estimated to witness significant growth during the forecast period and was valued at USD 536.13 million in 2017. The water-based inks segment mainly comprises acrylic resins or hybrid polyurethane-acrylic resin mixtures. The main advantage of the water-based ink segment is that it penetrates more deeply than plastisol and always offers a softer print. Additionally, this segment is a more eco-friendly choice due to the absence of a base of plastic.
Additionally, there is an increasing adoption of the water-based ink segment among lineless label manufacturers as it is considered the most sustainable option for printing. The main advantage of this segment is that it removes any fire risks and enables businesses to place a higher priority on employee safety, as they are significantly less toxic and volatile than solvent-based inks. Therefore, less cost is associated with the maintenance of these equipment as well as the machinery needed to handle these inks. Hence, such factors are expected to fuel the growth of this segment which in turn will drive the market growth during the forecast period.
Linerless Labels Market - Revenue Share by Type Segment, 2017 - 2021 - 2027.
For more details on other segments, Download Sample Report
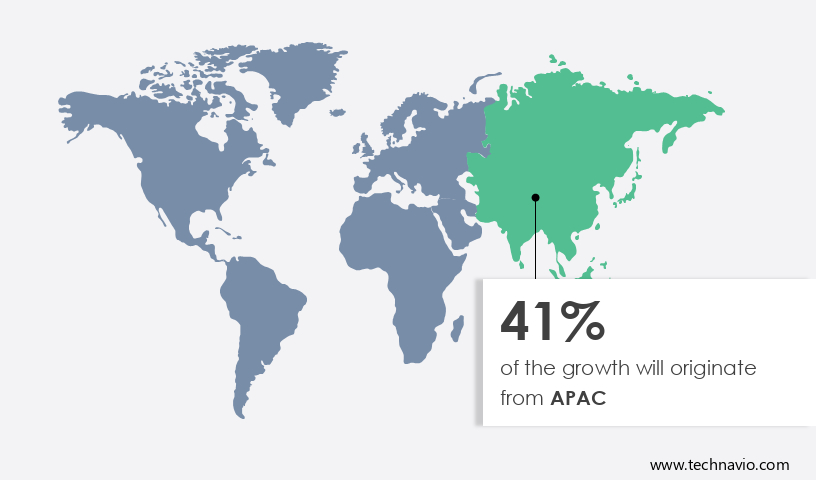
APAC Holds a Prominent Position in the Linerless Labels Market
APAC is estimated to contribute 41% to the growth of the global market during the forecast period. Technavio’s analysts have elaborately explained the regional trends and drivers that shape the market during the forecast period. One of the main factors that are significantly contributing to the growth of the global labels market in APAC is its increasing adoption across various sectors in the region including the retail, consumer durables, and food and beverage sectors. Some of the key countries which have a significant potential for growth in APAC include India and China. Factors such as the changes in lifestyle as well as food habits in the middle-class population in emerging economies are fuelling the demand for packaged food and beverages which is positively impacting the market.
Additionally, the increase in e-commerce platforms fuelled by the growing number of Internet and smartphone users, and the rising trend of online shopping is significantly contributing to the market growth as labeling is an essential aspect of the e-commerce industry, such that products need to be labeled properly during transportation. Hence, such factors are expected to drive market growth in APAC during the forecast period.
Linerless Labels Market Size, By Region, Global, 2017 - 2021 - 2027.
To understand geographic trends Download Report Sample
Linerless Labels Market Companies Overview
The Linerless Labels Market is fragmented in nature. Some significant players include 3M Co and Avery Dennison Corp.
The research report also includes detailed analyses of the competitive landscape of the market and information about 15 market companies, including:
General Data Co. Inc., Gipako UAB, Henkel AG and Co. KGaA, Hub Labels Inc., LINTEC Corp., Multi Color Corp., NAStar Inc., Nordvalls Etikett AB, Optimum Group, ProPrint Group, Ravenwood Packaging Ltd., Reflex Labels Ltd., RR Donnelley and Sons Co., SATO Corp., Skanem AS, Torraspapel S.A., CCL Industries Inc., and Coveris Management GmbH
Segment Overview
The linerless labels market report forecasts market growth by revenue at global, regional & country levels and provides an analysis of the latest trends and growth opportunities from 2017 - 2027.
- Type Outlook (USD Million, 2017 - 2027)
- Water-based inks
- UV-curable inks
- Solvent-based inks
- Hot melt-based inks
- Product Type Outlook (USD Million, 2017 - 2027)
- Food and beverages
- Retail
- Personal care
- Pharmaceuticals
- Textiles and others
- Geography Outlook (USD Million, 2017 - 2027)
- North America
- The U.S.
- Canada
- Europe
- U.K.
- Germany
- France
- Rest of Europe
- APAC
- China
- India
- South America
- Chile
- Argentina
- Brazil
- Middle East & Africa
- Saudi Arabia
- South Africa
- Rest of the Middle East & Africa
- North America
|
Linerless Labels Market Scope |
|
|
Report Coverage |
Details |
|
Page number |
173 |
|
Base year |
2022 |
|
Historic period |
2017 - 2021 |
|
Forecast period |
2023-2027 |
|
Growth momentum & CAGR |
Accelerate at a CAGR of 8.91% |
|
Market growth 2023-2027 |
USD 1014.45 million |
|
Market structure |
Fragmented |
|
YoY growth 2022-2023(%) |
7.39 |
|
Regional analysis |
APAC, Europe, North America, South America, and Middle East and Africa |
|
Performing market contribution |
APAC at 41% |
|
Key countries |
US, China, Japan, UK, and Germany |
|
Competitive landscape |
Leading Companies, Market Positioning of Companies, Competitive Strategies, and Industry Risks |
|
Key companies profiled |
3M Co., Avery Dennison Corp., General Data Co. Inc., Gipako UAB, Henkel AG and Co. KGaA, Hub Labels Inc., LINTEC Corp., Multi Color Corp., NAStar Inc., Nordvalls Etikett AB, Optimum Group, ProPrint Group, Ravenwood Packaging Ltd., Reflex Labels Ltd., RR Donnelley and Sons Co., SATO Corp., Skanem AS, Torraspapel S.A., CCL Industries Inc., and Coveris Management GmbH |
|
Market dynamics |
Parent market analysis, Market growth inducers and obstacles, Fast-growing and slow-growing segment analysis, COVID 19 impact and recovery analysis and future consumer dynamics, Market condition analysis for forecast period |
|
Customization purview |
If our report has not included the data that you are looking for, you can reach out to our analysts and get segments customized. |
What are the Key Data Covered in this Linerless Labels Market Research Report?
- CAGR of the market during the forecast period
- Detailed information on factors that will drive the growth of the market between 2023 and 2027
- Precise estimation of the size of the market size and its contribution of the market in focus to the parent market
- Accurate predictions about upcoming trends and changes in consumer behaviour
- Growth of the market industry across APAC, Europe, North America, South America, and Middle East and Africa
- Thorough analysis of the market’s competitive landscape and detailed information about companies
- Comprehensive analysis of factors that will challenge the growth of market companies
We can help! Our analysts can customize this market research report to meet your requirements.
1 Executive Summary
- 1.1 Market overview
- Exhibit 01: Executive Summary – Chart on Market Overview
- Exhibit 02: Executive Summary – Data Table on Market Overview
- Exhibit 03: Executive Summary – Chart on Global Market Characteristics
- Exhibit 04: Executive Summary – Chart on Market by Geography
- Exhibit 05: Executive Summary – Chart on Market Segmentation by Type
- Exhibit 06: Executive Summary – Chart on Market Segmentation by Product Type
- Exhibit 07: Executive Summary – Chart on Incremental Growth
- Exhibit 08: Executive Summary – Data Table on Incremental Growth
- Exhibit 09: Executive Summary – Chart on Vendor Market Positioning
2 Market Landscape
- 2.1 Market ecosystem
- Exhibit 10: Parent market
- Exhibit 11: Market Characteristics
3 Market Sizing
- 3.1 Market definition
- Exhibit 12: Offerings of vendors included in the market definition
- 3.2 Market segment analysis
- Exhibit 13: Market segments
- 3.3 Market size 2022
- 3.4 Market outlook: Forecast for 2022-2027
- Exhibit 14: Chart on Global - Market size and forecast 2022-2027 ($ million)
- Exhibit 15: Data Table on Global - Market size and forecast 2022-2027 ($ million)
- Exhibit 16: Chart on Global Market: Year-over-year growth 2022-2027 (%)
- Exhibit 17: Data Table on Global Market: Year-over-year growth 2022-2027 (%)
4 Historic Market Size
- 4.1 Global linerless labels market 2017 - 2021
- Exhibit 18: Historic Market Size – Data Table on global linerless labels market 2017 - 2021 ($ million)
- 4.2 Type Segment Analysis 2017 - 2021
- Exhibit 19: Historic Market Size – Type Segment 2017 - 2021 ($ million)
- 4.3 Product type Segment Analysis 2017 - 2021
- Exhibit 20: Historic Market Size – Product type Segment 2017 - 2021 ($ million)
- 4.4 Geography Segment Analysis 2017 - 2021
- Exhibit 21: Historic Market Size – Geography Segment 2017 - 2021 ($ million)
- 4.5 Country Segment Analysis 2017 - 2021
- Exhibit 22: Historic Market Size – Country Segment 2017 - 2021 ($ million)
5 Five Forces Analysis
- 5.1 Five forces summary
- Exhibit 23: Five forces analysis - Comparison between 2022 and 2027
- 5.2 Bargaining power of buyers
- Exhibit 24: Chart on Bargaining power of buyers – Impact of key factors 2022 and 2027
- 5.3 Bargaining power of suppliers
- Exhibit 25: Bargaining power of suppliers – Impact of key factors in 2022 and 2027
- 5.4 Threat of new entrants
- Exhibit 26: Threat of new entrants – Impact of key factors in 2022 and 2027
- 5.5 Threat of substitutes
- Exhibit 27: Threat of substitutes – Impact of key factors in 2022 and 2027
- 5.6 Threat of rivalry
- Exhibit 28: Threat of rivalry – Impact of key factors in 2022 and 2027
- 5.7 Market condition
- Exhibit 29: Chart on Market condition - Five forces 2022 and 2027
6 Market Segmentation by Type
- 6.1 Market segments
- Exhibit 30: Chart on Type - Market share 2022-2027 (%)
- Exhibit 31: Data Table on Type - Market share 2022-2027 (%)
- 6.2 Comparison by Type
- Exhibit 32: Chart on Comparison by Type
- Exhibit 33: Data Table on Comparison by Type
- 6.3 Water-based inks - Market size and forecast 2022-2027
- Exhibit 34: Chart on Water-based inks - Market size and forecast 2022-2027 ($ million)
- Exhibit 35: Data Table on Water-based inks - Market size and forecast 2022-2027 ($ million)
- Exhibit 36: Chart on Water-based inks - Year-over-year growth 2022-2027 (%)
- Exhibit 37: Data Table on Water-based inks - Year-over-year growth 2022-2027 (%)
- 6.4 UV-curable inks - Market size and forecast 2022-2027
- Exhibit 38: Chart on UV-curable inks - Market size and forecast 2022-2027 ($ million)
- Exhibit 39: Data Table on UV-curable inks - Market size and forecast 2022-2027 ($ million)
- Exhibit 40: Chart on UV-curable inks - Year-over-year growth 2022-2027 (%)
- Exhibit 41: Data Table on UV-curable inks - Year-over-year growth 2022-2027 (%)
- 6.5 Solvent based inks - Market size and forecast 2022-2027
- Exhibit 42: Chart on Solvent based inks - Market size and forecast 2022-2027 ($ million)
- Exhibit 43: Data Table on Solvent based inks - Market size and forecast 2022-2027 ($ million)
- Exhibit 44: Chart on Solvent based inks - Year-over-year growth 2022-2027 (%)
- Exhibit 45: Data Table on Solvent based inks - Year-over-year growth 2022-2027 (%)
- 6.6 Hot melt-based inks - Market size and forecast 2022-2027
- Exhibit 46: Chart on Hot melt-based inks - Market size and forecast 2022-2027 ($ million)
- Exhibit 47: Data Table on Hot melt-based inks - Market size and forecast 2022-2027 ($ million)
- Exhibit 48: Chart on Hot melt-based inks - Year-over-year growth 2022-2027 (%)
- Exhibit 49: Data Table on Hot melt-based inks - Year-over-year growth 2022-2027 (%)
- 6.7 Market opportunity by Type
- Exhibit 50: Market opportunity by Type ($ million)
- Exhibit 51: Data Table on Market opportunity by Type ($ million)
7 Market Segmentation by Product Type
- 7.1 Market segments
- Exhibit 52: Chart on Product Type - Market share 2022-2027 (%)
- Exhibit 53: Data Table on Product Type - Market share 2022-2027 (%)
- 7.2 Comparison by Product Type
- Exhibit 54: Chart on Comparison by Product Type
- Exhibit 55: Data Table on Comparison by Product Type
- 7.3 Food and beverages - Market size and forecast 2022-2027
- Exhibit 56: Chart on Food and beverages - Market size and forecast 2022-2027 ($ million)
- Exhibit 57: Data Table on Food and beverages - Market size and forecast 2022-2027 ($ million)
- Exhibit 58: Chart on Food and beverages - Year-over-year growth 2022-2027 (%)
- Exhibit 59: Data Table on Food and beverages - Year-over-year growth 2022-2027 (%)
- 7.4 Retail - Market size and forecast 2022-2027
- Exhibit 60: Chart on Retail - Market size and forecast 2022-2027 ($ million)
- Exhibit 61: Data Table on Retail - Market size and forecast 2022-2027 ($ million)
- Exhibit 62: Chart on Retail - Year-over-year growth 2022-2027 (%)
- Exhibit 63: Data Table on Retail - Year-over-year growth 2022-2027 (%)
- 7.5 Personal care - Market size and forecast 2022-2027
- Exhibit 64: Chart on Personal care - Market size and forecast 2022-2027 ($ million)
- Exhibit 65: Data Table on Personal care - Market size and forecast 2022-2027 ($ million)
- Exhibit 66: Chart on Personal care - Year-over-year growth 2022-2027 (%)
- Exhibit 67: Data Table on Personal care - Year-over-year growth 2022-2027 (%)
- 7.6 Pharmaceuticals - Market size and forecast 2022-2027
- Exhibit 68: Chart on Pharmaceuticals - Market size and forecast 2022-2027 ($ million)
- Exhibit 69: Data Table on Pharmaceuticals - Market size and forecast 2022-2027 ($ million)
- Exhibit 70: Chart on Pharmaceuticals - Year-over-year growth 2022-2027 (%)
- Exhibit 71: Data Table on Pharmaceuticals - Year-over-year growth 2022-2027 (%)
- 7.7 Textiles and others - Market size and forecast 2022-2027
- Exhibit 72: Chart on Textiles and others - Market size and forecast 2022-2027 ($ million)
- Exhibit 73: Data Table on Textiles and others - Market size and forecast 2022-2027 ($ million)
- Exhibit 74: Chart on Textiles and others - Year-over-year growth 2022-2027 (%)
- Exhibit 75: Data Table on Textiles and others - Year-over-year growth 2022-2027 (%)
- 7.8 Market opportunity by Product Type
- Exhibit 76: Market opportunity by Product Type ($ million)
- Exhibit 77: Data Table on Market opportunity by Product Type ($ million)
8 Customer Landscape
- 8.1 Customer landscape overview
- Exhibit 78: Analysis of price sensitivity, lifecycle, customer purchase basket, adoption rates, and purchase criteria
9 Geographic Landscape
- 9.1 Geographic segmentation
- Exhibit 79: Chart on Market share by geography 2022-2027 (%)
- Exhibit 80: Data Table on Market share by geography 2022-2027 (%)
- 9.2 Geographic comparison
- Exhibit 81: Chart on Geographic comparison
- Exhibit 82: Data Table on Geographic comparison
- 9.3 APAC - Market size and forecast 2022-2027
- Exhibit 83: Chart on APAC - Market size and forecast 2022-2027 ($ million)
- Exhibit 84: Data Table on APAC - Market size and forecast 2022-2027 ($ million)
- Exhibit 85: Chart on APAC - Year-over-year growth 2022-2027 (%)
- Exhibit 86: Data Table on APAC - Year-over-year growth 2022-2027 (%)
- 9.4 Europe - Market size and forecast 2022-2027
- Exhibit 87: Chart on Europe - Market size and forecast 2022-2027 ($ million)
- Exhibit 88: Data Table on Europe - Market size and forecast 2022-2027 ($ million)
- Exhibit 89: Chart on Europe - Year-over-year growth 2022-2027 (%)
- Exhibit 90: Data Table on Europe - Year-over-year growth 2022-2027 (%)
- 9.5 North America - Market size and forecast 2022-2027
- Exhibit 91: Chart on North America - Market size and forecast 2022-2027 ($ million)
- Exhibit 92: Data Table on North America - Market size and forecast 2022-2027 ($ million)
- Exhibit 93: Chart on North America - Year-over-year growth 2022-2027 (%)
- Exhibit 94: Data Table on North America - Year-over-year growth 2022-2027 (%)
- 9.6 South America - Market size and forecast 2022-2027
- Exhibit 95: Chart on South America - Market size and forecast 2022-2027 ($ million)
- Exhibit 96: Data Table on South America - Market size and forecast 2022-2027 ($ million)
- Exhibit 97: Chart on South America - Year-over-year growth 2022-2027 (%)
- Exhibit 98: Data Table on South America - Year-over-year growth 2022-2027 (%)
- 9.7 Middle East and Africa - Market size and forecast 2022-2027
- Exhibit 99: Chart on Middle East and Africa - Market size and forecast 2022-2027 ($ million)
- Exhibit 100: Data Table on Middle East and Africa - Market size and forecast 2022-2027 ($ million)
- Exhibit 101: Chart on Middle East and Africa - Year-over-year growth 2022-2027 (%)
- Exhibit 102: Data Table on Middle East and Africa - Year-over-year growth 2022-2027 (%)
- 9.8 China - Market size and forecast 2022-2027
- Exhibit 103: Chart on China - Market size and forecast 2022-2027 ($ million)
- Exhibit 104: Data Table on China - Market size and forecast 2022-2027 ($ million)
- Exhibit 105: Chart on China - Year-over-year growth 2022-2027 (%)
- Exhibit 106: Data Table on China - Year-over-year growth 2022-2027 (%)
- 9.9 US - Market size and forecast 2022-2027
- Exhibit 107: Chart on US - Market size and forecast 2022-2027 ($ million)
- Exhibit 108: Data Table on US - Market size and forecast 2022-2027 ($ million)
- Exhibit 109: Chart on US - Year-over-year growth 2022-2027 (%)
- Exhibit 110: Data Table on US - Year-over-year growth 2022-2027 (%)
- 9.10 Japan - Market size and forecast 2022-2027
- Exhibit 111: Chart on Japan - Market size and forecast 2022-2027 ($ million)
- Exhibit 112: Data Table on Japan - Market size and forecast 2022-2027 ($ million)
- Exhibit 113: Chart on Japan - Year-over-year growth 2022-2027 (%)
- Exhibit 114: Data Table on Japan - Year-over-year growth 2022-2027 (%)
- 9.11 UK - Market size and forecast 2022-2027
- Exhibit 115: Chart on UK - Market size and forecast 2022-2027 ($ million)
- Exhibit 116: Data Table on UK - Market size and forecast 2022-2027 ($ million)
- Exhibit 117: Chart on UK - Year-over-year growth 2022-2027 (%)
- Exhibit 118: Data Table on UK - Year-over-year growth 2022-2027 (%)
- 9.12 Germany - Market size and forecast 2022-2027
- Exhibit 119: Chart on Germany - Market size and forecast 2022-2027 ($ million)
- Exhibit 120: Data Table on Germany - Market size and forecast 2022-2027 ($ million)
- Exhibit 121: Chart on Germany - Year-over-year growth 2022-2027 (%)
- Exhibit 122: Data Table on Germany - Year-over-year growth 2022-2027 (%)
- 9.13 Market opportunity by geography
- Exhibit 123: Market opportunity by geography ($ million)
- Exhibit 124: Data Tables on Market opportunity by geography ($ million)
10 Drivers, Challenges, and Trends
- 10.1 Market drivers
- 10.2 Market challenges
- 10.3 Impact of drivers and challenges
- Exhibit 125: Impact of drivers and challenges in 2022 and 2027
- 10.4 Market trends
11 Vendor Landscape
- 11.1 Overview
- 11.2 Vendor landscape
- Exhibit 126: Overview on Criticality of inputs and Factors of differentiation
- 11.3 Landscape disruption
- Exhibit 127: Overview on factors of disruption
- 11.4 Industry risks
- Exhibit 128: Impact of key risks on business
12 Vendor Analysis
- 12.1 Vendors covered
- Exhibit 129: Vendors covered
- 12.2 Market positioning of vendors
- Exhibit 130: Matrix on vendor position and classification
- 12.3 3M Co.
- Exhibit 131: 3M Co. - Overview
- Exhibit 132: 3M Co. - Business segments
- Exhibit 133: 3M Co. - Key news
- Exhibit 134: 3M Co. - Key offerings
- Exhibit 135: 3M Co. - Segment focus
- 12.4 Avery Dennison Corp.
- Exhibit 136: Avery Dennison Corp. - Overview
- Exhibit 137: Avery Dennison Corp. - Business segments
- Exhibit 138: Avery Dennison Corp. - Key news
- Exhibit 139: Avery Dennison Corp. - Key offerings
- Exhibit 140: Avery Dennison Corp. - Segment focus
- 12.5 CCL Industries Inc.
- Exhibit 141: CCL Industries Inc. - Overview
- Exhibit 142: CCL Industries Inc. - Business segments
- Exhibit 143: CCL Industries Inc. - Key offerings
- Exhibit 144: CCL Industries Inc. - Segment focus
- 12.6 Coveris Management GmbH
- Exhibit 145: Coveris Management GmbH - Overview
- Exhibit 146: Coveris Management GmbH - Product / Service
- Exhibit 147: Coveris Management GmbH - Key offerings
- 12.7 General Data Co. Inc.
- Exhibit 148: General Data Co. Inc. - Overview
- Exhibit 149: General Data Co. Inc. - Product / Service
- Exhibit 150: General Data Co. Inc. - Key offerings
- 12.8 Gipako UAB
- Exhibit 151: Gipako UAB - Overview
- Exhibit 152: Gipako UAB - Product / Service
- Exhibit 153: Gipako UAB - Key offerings
- 12.9 Henkel AG and Co. KGaA
- Exhibit 154: Henkel AG and Co. KGaA - Overview
- Exhibit 155: Henkel AG and Co. KGaA - Business segments
- Exhibit 156: Henkel AG and Co. KGaA - Key news
- Exhibit 157: Henkel AG and Co. KGaA - Key offerings
- Exhibit 158: Henkel AG and Co. KGaA - Segment focus
- 12.10 Hub Labels Inc.
- Exhibit 159: Hub Labels Inc. - Overview
- Exhibit 160: Hub Labels Inc. - Product / Service
- Exhibit 161: Hub Labels Inc. - Key offerings
- 12.11 LINTEC Corp.
- Exhibit 162: LINTEC Corp. - Overview
- Exhibit 163: LINTEC Corp. - Business segments
- Exhibit 164: LINTEC Corp. - Key offerings
- Exhibit 165: LINTEC Corp. - Segment focus
- 12.12 Multi Color Corp.
- Exhibit 166: Multi Color Corp. - Overview
- Exhibit 167: Multi Color Corp. - Product / Service
- Exhibit 168: Multi Color Corp. - Key offerings
- 12.13 NAStar Inc.
- Exhibit 169: NAStar Inc. - Overview
- Exhibit 170: NAStar Inc. - Product / Service
- Exhibit 171: NAStar Inc. - Key offerings
- 12.14 Reflex Labels Ltd.
- Exhibit 172: Reflex Labels Ltd. - Overview
- Exhibit 173: Reflex Labels Ltd. - Product / Service
- Exhibit 174: Reflex Labels Ltd. - Key offerings
- 12.15 RR Donnelley and Sons Co.
- Exhibit 175: RR Donnelley and Sons Co. - Overview
- Exhibit 176: RR Donnelley and Sons Co. - Product / Service
- Exhibit 177: RR Donnelley and Sons Co. - Key offerings
- 12.16 SATO Corp.
- Exhibit 178: SATO Corp. - Overview
- Exhibit 179: SATO Corp. - Product / Service
- Exhibit 180: SATO Corp. - Key offerings
- 12.17 Torraspapel S.A.
- Exhibit 181: Torraspapel S.A. - Overview
- Exhibit 182: Torraspapel S.A. - Business segments
- Exhibit 183: Torraspapel S.A. - Key news
- Exhibit 184: Torraspapel S.A. - Key offerings
- Exhibit 185: Torraspapel S.A. - Segment focus
13 Appendix
- 13.1 Scope of the report
- 13.2 Inclusions and exclusions checklist
- Exhibit 186: Inclusions checklist
- Exhibit 187: Exclusions checklist
- 13.3 Currency conversion rates for US$
- Exhibit 188: Currency conversion rates for US$
- 13.4 Research methodology
- Exhibit 189: Research methodology
- Exhibit 190: Validation techniques employed for market sizing
- Exhibit 191: Information sources
- 13.5 List of abbreviations
- Exhibit 192: List of abbreviations
Research Framework
Technavio presents a detailed picture of the market by way of study, synthesis, and summation of data from multiple sources. The analysts have presented the various facets of the market with a particular focus on identifying the key industry influencers. The data thus presented is comprehensive, reliable, and the result of extensive research, both primary and secondary.
INFORMATION SOURCES
Primary sources
- Manufacturers and suppliers
- Channel partners
- Industry experts
- Strategic decision makers
Secondary sources
- Industry journals and periodicals
- Government data
- Financial reports of key industry players
- Historical data
- Press releases
DATA ANALYSIS
Data Synthesis
- Collation of data
- Estimation of key figures
- Analysis of derived insights
Data Validation
- Triangulation with data models
- Reference against proprietary databases
- Corroboration with industry experts
REPORT WRITING
Qualitative
- Market drivers
- Market challenges
- Market trends
- Five forces analysis
Quantitative
- Market size and forecast
- Market segmentation
- Geographical insights
- Competitive landscape
PURCHASE FULL REPORT OF
linerless labels market market
Key Questions Answered
- What are the key global market and the regional market share?
- What are the revenue-generating key market segments?
- What are the key factors driving and challenging this market’s growth?
- Who are the key market vendors and their growth strategies?
- What are the latest trends influencing the growth of this market?
- What are the variables influencing the market growth in the primary regions?
- What are the factors influencing the growth of the parent market?
Why should you prefer Technavio's market insights report?
- Off-the-shelf research reports
- Reports can be tailored to meet the customer's needs
- Trusted by more than 100 fortune 500 organizations
- Information about the market's key drivers, trends, and challenges
- Parent market analysis
- Every week, 50,000 people visit our subscription platform
- Detailed vendors report with competitive landscape
- Covid-19 impact and recovery analysis
- Data on revenue-generating market segments
- Details on the market shares of various regions
- Five-force market analysis