Labels Market Analysis, Size, and Forecast 2026-2030: APAC (China, Japan, and India), Europe (Germany, France, and UK), North America (US, Canada, and Mexico), South America (Brazil and Argentina), Middle East and Africa (Saudi Arabia, UAE, and South Africa), and Rest of World (ROW)

Labels Market Analysis, Size, and Forecast 2026-2030:
APAC (China, Japan, and India), Europe (Germany, France, and UK), North America (US, Canada, and Mexico), South America (Brazil and Argentina), Middle East and Africa (Saudi Arabia, UAE, and South Africa), and Rest of World (ROW)

Published: Apr 2026 303 Pages SKU: IRTNTR70997

Market Overview at a Glance

$14.54 B
Market Opportunity
5.9%
CAGR 2025 - 2030
48.7%
APAC Growth
$20.41 B
Consumer goods segment 2024

Labels Market Size 2026-2030

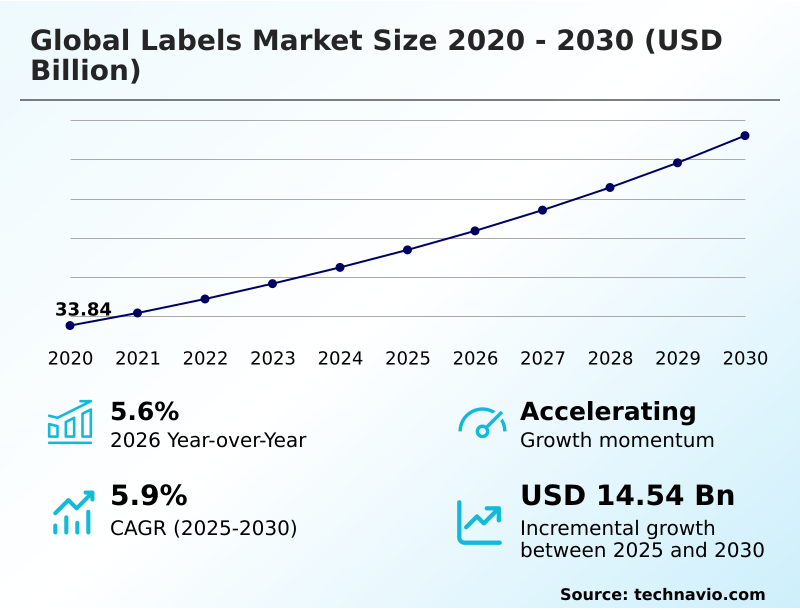
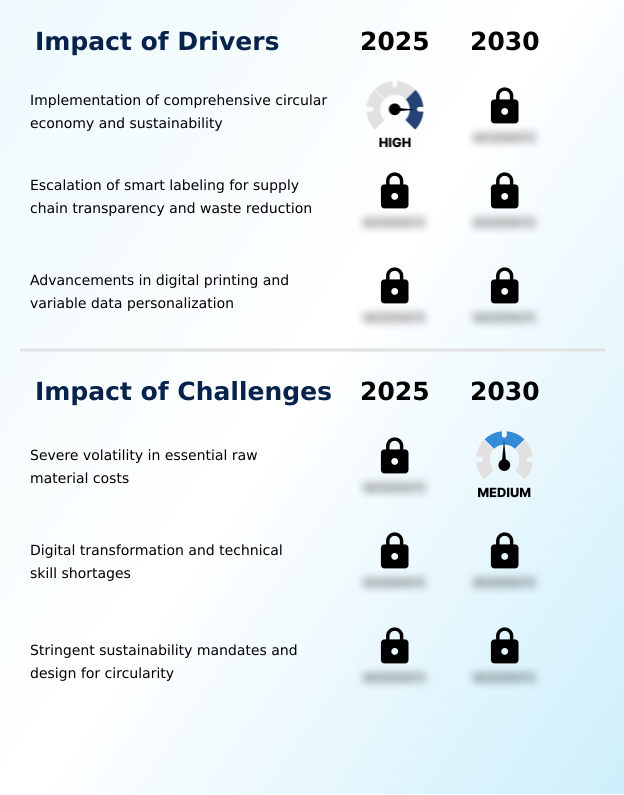
The labels market size is valued to increase by USD 14.54 billion, at a CAGR of 5.9% from 2025 to 2030. Implementation of comprehensive circular economy and sustainability will drive the labels market.

Major Market Trends & Insights

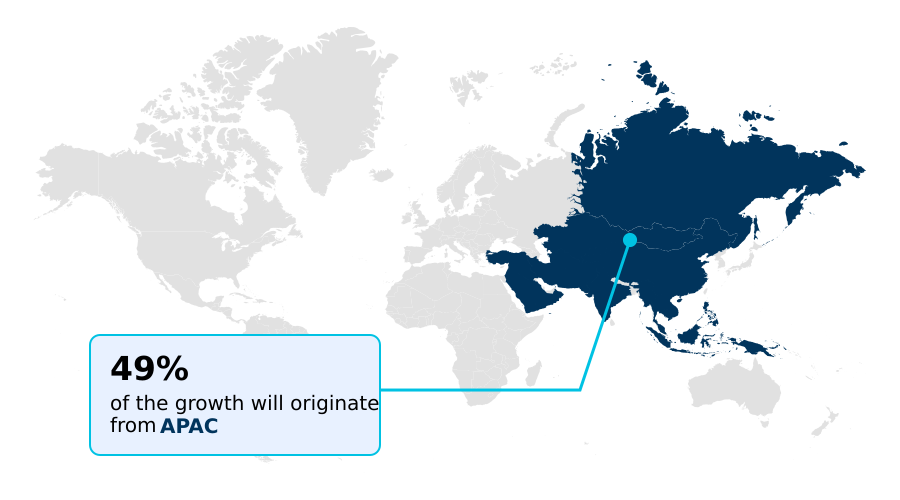
  • APAC dominated the market and accounted for a 48.7% growth during the forecast period.
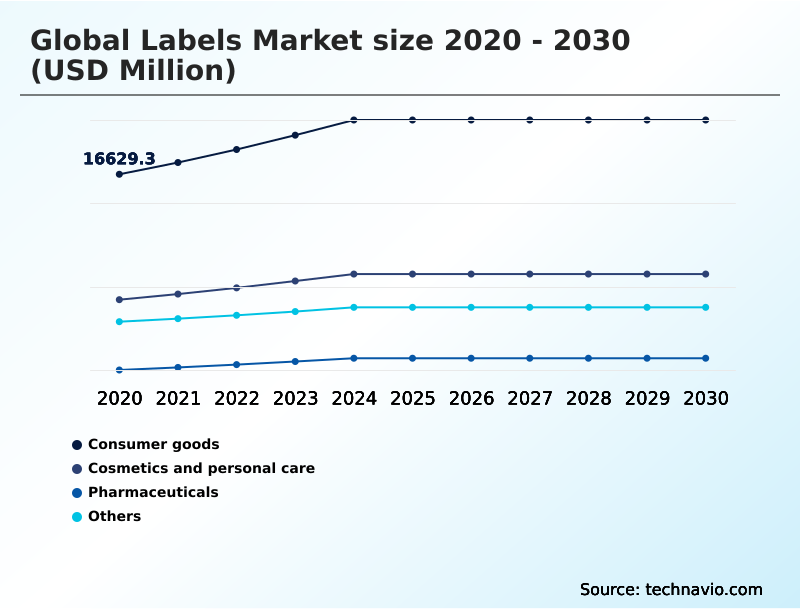
  • By End-user - Consumer goods segment was valued at USD 20.41 billion in 2024
  • By Type - Pressure-sensitive label segment accounted for the largest market revenue share in 2024

Market Size & Forecast

  • Market Opportunities: USD 24.16 billion
  • Market Future Opportunities: USD 14.54 billion
  • CAGR from 2025 to 2030 : 5.9%

Market Summary

  • The labels market is undergoing a significant transformation, driven by the dual forces of digitalization and sustainability. The expansion of e-commerce necessitates robust logistics labels capable of supporting high-speed automated sorting systems, while consumer demand for eco-friendly products fuels innovation in materials science. This includes the development of compostable face stocks and wash-off adhesives that facilitate recycling.
  • A key trend is the integration of smart technologies, such as radio frequency identification and near field communication, which convert passive labels into active data carriers. For instance, a pharmaceutical company can leverage serialized security labels with integrated sensors for cold chain monitoring, ensuring vaccine efficacy from production to patient administration.
  • This provides end-to-end supply chain transparency, enhances brand protection technology, and ensures regulatory compliance. However, the industry grapples with challenges like raw material price volatility and the need for significant capital investment in digital printing technology to support short-run, personalized packaging requirements. The market's trajectory is defined by this balance between technological advancement and environmental responsibility.

What will be the Size of the Labels Market during the forecast period?

Get Key Insights on Market Forecast (PDF) Request Free Sample

How is the Labels Market Segmented?

The labels industry research report provides comprehensive data (region-wise segment analysis), with forecasts and estimates in "USD million" for the period 2026-2030, as well as historical data from 2020-2024 for the following segments.

  • End-user
    • Consumer goods
    • Cosmetics and personal care
    • Pharmaceuticals
    • Others
  • Type
    • Pressure-sensitive label
    • Glue-applied label
    • Sleeve label
    • In-mold labels
  • Material
    • Plastic and film
    • Paper
    • Metal foil
    • Fabric
  • Geography
    • APAC
      • China
      • Japan
      • India
    • Europe
      • Germany
      • France
      • UK
    • North America
      • US
      • Canada
      • Mexico
    • South America
      • Brazil
      • Argentina
    • Middle East and Africa
      • Saudi Arabia
      • UAE
      • South Africa
    • Rest of World (ROW)

By End-user Insights

The consumer goods segment is estimated to witness significant growth during the forecast period.

The consumer goods segment is a primary end-user, where labels are a critical interface for brand differentiation and information delivery.

The proliferation of digital printing technology enables extensive use of variable data printing for mass personalization campaigns, while the integration of radio frequency identification allows for superior inventory accuracy systems.

As brands pursue aggressive sustainability targets, the adoption of liner-less labels is gaining momentum, with some companies reporting a reduction in operational waste by over 20% in high-volume settings.

The demand for high-resolution graphics and a premium shelf appeal continues to drive innovation in decorative finish options.

This is complemented by a move towards sustainable labeling solutions, which has become a key purchasing criterion for major consumer goods companies aiming for ethical production standards.

Request Free Sample

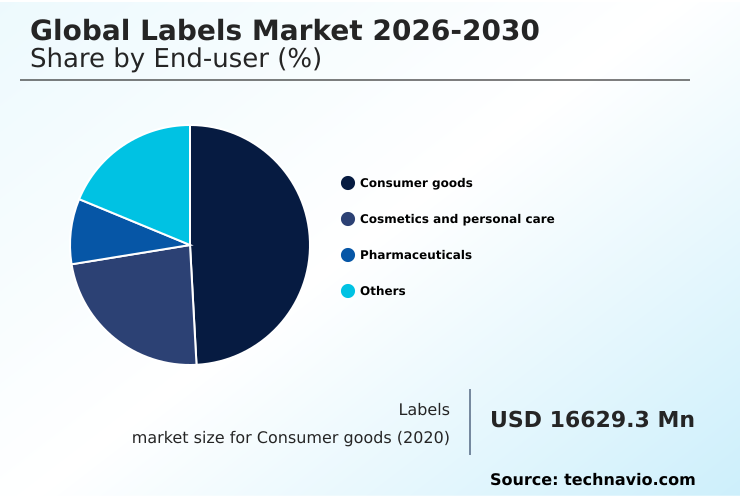
The Consumer goods segment was valued at USD 20.41 billion in 2024 and showed a gradual increase during the forecast period.

Request Free Sample

Regional Analysis

APAC is estimated to contribute 48.7% to the growth of the global market during the forecast period.Technavio’s analysts have elaborately explained the regional trends and drivers that shape the market during the forecast period.

See How Labels Market Demand is Rising in APAC Request Free Sample

The geographic landscape is characterized by robust growth in APAC, which is poised to contribute nearly 49% of the market's incremental growth.

This expansion is fueled by rapid industrialization, the formalization of retail, and the rise of a large consumer base in countries like China and India.

Strong demand from the manufacturing, e-commerce, and pharmaceutical sectors requires high-volume, cost-effective industrial identification labels and packaging.

The region is seeing a significant shift toward digital inkjet systems, with adoption rates leading to a 25% improvement in production throughput for brands needing regionalized packaging with high-resolution graphics.

While cost remains a factor, there is growing adoption of premium solutions like tamper-evident features and sustainable labeling solutions to meet both local and export standards, reflecting a maturing market focused on brand protection technology.

Market Dynamics

Our researchers analyzed the data with 2025 as the base year, along with the key drivers, trends, and challenges. A holistic analysis of drivers will help companies refine their marketing strategies to gain a competitive advantage.

  • The strategic direction of the labels market is increasingly defined by the impact of digital printing on labels market, which enables unprecedented agility. This technological shift complements the urgent need for sustainable materials for pressure-sensitive labels, forcing innovation in recyclable and compostable options.
  • In high-value sectors, RFID technology in pharmaceutical labeling is becoming standard for traceability, working alongside advancements in tamper-evident label technology to ensure product safety. Businesses are navigating the challenges of implementing circular economy in labels by adopting solutions like wash-off adhesives for PET bottle recycling, which are critical to the success of the circular model.
  • The role of mono-material construction in sustainability is equally vital, simplifying end-of-life processing. Concurrently, smart labeling for supply chain optimization, utilizing tools such as QR code applications in food traceability and NFC labels for enhanced consumer engagement, is transforming logistics.
  • The transition from legacy methods, highlighted by the flexographic to digital printing transition benefits, has been shown to reduce job changeover waste by over 50%. This flexibility allows for effective variable data printing for personalized marketing and the use of expanded content labels for regulatory compliance.
  • Other key considerations include the cost-effectiveness of glue-applied versus sleeve labels, the adoption of liner-less labels for waste reduction in logistics, and the implementation of digital product passport requirements and solutions.
  • Material science is also advancing with bio-based polymers in flexible packaging labels and the use of in-mold labeling for durable consumer goods, while security labels for brand protection strategies now often incorporate sophisticated holographic features for anti-counterfeiting.

What are the key market drivers leading to the rise in the adoption of Labels Industry?

  • The implementation of comprehensive circular economy principles and a heightened focus on sustainability serve as primary drivers propelling innovation and adoption within the market.

  • Key market drivers are centered on digitalization and sustainability mandates that reshape production and compliance.
  • The widespread adoption of digital printing technology, including advanced digital inkjet systems, facilitates on-demand label production, cutting time-to-market for new products by an average of 30%. This agility is crucial for personalized packaging and agile marketing support.
  • Furthermore, stringent environmental regulations are compelling a shift toward eco-friendly packaging design. Proactive adoption of solutions like mono-material construction and liner-less labels not only supports packaging waste reduction goals but also mitigates compliance risk, helping companies avoid significant fines.
  • This regulatory push makes technologies like the digital product passport an essential component for ensuring supply chain transparency and meeting extended producer responsibility requirements.

What are the market trends shaping the Labels Industry?

  • The evolution toward intelligent and connected labeling solutions represents a significant market trend, driven by the increasing need for enhanced supply chain visibility and interactive consumer engagement.

  • The market is rapidly evolving toward intelligent and sustainable solutions, driven by regulatory pressures and supply chain demands. The adoption of smart labeling solutions incorporating technologies like near field communication and digital watermarking has been shown to reduce inventory shrinkage by up to 40% in high-value retail sectors.
  • Concurrently, advancements in sustainable materials, such as compostable face stocks and recycled content substrates, are becoming standard. For instance, the use of specialized wash-off adhesives improves PET recycling yields by over 15%, aligning with circular economy in packaging goals.
  • This pivot to intelligent packaging provides enhanced food traceability and supports lean manufacturing principles, transforming labels into functional assets that improve both efficiency and brand trust.

What challenges does the Labels Industry face during its growth?

  • Severe volatility in the cost of essential raw materials, including paper pulps and plastic resins, presents a key challenge affecting profitability and price stability across the industry.

  • The market faces significant challenges from raw material volatility and a growing technical skills gap. Severe price fluctuations in essential inputs like bio-based polymers and high-performance adhesives, with swings of over 18% in a single quarter, directly impact profit margins and complicate financial forecasting. This requires sophisticated predictive maintenance in printing operations to minimize waste.
  • Simultaneously, the digital transformation demands a workforce proficient in operating complex systems for variable data printing and automated quality control.
  • The current skills shortage increases technician training and onboarding time by an estimated 30%, delaying ROI on capital investments in new technologies like radio frequency identification and creating a barrier for smaller firms aiming to achieve pharmaceutical serialization or other advanced tracking capabilities.

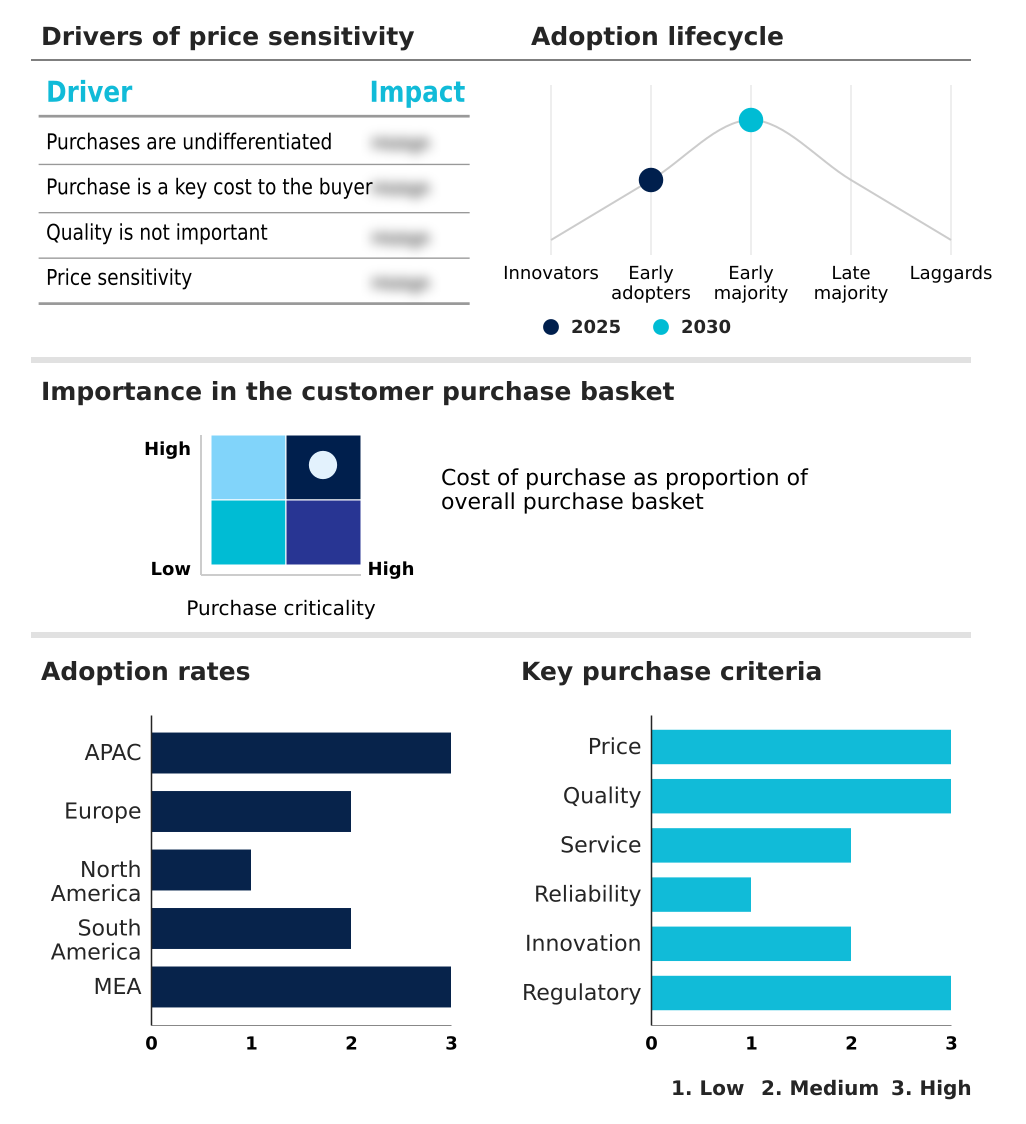
Exclusive Technavio Analysis on Customer Landscape

The labels market forecasting report includes the adoption lifecycle of the market, covering from the innovator’s stage to the laggard’s stage. It focuses on adoption rates in different regions based on penetration. Furthermore, the labels market report also includes key purchase criteria and drivers of price sensitivity to help companies evaluate and develop their market growth analysis strategies.

Customer Landscape of Labels Industry

Competitive Landscape

Companies are implementing various strategies, such as strategic alliances, labels market forecast, partnerships, mergers and acquisitions, geographical expansion, and product/service launches, to enhance their presence in the industry.

Amcor Plc - Offers a comprehensive range of labeling solutions, including pressure-sensitive, shrink sleeve, and wrap-around formats, tailored for diverse consumer and industrial packaging applications.

The industry research and growth report includes detailed analyses of the competitive landscape of the market and information about key companies, including:

  • Amcor Plc
  • Avery Dennison Corp.
  • Brady Corp.
  • CCL Industries Inc.
  • Cenveo Worldwide Ltd.
  • Consolidated Label Co.
  • Denny Bros Ltd.
  • Essentra Components
  • Fuji Seal International Inc.
  • HERMA GmbH
  • Multi Color Corp.
  • OPM Group
  • Resource Label Group LLC
  • SATO Holdings Corp.
  • Schreiner Group GmbH and Co. KG
  • UPM Kymmene Corp.
  • Yorkshire Labels Ltd
  • Zebra Technologies Corp.

Qualitative and quantitative analysis of companies has been conducted to help clients understand the wider business environment as well as the strengths and weaknesses of key industry players. Data is qualitatively analyzed to categorize companies as pure play, category-focused, industry-focused, and diversified; it is quantitatively analyzed to categorize companies as dominant, leading, strong, tentative, and weak.

Recent Development and News in Labels market

  • In January 2025, Avery Dennison South Asia announced the launch of a new premium labels range designed to enhance consumer experience with unique textures and surface patterns, targeting the high-end consumer goods sector.
  • In January 2025, the European Medicines Agency mandated the use of the IRIS platform for Article 61(3) notifications, streamlining the process for updating labeling information for centrally authorized pharmaceutical products.
  • In February 2025, the European Union's Packaging and Packaging Waste Regulation entered a new phase, introducing stricter labeling and reuse requirements compelling cosmetic brands to adopt mono-material packaging and wash-off adhesives.
  • In February 2025, Polytag launched its QR Squared service, a QR code analytics platform providing brands with detailed performance data, which enhances tracking and inventory management in industrial and transportation contexts.

Dive into Technavio’s robust research methodology, blending expert interviews, extensive data synthesis, and validated models for unparalleled Labels Market insights. See full methodology.

Market Scope
Page number 303
Base year 2025
Historic period 2020-2024
Forecast period 2026-2030
Growth momentum & CAGR Accelerate at a CAGR of 5.9%
Market growth 2026-2030 USD 14536.8 million
Market structure Fragmented
YoY growth 2025-2026(%) 5.6%
Key countries China, Japan, India, South Korea, Indonesia, Australia, Germany, France, UK, Italy, Spain, The Netherlands, US, Canada, Mexico, Brazil, Argentina, Chile, Saudi Arabia, UAE, South Africa, Turkey and Israel
Competitive landscape Leading Companies, Market Positioning of Companies, Competitive Strategies, and Industry Risks

Request Free Sample

Research Analyst Overview

  • Boardroom-level decisions are increasingly focused on the strategic integration of labeling technologies to drive efficiency and compliance. The modern labels ecosystem combines various formats, including the pressure-sensitive label, glue-applied label, sleeve label, and in-mold labels, with advanced printing methods like digital printing technology and legacy flexographic printing.
  • The shift toward digital inkjet systems and thermal transfer labels facilitates variable data printing, a stark contrast to older methods. Smart labeling is now a cornerstone, utilizing radio frequency identification, near field communication, and QR code technology embedded in RFID labels and barcode labels to power electronic tracking systems.
  • For security, tamper-evident features, holographic security features, and specialized security labels are critical. Sustainability mandates are driving the adoption of wash-off adhesives, mono-material construction, compostable face stocks, thin-gauge liners, and liner-less labels made from recycled content substrates or bio-based polymers.
  • This pivot away from traditional synthetic labels has achieved a 30% reduction in compliance-related processing time for companies in regulated markets. Material choices now span self-adhesive label materials with specialized release liners and high-performance adhesives, while applications range from industrial identification labels to expanded content labels with a premium decorative finish.

What are the Key Data Covered in this Labels Market Research and Growth Report?

  • What is the expected growth of the Labels Market between 2026 and 2030?

    • USD 14.54 billion, at a CAGR of 5.9%

  • What segmentation does the market report cover?

    • The report is segmented by End-user (Consumer goods, Cosmetics and personal care, Pharmaceuticals, and Others), Type (Pressure-sensitive label, Glue-applied label, Sleeve label, and In-mold labels), Material (Plastic and film, Paper, Metal foil, and Fabric) and Geography (APAC, Europe, North America, South America, Middle East and Africa)

  • Which regions are analyzed in the report?

    • APAC, Europe, North America, South America and Middle East and Africa

  • What are the key growth drivers and market challenges?

    • Implementation of comprehensive circular economy and sustainability, Severe volatility in essential raw material costs

  • Who are the major players in the Labels Market?

    • Amcor Plc, Avery Dennison Corp., Brady Corp., CCL Industries Inc., Cenveo Worldwide Ltd., Consolidated Label Co., Denny Bros Ltd., Essentra Components, Fuji Seal International Inc., HERMA GmbH, Multi Color Corp., OPM Group, Resource Label Group LLC, SATO Holdings Corp., Schreiner Group GmbH and Co. KG, UPM Kymmene Corp., Yorkshire Labels Ltd and Zebra Technologies Corp.

Market Research Insights

  • Market dynamics are increasingly shaped by the need for enhanced operational intelligence and consumer interaction. The integration of intelligent packaging for real-time asset tracking has been shown to improve inventory accuracy systems by over 98% for early adopters in the retail sector, drastically reducing stock-outs and waste.
  • Concurrently, the use of consumer engagement platforms, accessed via QR code technology on labels, has boosted repeat purchase rates by up to 15% in targeted campaigns by providing detailed product provenance and sustainability information. This shift toward data-driven functionality is compelling a move to on-demand label production, offering greater flexibility for agile marketing support and reducing obsolescence.
  • The ability to provide these value-added services is becoming a critical differentiator, transforming labels from a simple component into a strategic asset for achieving food traceability and supply chain transparency.

We can help! Our analysts can customize this labels market research report to meet your requirements.

Get in touch

1. Executive Summary

1.1 Market overview

Executive Summary - Chart on Market Overview
Executive Summary - Data Table on Market Overview
Executive Summary - Chart on Global Market Characteristics
Executive Summary - Chart on Market by Geography
Executive Summary - Chart on Market Segmentation by End-user
Executive Summary - Chart on Market Segmentation by Type
Executive Summary - Chart on Market Segmentation by Material
Executive Summary - Chart on Incremental Growth
Executive Summary - Data Table on Incremental Growth
Executive Summary - Chart on Company Market Positioning

2. Technavio Analysis

2.1 Analysis of price sensitivity, lifecycle, customer purchase basket, adoption rates, and purchase criteria

2.2 Criticality of inputs and Factors of differentiation

Chart on Overview on criticality of inputs and factors of differentiation

2.3 Factors of disruption

Chart on Overview on factors of disruption

2.4 Impact of drivers and challenges

Chart on Impact of drivers and challenges in 2025 and 2030

3. Market Landscape

3.1 Market ecosystem

Chart on Parent Market
Data Table on - Parent Market

3.2 Market characteristics

Chart on Market characteristics analysis

3.3 Value chain analysis

Chart on Value chain analysis

4. Market Sizing

4.1 Market definition

Data Table on Offerings of companies included in the market definition

4.2 Market segment analysis

Market segments

4.3 Market size 2025

4.4 Market outlook: Forecast for 2025-2030

Chart on Global - Market size and forecast 2025-2030 ($ million)
Data Table on Global - Market size and forecast 2025-2030 ($ million)
Chart on Global Market: Year-over-year growth 2025-2030 (%)
Data Table on Global Market: Year-over-year growth 2025-2030 (%)

5. Historic Market Size

5.1 Global Labels Market 2020 - 2024

Historic Market Size - Data Table on Global Labels Market 2020 - 2024 ($ million)

5.2 End-user segment analysis 2020 - 2024

Historic Market Size - End-user Segment 2020 - 2024 ($ million)

5.3 Type segment analysis 2020 - 2024

Historic Market Size - Type Segment 2020 - 2024 ($ million)

5.4 Material segment analysis 2020 - 2024

Historic Market Size - Material Segment 2020 - 2024 ($ million)

5.5 Geography segment analysis 2020 - 2024

Historic Market Size - Geography Segment 2020 - 2024 ($ million)

5.6 Country segment analysis 2020 - 2024

Historic Market Size - Country Segment 2020 - 2024 ($ million)

6. Qualitative Analysis

6.1 Impact of AI in global labels market

6.2 Impact of geopolitical conflict for global labels market

7. Five Forces Analysis

7.1 Five forces summary

Five forces analysis - Comparison between 2025 and 2030

7.2 Bargaining power of buyers

Bargaining power of buyers - Impact of key factors 2025 and 2030

7.3 Bargaining power of suppliers

Bargaining power of suppliers - Impact of key factors in 2025 and 2030

7.4 Threat of new entrants

Threat of new entrants - Impact of key factors in 2025 and 2030

7.5 Threat of substitutes

Threat of substitutes - Impact of key factors in 2025 and 2030

7.6 Threat of rivalry

Threat of rivalry - Impact of key factors in 2025 and 2030

7.7 Market condition

Chart on Market condition - Five forces 2025 and 2030

8. Market Segmentation by End-user

8.1 Market segments

Chart on End-user - Market share 2025-2030 (%)
Data Table on End-user - Market share 2025-2030 (%)

8.2 Comparison by End-user

Chart on Comparison by End-user
Data Table on Comparison by End-user

8.3 Consumer goods - Market size and forecast 2025-2030

Chart on Consumer goods - Market size and forecast 2025-2030 ($ million)
Data Table on Consumer goods - Market size and forecast 2025-2030 ($ million)
Chart on Consumer goods - Year-over-year growth 2025-2030 (%)
Data Table on Consumer goods - Year-over-year growth 2025-2030 (%)

8.4 Cosmetics and personal care - Market size and forecast 2025-2030

Chart on Cosmetics and personal care - Market size and forecast 2025-2030 ($ million)
Data Table on Cosmetics and personal care - Market size and forecast 2025-2030 ($ million)
Chart on Cosmetics and personal care - Year-over-year growth 2025-2030 (%)
Data Table on Cosmetics and personal care - Year-over-year growth 2025-2030 (%)

8.5 Pharmaceuticals - Market size and forecast 2025-2030

Chart on Pharmaceuticals - Market size and forecast 2025-2030 ($ million)
Data Table on Pharmaceuticals - Market size and forecast 2025-2030 ($ million)
Chart on Pharmaceuticals - Year-over-year growth 2025-2030 (%)
Data Table on Pharmaceuticals - Year-over-year growth 2025-2030 (%)

8.6 Others - Market size and forecast 2025-2030

Chart on Others - Market size and forecast 2025-2030 ($ million)
Data Table on Others - Market size and forecast 2025-2030 ($ million)
Chart on Others - Year-over-year growth 2025-2030 (%)
Data Table on Others - Year-over-year growth 2025-2030 (%)

8.7 Market opportunity by End-user

Market opportunity by End-user ($ million)
Data Table on Market opportunity by End-user ($ million)

9. Market Segmentation by Type

9.1 Market segments

Chart on Type - Market share 2025-2030 (%)
Data Table on Type - Market share 2025-2030 (%)

9.2 Comparison by Type

Chart on Comparison by Type
Data Table on Comparison by Type

9.3 Pressure-sensitive label - Market size and forecast 2025-2030

Chart on Pressure-sensitive label - Market size and forecast 2025-2030 ($ million)
Data Table on Pressure-sensitive label - Market size and forecast 2025-2030 ($ million)
Chart on Pressure-sensitive label - Year-over-year growth 2025-2030 (%)
Data Table on Pressure-sensitive label - Year-over-year growth 2025-2030 (%)

9.4 Glue-applied label - Market size and forecast 2025-2030

Chart on Glue-applied label - Market size and forecast 2025-2030 ($ million)
Data Table on Glue-applied label - Market size and forecast 2025-2030 ($ million)
Chart on Glue-applied label - Year-over-year growth 2025-2030 (%)
Data Table on Glue-applied label - Year-over-year growth 2025-2030 (%)

9.5 Sleeve label - Market size and forecast 2025-2030

Chart on Sleeve label - Market size and forecast 2025-2030 ($ million)
Data Table on Sleeve label - Market size and forecast 2025-2030 ($ million)
Chart on Sleeve label - Year-over-year growth 2025-2030 (%)
Data Table on Sleeve label - Year-over-year growth 2025-2030 (%)

9.6 In-mold labels - Market size and forecast 2025-2030

Chart on In-mold labels - Market size and forecast 2025-2030 ($ million)
Data Table on In-mold labels - Market size and forecast 2025-2030 ($ million)
Chart on In-mold labels - Year-over-year growth 2025-2030 (%)
Data Table on In-mold labels - Year-over-year growth 2025-2030 (%)

9.7 Market opportunity by Type

Market opportunity by Type ($ million)
Data Table on Market opportunity by Type ($ million)

10. Market Segmentation by Material

10.1 Market segments

Chart on Material - Market share 2025-2030 (%)
Data Table on Material - Market share 2025-2030 (%)

10.2 Comparison by Material

Chart on Comparison by Material
Data Table on Comparison by Material

10.3 Plastic and film - Market size and forecast 2025-2030

Chart on Plastic and film - Market size and forecast 2025-2030 ($ million)
Data Table on Plastic and film - Market size and forecast 2025-2030 ($ million)
Chart on Plastic and film - Year-over-year growth 2025-2030 (%)
Data Table on Plastic and film - Year-over-year growth 2025-2030 (%)

10.4 Paper - Market size and forecast 2025-2030

Chart on Paper - Market size and forecast 2025-2030 ($ million)
Data Table on Paper - Market size and forecast 2025-2030 ($ million)
Chart on Paper - Year-over-year growth 2025-2030 (%)
Data Table on Paper - Year-over-year growth 2025-2030 (%)

10.5 Metal foil - Market size and forecast 2025-2030

Chart on Metal foil - Market size and forecast 2025-2030 ($ million)
Data Table on Metal foil - Market size and forecast 2025-2030 ($ million)
Chart on Metal foil - Year-over-year growth 2025-2030 (%)
Data Table on Metal foil - Year-over-year growth 2025-2030 (%)

10.6 Fabric - Market size and forecast 2025-2030

Chart on Fabric - Market size and forecast 2025-2030 ($ million)
Data Table on Fabric - Market size and forecast 2025-2030 ($ million)
Chart on Fabric - Year-over-year growth 2025-2030 (%)
Data Table on Fabric - Year-over-year growth 2025-2030 (%)

10.7 Market opportunity by Material

Market opportunity by Material ($ million)
Data Table on Market opportunity by Material ($ million)

11. Customer Landscape

11.1 Customer landscape overview

Analysis of price sensitivity, lifecycle, customer purchase basket, adoption rates, and purchase criteria

12. Geographic Landscape

12.1 Geographic segmentation

Chart on Market share by geography 2025-2030 (%)
Data Table on Market share by geography 2025-2030 (%)

12.2 Geographic comparison

Chart on Geographic comparison
Data Table on Geographic comparison

12.3 APAC - Market size and forecast 2025-2030

Chart on APAC - Market size and forecast 2025-2030 ($ million)
Data Table on APAC - Market size and forecast 2025-2030 ($ million)
Chart on APAC - Year-over-year growth 2025-2030 (%)
Data Table on APAC - Year-over-year growth 2025-2030 (%)
Chart on Regional Comparison - APAC
Data Table on Regional Comparison - APAC

12.3.1 China - Market size and forecast 2025-2030

Chart on China - Market size and forecast 2025-2030 ($ million)
Data Table on China - Market size and forecast 2025-2030 ($ million)
Chart on China - Year-over-year growth 2025-2030 (%)
Data Table on China - Year-over-year growth 2025-2030 (%)

12.3.2 Japan - Market size and forecast 2025-2030

Chart on Japan - Market size and forecast 2025-2030 ($ million)
Data Table on Japan - Market size and forecast 2025-2030 ($ million)
Chart on Japan - Year-over-year growth 2025-2030 (%)
Data Table on Japan - Year-over-year growth 2025-2030 (%)

12.3.3 India - Market size and forecast 2025-2030

Chart on India - Market size and forecast 2025-2030 ($ million)
Data Table on India - Market size and forecast 2025-2030 ($ million)
Chart on India - Year-over-year growth 2025-2030 (%)
Data Table on India - Year-over-year growth 2025-2030 (%)

12.3.4 South Korea - Market size and forecast 2025-2030

Chart on South Korea - Market size and forecast 2025-2030 ($ million)
Data Table on South Korea - Market size and forecast 2025-2030 ($ million)
Chart on South Korea - Year-over-year growth 2025-2030 (%)
Data Table on South Korea - Year-over-year growth 2025-2030 (%)

12.3.5 Indonesia - Market size and forecast 2025-2030

Chart on Indonesia - Market size and forecast 2025-2030 ($ million)
Data Table on Indonesia - Market size and forecast 2025-2030 ($ million)
Chart on Indonesia - Year-over-year growth 2025-2030 (%)
Data Table on Indonesia - Year-over-year growth 2025-2030 (%)

12.3.6 Australia - Market size and forecast 2025-2030

Chart on Australia - Market size and forecast 2025-2030 ($ million)
Data Table on Australia - Market size and forecast 2025-2030 ($ million)
Chart on Australia - Year-over-year growth 2025-2030 (%)
Data Table on Australia - Year-over-year growth 2025-2030 (%)

12.4 Europe - Market size and forecast 2025-2030

Chart on Europe - Market size and forecast 2025-2030 ($ million)
Data Table on Europe - Market size and forecast 2025-2030 ($ million)
Chart on Europe - Year-over-year growth 2025-2030 (%)
Data Table on Europe - Year-over-year growth 2025-2030 (%)
Chart on Regional Comparison - Europe
Data Table on Regional Comparison - Europe

12.4.1 Germany - Market size and forecast 2025-2030

Chart on Germany - Market size and forecast 2025-2030 ($ million)
Data Table on Germany - Market size and forecast 2025-2030 ($ million)
Chart on Germany - Year-over-year growth 2025-2030 (%)
Data Table on Germany - Year-over-year growth 2025-2030 (%)

12.4.2 France - Market size and forecast 2025-2030

Chart on France - Market size and forecast 2025-2030 ($ million)
Data Table on France - Market size and forecast 2025-2030 ($ million)
Chart on France - Year-over-year growth 2025-2030 (%)
Data Table on France - Year-over-year growth 2025-2030 (%)

12.4.3 UK - Market size and forecast 2025-2030

Chart on UK - Market size and forecast 2025-2030 ($ million)
Data Table on UK - Market size and forecast 2025-2030 ($ million)
Chart on UK - Year-over-year growth 2025-2030 (%)
Data Table on UK - Year-over-year growth 2025-2030 (%)

12.4.4 Italy - Market size and forecast 2025-2030

Chart on Italy - Market size and forecast 2025-2030 ($ million)
Data Table on Italy - Market size and forecast 2025-2030 ($ million)
Chart on Italy - Year-over-year growth 2025-2030 (%)
Data Table on Italy - Year-over-year growth 2025-2030 (%)

12.4.5 Spain - Market size and forecast 2025-2030

Chart on Spain - Market size and forecast 2025-2030 ($ million)
Data Table on Spain - Market size and forecast 2025-2030 ($ million)
Chart on Spain - Year-over-year growth 2025-2030 (%)
Data Table on Spain - Year-over-year growth 2025-2030 (%)

12.4.6 The Netherlands - Market size and forecast 2025-2030

Chart on The Netherlands - Market size and forecast 2025-2030 ($ million)
Data Table on The Netherlands - Market size and forecast 2025-2030 ($ million)
Chart on The Netherlands - Year-over-year growth 2025-2030 (%)
Data Table on The Netherlands - Year-over-year growth 2025-2030 (%)

12.5 North America - Market size and forecast 2025-2030

Chart on North America - Market size and forecast 2025-2030 ($ million)
Data Table on North America - Market size and forecast 2025-2030 ($ million)
Chart on North America - Year-over-year growth 2025-2030 (%)
Data Table on North America - Year-over-year growth 2025-2030 (%)
Chart on Regional Comparison - North America
Data Table on Regional Comparison - North America

12.5.1 US - Market size and forecast 2025-2030

Chart on US - Market size and forecast 2025-2030 ($ million)
Data Table on US - Market size and forecast 2025-2030 ($ million)
Chart on US - Year-over-year growth 2025-2030 (%)
Data Table on US - Year-over-year growth 2025-2030 (%)

12.5.2 Canada - Market size and forecast 2025-2030

Chart on Canada - Market size and forecast 2025-2030 ($ million)
Data Table on Canada - Market size and forecast 2025-2030 ($ million)
Chart on Canada - Year-over-year growth 2025-2030 (%)
Data Table on Canada - Year-over-year growth 2025-2030 (%)

12.5.3 Mexico - Market size and forecast 2025-2030

Chart on Mexico - Market size and forecast 2025-2030 ($ million)
Data Table on Mexico - Market size and forecast 2025-2030 ($ million)
Chart on Mexico - Year-over-year growth 2025-2030 (%)
Data Table on Mexico - Year-over-year growth 2025-2030 (%)

12.6 South America - Market size and forecast 2025-2030

Chart on South America - Market size and forecast 2025-2030 ($ million)
Data Table on South America - Market size and forecast 2025-2030 ($ million)
Chart on South America - Year-over-year growth 2025-2030 (%)
Data Table on South America - Year-over-year growth 2025-2030 (%)
Chart on Regional Comparison - South America
Data Table on Regional Comparison - South America

12.6.1 Brazil - Market size and forecast 2025-2030

Chart on Brazil - Market size and forecast 2025-2030 ($ million)
Data Table on Brazil - Market size and forecast 2025-2030 ($ million)
Chart on Brazil - Year-over-year growth 2025-2030 (%)
Data Table on Brazil - Year-over-year growth 2025-2030 (%)

12.6.2 Argentina - Market size and forecast 2025-2030

Chart on Argentina - Market size and forecast 2025-2030 ($ million)
Data Table on Argentina - Market size and forecast 2025-2030 ($ million)
Chart on Argentina - Year-over-year growth 2025-2030 (%)
Data Table on Argentina - Year-over-year growth 2025-2030 (%)

12.6.3 Chile - Market size and forecast 2025-2030

Chart on Chile - Market size and forecast 2025-2030 ($ million)
Data Table on Chile - Market size and forecast 2025-2030 ($ million)
Chart on Chile - Year-over-year growth 2025-2030 (%)
Data Table on Chile - Year-over-year growth 2025-2030 (%)

12.7 Middle East and Africa - Market size and forecast 2025-2030

Chart on Middle East and Africa - Market size and forecast 2025-2030 ($ million)
Data Table on Middle East and Africa - Market size and forecast 2025-2030 ($ million)
Chart on Middle East and Africa - Year-over-year growth 2025-2030 (%)
Data Table on Middle East and Africa - Year-over-year growth 2025-2030 (%)
Chart on Regional Comparison - Middle East and Africa
Data Table on Regional Comparison - Middle East and Africa

12.7.1 Saudi Arabia - Market size and forecast 2025-2030

Chart on Saudi Arabia - Market size and forecast 2025-2030 ($ million)
Data Table on Saudi Arabia - Market size and forecast 2025-2030 ($ million)
Chart on Saudi Arabia - Year-over-year growth 2025-2030 (%)
Data Table on Saudi Arabia - Year-over-year growth 2025-2030 (%)

12.7.2 UAE - Market size and forecast 2025-2030

Chart on UAE - Market size and forecast 2025-2030 ($ million)
Data Table on UAE - Market size and forecast 2025-2030 ($ million)
Chart on UAE - Year-over-year growth 2025-2030 (%)
Data Table on UAE - Year-over-year growth 2025-2030 (%)

12.7.3 South Africa - Market size and forecast 2025-2030

Chart on South Africa - Market size and forecast 2025-2030 ($ million)
Data Table on South Africa - Market size and forecast 2025-2030 ($ million)
Chart on South Africa - Year-over-year growth 2025-2030 (%)
Data Table on South Africa - Year-over-year growth 2025-2030 (%)

12.7.4 Turkey - Market size and forecast 2025-2030

Chart on Turkey - Market size and forecast 2025-2030 ($ million)
Data Table on Turkey - Market size and forecast 2025-2030 ($ million)
Chart on Turkey - Year-over-year growth 2025-2030 (%)
Data Table on Turkey - Year-over-year growth 2025-2030 (%)

12.7.5 Israel - Market size and forecast 2025-2030

Chart on Israel - Market size and forecast 2025-2030 ($ million)
Data Table on Israel - Market size and forecast 2025-2030 ($ million)
Chart on Israel - Year-over-year growth 2025-2030 (%)
Data Table on Israel - Year-over-year growth 2025-2030 (%)

12.8 Market opportunity by geography

Market opportunity by geography ($ million)
Data Tables on Market opportunity by geography ($ million)

13. Drivers, Challenges, and Opportunity

13.1 Market drivers

Implementation of comprehensive circular economy and sustainability
Escalation of smart labeling for supply chain transparency and waste reduction
Advancements in digital printing and variable data personalization

13.2 Market challenges

Severe volatility in essential raw material costs
Digital transformation and technical skill shortages
Stringent sustainability mandates and design for circularity

13.3 Impact of drivers and challenges

Impact of drivers and challenges in 2025 and 2030

13.4 Market opportunities

Evolution of intelligent and connected labeling solutions
Advancements in sustainable materials and circularity initiatives
Integration of digital identification and smart solutions

14. Competitive Landscape

14.1 Overview

14.2

Overview on criticality of inputs and factors of differentiation

14.3 Landscape disruption

Overview on factors of disruption

14.4 Industry risks

Impact of key risks on business

15. Competitive Analysis

15.1 Companies profiled

Companies covered

15.2 Company ranking index

15.3 Market positioning of companies

Matrix on companies position and classification

15.4 Amcor Plc

Amcor Plc - Overview
Amcor Plc - Business segments
Amcor Plc - Key offerings
Amcor Plc - Segment focus
SWOT

15.5 Brady Corp.

Brady Corp. - Overview
Brady Corp. - Business segments
Brady Corp. - Key news
Brady Corp. - Key offerings
Brady Corp. - Segment focus
SWOT

15.6 CCL Industries Inc.

CCL Industries Inc. - Overview
CCL Industries Inc. - Business segments
CCL Industries Inc. - Key offerings
CCL Industries Inc. - Segment focus
SWOT

15.7 Cenveo Worldwide Ltd.

Cenveo Worldwide Ltd. - Overview
Cenveo Worldwide Ltd. - Product / Service
Cenveo Worldwide Ltd. - Key offerings
SWOT

15.8 Consolidated Label Co.

Consolidated Label Co. - Overview
Consolidated Label Co. - Product / Service
Consolidated Label Co. - Key offerings
SWOT

15.9 Essentra Components

Essentra Components - Overview
Essentra Components - Product / Service
Essentra Components - Key offerings
SWOT

15.10 Fuji Seal International Inc.

Fuji Seal International Inc. - Overview
Fuji Seal International Inc. - Product / Service
Fuji Seal International Inc. - Key offerings
SWOT

15.11 HERMA GmbH

HERMA GmbH - Overview
HERMA GmbH - Product / Service
HERMA GmbH - Key offerings
SWOT

15.12 Multi Color Corp.

Multi Color Corp. - Overview
Multi Color Corp. - Product / Service
Multi Color Corp. - Key offerings
SWOT

15.13 OPM Group

OPM Group - Overview
OPM Group - Product / Service
OPM Group - Key offerings
SWOT

15.14 Resource Label Group LLC

Resource Label Group LLC - Overview
Resource Label Group LLC - Product / Service
Resource Label Group LLC - Key offerings
SWOT

15.15 SATO Holdings Corp.

SATO Holdings Corp. - Overview
SATO Holdings Corp. - Product / Service
SATO Holdings Corp. - Key offerings
SWOT

15.16 UPM Kymmene Corp.

UPM Kymmene Corp. - Overview
UPM Kymmene Corp. - Business segments
UPM Kymmene Corp. - Key offerings
UPM Kymmene Corp. - Segment focus
SWOT

15.17 Yorkshire Labels Ltd

Yorkshire Labels Ltd - Overview
Yorkshire Labels Ltd - Product / Service
Yorkshire Labels Ltd - Key offerings
SWOT

15.18 Zebra Technologies Corp.

Zebra Technologies Corp. - Overview
Zebra Technologies Corp. - Business segments
Zebra Technologies Corp. - Key news
Zebra Technologies Corp. - Key offerings
Zebra Technologies Corp. - Segment focus
SWOT

16. Appendix

16.1 Scope of the report

Market definition
Objectives
Notes and caveats

16.2 Inclusions and exclusions checklist

Inclusions checklist
Exclusions checklist

16.3 Currency conversion rates for US$

16.4 Research methodology

16.5 Data procurement

Information sources

16.6 Data validation

16.7 Validation techniques employed for market sizing

16.8 Data synthesis

16.9 360 degree market analysis

16.10 List of abbreviations

Research Methodology

Technavio presents a detailed picture of the market by way of study, synthesis, and summation of data from multiple sources. The analysts have presented the various facets of the market with a particular focus on identifying the key industry influencers. The data thus presented is comprehensive, reliable, and the result of extensive research, both primary and secondary.

INFORMATION SOURCES

Primary sources

  • Manufacturers and suppliers
  • Channel partners
  • Industry experts
  • Strategic decision makers

Secondary sources

  • Industry journals and periodicals
  • Government data
  • Financial reports of key industry players
  • Historical data
  • Press releases

DATA ANALYSIS

Data Synthesis

  • Collation of data
  • Estimation of key figures
  • Analysis of derived insights

Data Validation

  • Triangulation with data models
  • Reference against proprietary databases
  • Corroboration with industry experts

REPORT WRITING

Qualitative

  • Market drivers
  • Market challenges
  • Market trends
  • Five forces analysis

Quantitative

  • Market size and forecast
  • Market segmentation
  • Geographical insights
  • Competitive landscape

Interested in this report?

Get your sample now to see our research methodology and insights!

Download Now

Frequently Asked Questions

Labels market growth will increase by USD 14536.8 million during 2026-2030.

The Labels market is expected to grow at a CAGR of 5.9% during 2026-2030.

Labels market is segmented by End-user (Consumer goods, Cosmetics and personal care, Pharmaceuticals, Others) Type (Pressure-sensitive label, Glue-applied label, Sleeve label, In-mold labels) Material (Plastic and film, Paper, Metal foil, Fabric)

Amcor Plc, Avery Dennison Corp., Brady Corp., CCL Industries Inc., Cenveo Worldwide Ltd., Consolidated Label Co., Denny Bros Ltd., Essentra Components, Fuji Seal International Inc., HERMA GmbH, Multi Color Corp., OPM Group, Resource Label Group LLC, SATO Holdings Corp., Schreiner Group GmbH and Co. KG, UPM Kymmene Corp., Yorkshire Labels Ltd, Zebra Technologies Corp. are a few of the key vendors in the Labels market.

APAC will register the highest growth rate of 48.7% among the other regions. Therefore, the Labels market in APAC is expected to garner significant business opportunities for the vendors during the forecast period.

China, Japan, India, South Korea, Indonesia, Australia, Germany, France, UK, Italy, Spain, The Netherlands, US, Canada, Mexico, Brazil, Argentina, Chile, Saudi Arabia, UAE, South Africa, Turkey, Israel

  • Implementation of comprehensive circular economy and sustainability is the driving factor this market.

The Labels market vendors should focus on grabbing business opportunities from the End-user segment as it accounted for the largest market share in the base year.
RIA - Research AI Assistant
Ask RIA