SCADA Market Analysis APAC, North America, Europe, Middle East and Africa, South America - US, China, Japan, Germany, France - Size and Forecast 2023-2027
| Published: Jan 2023 | Pages: 180 | SKU: IRTNTR43934 |
SCADA Market by End-User, Type and Geography - Forecast 2023-2027
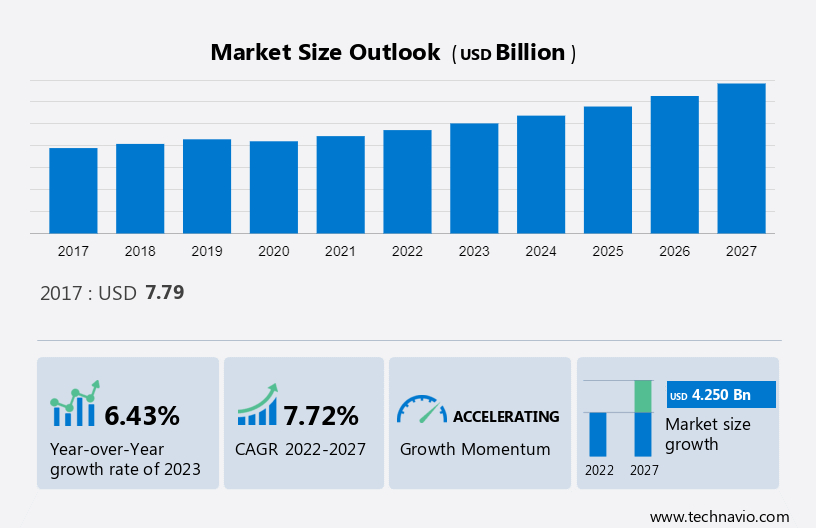
The scada market size is forecast to increase by USD 4.25 billion between 2022 and 2027, accelerating at a CAGR of 7.72%. In 2017, US held the largest market share, projecting an annual revenue of USD 1.7 billion.The report includes a comprehensive outlook on the SCADA Market, offering forecasts for the industry segmented by End-User which comprises Oil and gas, Manufacturing, Power, Water and wastewater treatment, and Others. Additionally, it categorizes Type into Solutions and Services and covers Geography regions, including APAC, North America, Europe, Middle East and Africa, and South America. The report provides market size, historical data spanning from 2017 to 2021, and future projections, all presented in terms of value in (USD billion) for each of the mentioned segments.
What will be the Size of the SCADA Market During the Forecast Period?
To learn more about this report, Download Report Sample
SCADA Market Analysis
The global growth of the supervisory control and data acquisition market is being driven by its increasing adoption in the manufacturing industry. The demand for SCADA is on the rise in countries such as India, China, Taiwan, South Korea, Turkey, South Africa, Brazil, and Mexico due to their economic growth. As manufacturing hubs emerge in these regions, the demand for automation systems, including SCADA, is increasing.
Additionally, there is high demand for automobiles and manufacturing goods in these regions, which is leading to the development of end-user industries and a more complex supply chain. Although the lack of awareness about the cyber security standards can hinder the market growth, the adoption of mobile SCADA helps to reduce this complexity and improve the manufacturing process, which is expected to drive the growth of the supervisory control and data acquisition market in the forecast period.
SCADA Market Segment Trends
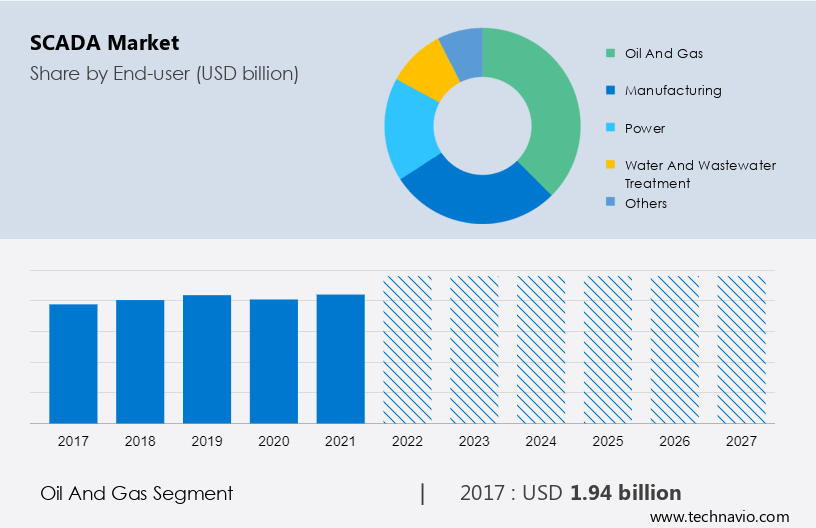
Oil and Gas is the Leading Segment to Dominate the Market
The oil and gas segment was valued at USD 1,936.04 Billion in 2017 and continue to grow by 2021. Cloud-based SCADA systems are gaining popularity in the oil and gas industries. With the cloud-based SCADA, oil, and gas operators of all sizes have a flexible, scalable way to gain insights about their upstream assets without having to invest in on-premise SCADA. Some vendors have started offering cloud-based solutions. Hence, such product launches can influence the growth of the supervisory control and data acquisition market during the forecast period.
SCADA Market - Revenue Share by End-User Segment, 2017 - 2027.
For more details on other segments, Download Sample Report
APAC Holds a Prominent Position in the SCADA Market
APAC is estimated to contribute 43% to the growth of the global market during the forecast period. Technavio’s analysts have elaborately explained the regional trends and drivers that shape the market during the forecast period.
The market is expected to grow at a fast rate in APAC because of the investments and industrial developments in the region. Among the three regions, it is the fastest-growing region because of the presence of industries such as water and wastewater treatment, power, manufacturing, and oil and gas industries. The continuous exploration of oil and gas reserves in countries such as Thailand, China, and Indonesia is one of the major driving factors in increasing demand for SCADA systems in the region. Increasing population, rising urbanization, and growth in income levels of consumers in developing economies such as India and China have increased the demand for oil and gas. All the above factors contribute to the growth of the supervisory control and data acquisition market in the region.
SCADA Market Size, By Region, Global, 2017 - 2021 - 2027.
To understand geographic trends Download Report Sample
SCADA Market Companies Overview
The SCADA Market is fragmented in nature. Some significant players include ABB Ltd.
The research report also includes detailed analyses of the competitive landscape of the market and information about 15 market companies, including:
ALSTOM SA, Capula Ltd., Check Point Software Technologies Ltd., Elynx Technologies LLC, Emerson Electric Co., General Electric Co., Honeywell International Inc., Inductive Automation LLC, JFE Holdings Inc., Mitsubishi Electric Corp., OMRON Corp., Ovak Technologies LLC, Radiflow, Rockwell Automation Inc., Schneider Electric SE, TOSHIBA CORP, Yokogawa Electric Corp., Siemens AG, and Hitachi Ltd.
Segment Overview
The scada market report forecasts market growth by revenue at global, regional & country levels and provides an analysis of the latest trends and growth opportunities from 2017 - 2027.
- End-user Outlook (USD Billion, 2017 - 2027)
- Oil and gas
- Manufacturing
- Power
- Water and wastewater treatment
- Others
- Type Outlook (USD Billion, 2017 - 2027)
- Solution
- Services
- Region Outlook (USD Billion, 2017 - 2027)
- North America
- The U.S.
- Canada
- Europe
- The U.K.
- Germany
- France
- Rest of Europe
- APAC
- China
- India
- South America
- Chile
- Argentina
- Brazil
- Middle East & Africa
- Saudi Arabia
- South Africa
- Rest of the Middle East & Africa
- North America
|
SCADA Market Scope |
|
|
Report Coverage |
Details |
|
Page number |
180 |
|
Base year |
2022 |
|
Historic period |
2017 - 2021 |
|
Forecast period |
2023-2027 |
|
Growth momentum & CAGR |
Accelerate at a CAGR of 7.72% |
|
Market growth 2023-2027 |
USD 4.2 Billion |
|
Market structure |
Fragmented |
|
YoY growth 2022-2023(%) |
6.43 |
|
Regional analysis |
APAC, North America, Europe, Middle East and Africa, and South America |
|
Performing market contribution |
APAC at 43% |
|
Key countries |
US, China, Japan, Germany, and France |
|
Competitive landscape |
Leading Companies, Market Positioning of Companies, Competitive Strategies, and Industry Risks |
|
Key companies profiled |
ABB Ltd., ALSTOM SA, Capula Ltd., Check Point Software Technologies Ltd., Elynx Technologies LLC, Emerson Electric Co., General Electric Co., Honeywell International Inc., Inductive Automation LLC, JFE Holdings Inc., Mitsubishi Electric Corp., OMRON Corp., Ovak Technologies LLC, Radiflow, Rockwell Automation Inc., Schneider Electric SE, TOSHIBA CORP, Yokogawa Electric Corp., Siemens AG, and Hitachi Ltd. |
|
Market dynamics |
Parent market analysis, Market growth inducers and obstacles, Fast-growing and slow-growing segment analysis, COVID 19 impact and recovery analysis and future consumer dynamics, Market condition analysis for forecast period |
|
Customization purview |
If our report has not included the data that you are looking for, you can reach out to our analysts and get segments customized. |
What are the Key Data Covered in this SCADA Market Research Report?
- CAGR of the market during the forecast period
- Detailed information on factors that will drive the growth of the market between 2023 and 2027
- Precise estimation of the size of the market size and its contribution of the market in focus to the parent market
- Accurate predictions about upcoming trends and changes in consumer behaviour
- Growth of the market industry across APAC, North America, Europe, Middle East and Africa, and South America
- Thorough analysis of the market’s competitive landscape and detailed information about companies
- Comprehensive analysis of factors that will challenge the growth of market companies
We can help! Our analysts can customize this market research report to meet your requirements.
1 Executive Summary
- 1.1 Market overview
- Exhibit 01: Executive Summary – Chart on Market Overview
- Exhibit 02: Executive Summary – Data Table on Market Overview
- Exhibit 03: Executive Summary – Chart on Global Market Characteristics
- Exhibit 04: Executive Summary – Chart on Market by Geography
- Exhibit 05: Executive Summary – Chart on Market Segmentation by End-user
- Exhibit 06: Executive Summary – Chart on Market Segmentation by Type
- Exhibit 07: Executive Summary – Chart on Incremental Growth
- Exhibit 08: Executive Summary – Data Table on Incremental Growth
- Exhibit 09: Executive Summary – Chart on Vendor Market Positioning
2 Market Landscape
- 2.1 Market ecosystem
- Exhibit 10: Parent market
- Exhibit 11: Market Characteristics
3 Market Sizing
- 3.1 Market definition
- Exhibit 12: Offerings of vendors included in the market definition
- 3.2 Market segment analysis
- Exhibit 13: Market segments
- 3.3 Market size 2022
- 3.4 Market outlook: Forecast for 2022-2027
- Exhibit 14: Chart on Global - Market size and forecast 2022-2027 ($ million)
- Exhibit 15: Data Table on Global - Market size and forecast 2022-2027 ($ million)
- Exhibit 16: Chart on Global Market: Year-over-year growth 2022-2027 (%)
- Exhibit 17: Data Table on Global Market: Year-over-year growth 2022-2027 (%)
4 Historic Market Size
- 4.1 Global SCADA market 2017 - 2021
- Exhibit 18: Historic Market Size – Data Table on Global SCADA market 2017 - 2021 ($ million)
- 4.2 End-User Segment Analysis 2017 - 2021
- Exhibit 19: Historic Market Size – End-User Segment 2017 - 2021 ($ million)
- 4.3 Type Segment Analysis 2017 - 2021
- Exhibit 20: Historic Market Size – Type Segment 2017 - 2021 ($ million)
- 4.4 Geography Segment Analysis 2017 - 2021
- Exhibit 21: Historic Market Size – Geography Segment 2017 - 2021 ($ million)
- 4.5 Country Segment Analysis 2017 - 2021
- Exhibit 22: Historic Market Size – Country Segment 2017 - 2021 ($ million)
5 Five Forces Analysis
- 5.1 Five forces summary
- Exhibit 23: Five forces analysis - Comparison between 2022 and 2027
- 5.2 Bargaining power of buyers
- Exhibit 24: Chart on Bargaining power of buyers – Impact of key factors 2022 and 2027
- 5.3 Bargaining power of suppliers
- Exhibit 25: Bargaining power of suppliers – Impact of key factors in 2022 and 2027
- 5.4 Threat of new entrants
- Exhibit 26: Threat of new entrants – Impact of key factors in 2022 and 2027
- 5.5 Threat of substitutes
- Exhibit 27: Threat of substitutes – Impact of key factors in 2022 and 2027
- 5.6 Threat of rivalry
- Exhibit 28: Threat of rivalry – Impact of key factors in 2022 and 2027
- 5.7 Market condition
- Exhibit 29: Chart on Market condition - Five forces 2022 and 2027
6 Market Segmentation by End-user
- 6.1 Market segments
- Exhibit 30: Chart on End-user - Market share 2022-2027 (%)
- Exhibit 31: Data Table on End-user - Market share 2022-2027 (%)
- 6.2 Comparison by End-user
- Exhibit 32: Chart on Comparison by End-user
- Exhibit 33: Data Table on Comparison by End-user
- 6.3 Oil and gas - Market size and forecast 2022-2027
- Exhibit 34: Chart on Oil and gas - Market size and forecast 2022-2027 ($ million)
- Exhibit 35: Data Table on Oil and gas - Market size and forecast 2022-2027 ($ million)
- Exhibit 36: Chart on Oil and gas - Year-over-year growth 2022-2027 (%)
- Exhibit 37: Data Table on Oil and gas - Year-over-year growth 2022-2027 (%)
- 6.4 Manufacturing - Market size and forecast 2022-2027
- Exhibit 38: Chart on Manufacturing - Market size and forecast 2022-2027 ($ million)
- Exhibit 39: Data Table on Manufacturing - Market size and forecast 2022-2027 ($ million)
- Exhibit 40: Chart on Manufacturing - Year-over-year growth 2022-2027 (%)
- Exhibit 41: Data Table on Manufacturing - Year-over-year growth 2022-2027 (%)
- 6.5 Power - Market size and forecast 2022-2027
- Exhibit 42: Chart on Power - Market size and forecast 2022-2027 ($ million)
- Exhibit 43: Data Table on Power - Market size and forecast 2022-2027 ($ million)
- Exhibit 44: Chart on Power - Year-over-year growth 2022-2027 (%)
- Exhibit 45: Data Table on Power - Year-over-year growth 2022-2027 (%)
- 6.6 Water and wastewater treatment - Market size and forecast 2022-2027
- Exhibit 46: Chart on Water and wastewater treatment - Market size and forecast 2022-2027 ($ million)
- Exhibit 47: Data Table on Water and wastewater treatment - Market size and forecast 2022-2027 ($ million)
- Exhibit 48: Chart on Water and wastewater treatment - Year-over-year growth 2022-2027 (%)
- Exhibit 49: Data Table on Water and wastewater treatment - Year-over-year growth 2022-2027 (%)
- 6.7 Others - Market size and forecast 2022-2027
- Exhibit 50: Chart on Others - Market size and forecast 2022-2027 ($ million)
- Exhibit 51: Data Table on Others - Market size and forecast 2022-2027 ($ million)
- Exhibit 52: Chart on Others - Year-over-year growth 2022-2027 (%)
- Exhibit 53: Data Table on Others - Year-over-year growth 2022-2027 (%)
- 6.8 Market opportunity by End-user
- Exhibit 54: Market opportunity by End-user ($ million)
7 Market Segmentation by Type
- 7.1 Market segments
- Exhibit 55: Chart on Type - Market share 2022-2027 (%)
- Exhibit 56: Data Table on Type - Market share 2022-2027 (%)
- 7.2 Comparison by Type
- Exhibit 57: Chart on Comparison by Type
- Exhibit 58: Data Table on Comparison by Type
- 7.3 Solution - Market size and forecast 2022-2027
- Exhibit 59: Chart on Solution - Market size and forecast 2022-2027 ($ million)
- Exhibit 60: Data Table on Solution - Market size and forecast 2022-2027 ($ million)
- Exhibit 61: Chart on Solution - Year-over-year growth 2022-2027 (%)
- Exhibit 62: Data Table on Solution - Year-over-year growth 2022-2027 (%)
- 7.4 Services - Market size and forecast 2022-2027
- Exhibit 63: Chart on Services - Market size and forecast 2022-2027 ($ million)
- Exhibit 64: Data Table on Services - Market size and forecast 2022-2027 ($ million)
- Exhibit 65: Chart on Services - Year-over-year growth 2022-2027 (%)
- Exhibit 66: Data Table on Services - Year-over-year growth 2022-2027 (%)
- 7.5 Market opportunity by Type
- Exhibit 67: Market opportunity by Type ($ million)
8 Customer Landscape
- 8.1 Customer landscape overview
- Exhibit 68: Analysis of price sensitivity, lifecycle, customer purchase basket, adoption rates, and purchase criteria
9 Geographic Landscape
- 9.1 Geographic segmentation
- Exhibit 69: Chart on Market share by geography 2022-2027 (%)
- Exhibit 70: Data Table on Market share by geography 2022-2027 (%)
- 9.2 Geographic comparison
- Exhibit 71: Chart on Geographic comparison
- Exhibit 72: Data Table on Geographic comparison
- 9.3 APAC - Market size and forecast 2022-2027
- Exhibit 73: Chart on APAC - Market size and forecast 2022-2027 ($ million)
- Exhibit 74: Data Table on APAC - Market size and forecast 2022-2027 ($ million)
- Exhibit 75: Chart on APAC - Year-over-year growth 2022-2027 (%)
- Exhibit 76: Data Table on APAC - Year-over-year growth 2022-2027 (%)
- 9.4 North America - Market size and forecast 2022-2027
- Exhibit 77: Chart on North America - Market size and forecast 2022-2027 ($ million)
- Exhibit 78: Data Table on North America - Market size and forecast 2022-2027 ($ million)
- Exhibit 79: Chart on North America - Year-over-year growth 2022-2027 (%)
- Exhibit 80: Data Table on North America - Year-over-year growth 2022-2027 (%)
- 9.5 Europe - Market size and forecast 2022-2027
- Exhibit 81: Chart on Europe - Market size and forecast 2022-2027 ($ million)
- Exhibit 82: Data Table on Europe - Market size and forecast 2022-2027 ($ million)
- Exhibit 83: Chart on Europe - Year-over-year growth 2022-2027 (%)
- Exhibit 84: Data Table on Europe - Year-over-year growth 2022-2027 (%)
- 9.6 Middle East and Africa - Market size and forecast 2022-2027
- Exhibit 85: Chart on Middle East and Africa - Market size and forecast 2022-2027 ($ million)
- Exhibit 86: Data Table on Middle East and Africa - Market size and forecast 2022-2027 ($ million)
- Exhibit 87: Chart on Middle East and Africa - Year-over-year growth 2022-2027 (%)
- Exhibit 88: Data Table on Middle East and Africa - Year-over-year growth 2022-2027 (%)
- 9.7 South America - Market size and forecast 2022-2027
- Exhibit 89: Chart on South America - Market size and forecast 2022-2027 ($ million)
- Exhibit 90: Data Table on South America - Market size and forecast 2022-2027 ($ million)
- Exhibit 91: Chart on South America - Year-over-year growth 2022-2027 (%)
- Exhibit 92: Data Table on South America - Year-over-year growth 2022-2027 (%)
- 9.8 US - Market size and forecast 2022-2027
- Exhibit 93: Chart on US - Market size and forecast 2022-2027 ($ million)
- Exhibit 94: Data Table on US - Market size and forecast 2022-2027 ($ million)
- Exhibit 95: Chart on US - Year-over-year growth 2022-2027 (%)
- Exhibit 96: Data Table on US - Year-over-year growth 2022-2027 (%)
- 9.9 China - Market size and forecast 2022-2027
- Exhibit 97: Chart on China - Market size and forecast 2022-2027 ($ million)
- Exhibit 98: Data Table on China - Market size and forecast 2022-2027 ($ million)
- Exhibit 99: Chart on China - Year-over-year growth 2022-2027 (%)
- Exhibit 100: Data Table on China - Year-over-year growth 2022-2027 (%)
- 9.10 Japan - Market size and forecast 2022-2027
- Exhibit 101: Chart on Japan - Market size and forecast 2022-2027 ($ million)
- Exhibit 102: Data Table on Japan - Market size and forecast 2022-2027 ($ million)
- Exhibit 103: Chart on Japan - Year-over-year growth 2022-2027 (%)
- Exhibit 104: Data Table on Japan - Year-over-year growth 2022-2027 (%)
- 9.11 Germany - Market size and forecast 2022-2027
- Exhibit 105: Chart on Germany - Market size and forecast 2022-2027 ($ million)
- Exhibit 106: Data Table on Germany - Market size and forecast 2022-2027 ($ million)
- Exhibit 107: Chart on Germany - Year-over-year growth 2022-2027 (%)
- Exhibit 108: Data Table on Germany - Year-over-year growth 2022-2027 (%)
- 9.12 France - Market size and forecast 2022-2027
- Exhibit 109: Chart on France - Market size and forecast 2022-2027 ($ million)
- Exhibit 110: Data Table on France - Market size and forecast 2022-2027 ($ million)
- Exhibit 111: Chart on France - Year-over-year growth 2022-2027 (%)
- Exhibit 112: Data Table on France - Year-over-year growth 2022-2027 (%)
- 9.13 Market opportunity by geography
- Exhibit 113: Market opportunity by geography ($ million)
10 Drivers, Challenges, and Trends
- 10.1 Market drivers
- 10.2 Market challenges
- 10.3 Impact of drivers and challenges
- Exhibit 114: Impact of drivers and challenges in 2022 and 2027
- 10.4 Market trends
11 Vendor Landscape
- 11.1 Overview
- 11.2 Vendor landscape
- Exhibit 115: Overview on Criticality of inputs and Factors of differentiation
- 11.3 Landscape disruption
- Exhibit 116: Overview on factors of disruption
- 11.4 Industry risks
- Exhibit 117: Impact of key risks on business
12 Vendor Analysis
- 12.1 Vendors covered
- Exhibit 118: Vendors covered
- 12.2 Market positioning of vendors
- Exhibit 119: Matrix on vendor position and classification
- 12.3 ABB Ltd.
- Exhibit 120: ABB Ltd. - Overview
- Exhibit 121: ABB Ltd. - Business segments
- Exhibit 122: ABB Ltd. - Key news
- Exhibit 123: ABB Ltd. - Key offerings
- Exhibit 124: ABB Ltd. - Segment focus
- 12.4 ALSTOM SA
- Exhibit 125: ALSTOM SA - Overview
- Exhibit 126: ALSTOM SA - Business segments
- Exhibit 127: ALSTOM SA - Key news
- Exhibit 128: ALSTOM SA - Key offerings
- Exhibit 129: ALSTOM SA - Segment focus
- 12.5 Check Point Software Technologies Ltd.
- Exhibit 130: Check Point Software Technologies Ltd. - Overview
- Exhibit 131: Check Point Software Technologies Ltd. - Product / Service
- Exhibit 132: Check Point Software Technologies Ltd. - Key offerings
- 12.6 Emerson Electric Co.
- Exhibit 133: Emerson Electric Co. - Overview
- Exhibit 134: Emerson Electric Co. - Business segments
- Exhibit 135: Emerson Electric Co. - Key news
- Exhibit 136: Emerson Electric Co. - Key offerings
- Exhibit 137: Emerson Electric Co. - Segment focus
- 12.7 General Electric Co.
- Exhibit 138: General Electric Co. - Overview
- Exhibit 139: General Electric Co. - Business segments
- Exhibit 140: General Electric Co. - Key news
- Exhibit 141: General Electric Co. - Key offerings
- Exhibit 142: General Electric Co. - Segment focus
- 12.8 Hitachi Ltd.
- Exhibit 143: Hitachi Ltd. - Overview
- Exhibit 144: Hitachi Ltd. - Business segments
- Exhibit 145: Hitachi Ltd. - Key news
- Exhibit 146: Hitachi Ltd. - Key offerings
- Exhibit 147: Hitachi Ltd. - Segment focus
- 12.9 Honeywell International Inc.
- Exhibit 148: Honeywell International Inc. - Overview
- Exhibit 149: Honeywell International Inc. - Business segments
- Exhibit 150: Honeywell International Inc. - Key news
- Exhibit 151: Honeywell International Inc. - Key offerings
- Exhibit 152: Honeywell International Inc. - Segment focus
- 12.10 JFE Holdings Inc.
- Exhibit 153: JFE Holdings Inc. - Overview
- Exhibit 154: JFE Holdings Inc. - Business segments
- Exhibit 155: JFE Holdings Inc. - Key offerings
- Exhibit 156: JFE Holdings Inc. - Segment focus
- 12.11 Mitsubishi Electric Corp.
- Exhibit 157: Mitsubishi Electric Corp. - Overview
- Exhibit 158: Mitsubishi Electric Corp. - Business segments
- Exhibit 159: Mitsubishi Electric Corp. - Key news
- Exhibit 160: Mitsubishi Electric Corp. - Key offerings
- Exhibit 161: Mitsubishi Electric Corp. - Segment focus
- 12.12 OMRON Corp.
- Exhibit 162: OMRON Corp. - Overview
- Exhibit 163: OMRON Corp. - Business segments
- Exhibit 164: OMRON Corp. - Key news
- Exhibit 165: OMRON Corp. - Key offerings
- Exhibit 166: OMRON Corp. - Segment focus
- 12.13 Rockwell Automation Inc.
- Exhibit 167: Rockwell Automation Inc. - Overview
- Exhibit 168: Rockwell Automation Inc. - Business segments
- Exhibit 169: Rockwell Automation Inc. - Key news
- Exhibit 170: Rockwell Automation Inc. - Key offerings
- Exhibit 171: Rockwell Automation Inc. - Segment focus
- 12.14 Schneider Electric SE
- Exhibit 172: Schneider Electric SE - Overview
- Exhibit 173: Schneider Electric SE - Business segments
- Exhibit 174: Schneider Electric SE - Key news
- Exhibit 175: Schneider Electric SE - Key offerings
- Exhibit 176: Schneider Electric SE - Segment focus
- 12.15 Siemens AG
- Exhibit 177: Siemens AG - Overview
- Exhibit 178: Siemens AG - Business segments
- Exhibit 179: Siemens AG - Key news
- Exhibit 180: Siemens AG - Key offerings
- Exhibit 181: Siemens AG - Segment focus
- 12.16 TOSHIBA CORP
- Exhibit 182: TOSHIBA CORP - Overview
- Exhibit 183: TOSHIBA CORP - Business segments
- Exhibit 184: TOSHIBA CORP - Key offerings
- Exhibit 185: TOSHIBA CORP - Segment focus
- 12.17 Yokogawa Electric Corp.
- Exhibit 186: Yokogawa Electric Corp. - Overview
- Exhibit 187: Yokogawa Electric Corp. - Business segments
- Exhibit 188: Yokogawa Electric Corp. - Key offerings
- Exhibit 189: Yokogawa Electric Corp. - Segment focus
13 Appendix
- 13.1 Scope of the report
- 13.2 Inclusions and exclusions checklist
- Exhibit 190: Inclusions checklist
- Exhibit 191: Exclusions checklist
- 13.3 Currency conversion rates for US$
- Exhibit 192: Currency conversion rates for US$
- 13.4 Research methodology
- Exhibit 193: Research methodology
- Exhibit 194: Validation techniques employed for market sizing
- Exhibit 195: Information sources
- 13.5 List of abbreviations
- Exhibit 196: List of abbreviations
Research Framework
Technavio presents a detailed picture of the market by way of study, synthesis, and summation of data from multiple sources. The analysts have presented the various facets of the market with a particular focus on identifying the key industry influencers. The data thus presented is comprehensive, reliable, and the result of extensive research, both primary and secondary.
INFORMATION SOURCES
Primary sources
- Manufacturers and suppliers
- Channel partners
- Industry experts
- Strategic decision makers
Secondary sources
- Industry journals and periodicals
- Government data
- Financial reports of key industry players
- Historical data
- Press releases
DATA ANALYSIS
Data Synthesis
- Collation of data
- Estimation of key figures
- Analysis of derived insights
Data Validation
- Triangulation with data models
- Reference against proprietary databases
- Corroboration with industry experts
REPORT WRITING
Qualitative
- Market drivers
- Market challenges
- Market trends
- Five forces analysis
Quantitative
- Market size and forecast
- Market segmentation
- Geographical insights
- Competitive landscape
PURCHASE FULL REPORT OF
scada market market
Key Questions Answered
- What are the key global market and the regional market share?
- What are the revenue-generating key market segments?
- What are the key factors driving and challenging this market’s growth?
- Who are the key market vendors and their growth strategies?
- What are the latest trends influencing the growth of this market?
- What are the variables influencing the market growth in the primary regions?
- What are the factors influencing the growth of the parent market?
Why should you prefer Technavio's market insights report?
- Off-the-shelf research reports
- Reports can be tailored to meet the customer's needs
- Trusted by more than 100 fortune 500 organizations
- Information about the market's key drivers, trends, and challenges
- Parent market analysis
- Every week, 50,000 people visit our subscription platform
- Detailed vendors report with competitive landscape
- Covid-19 impact and recovery analysis
- Data on revenue-generating market segments
- Details on the market shares of various regions
- Five-force market analysis