Smart Sports Equipment Market Analysis North America, APAC, Europe, South America, Middle East and Africa - US, China, Japan, Germany, UK - Size and Forecast 2023-2027
| Published: Oct 2023 | Pages: 159 | SKU: IRTNTR71731 |
Smart Sports Equipment Market Forecast 2023-2027
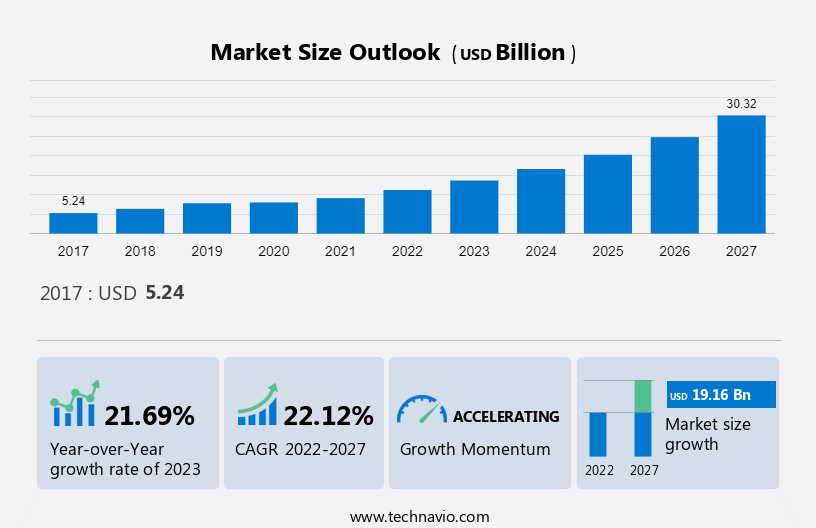
The smart sports equipment market size is forecast to increase by USD 19.16 billion at a compound annual growth rate (CAGR) of 22.12% between 2022 and 2027. The growth of the market depends on several factors, including the increased emphasis on IoT, the increased demand for wearable devices and fitness trackers, and the growing demand for sports analytics. This market report extensively covers market segmentation by distribution channel (offline and online), product (ball, fitness , and other sports), and geography (North America, APAC, Europe, South America, and Middle East and Africa). It also includes an in-depth analysis of drivers, market trends and analysis, and challenges. Furthermore, the report includes historic market data from 2017 to 2021.
To learn more about this report, View Sample PDF
Key Major Companies
Companies are implementing various market growth and forecasting strategies by analyzing factors such as strategic alliances, partnerships, mergers and acquisitions, geographical expansion, and product or service launches, to enhance their presence in the market.
The market report also includes detailed analyses of the competitive landscape of the market and information about 15 market companies, including:
adidas AG, ANTA Sports Products Ltd., BRG Sports Inc., Callaway Golf Co., DribbleUp Inc., EGYM Inc., HYGEAR Inc., InfomotionSports, JingleTek Co. Ltd., Kinexon GmbH, Mizuno Corp, Nike Inc., PUMA SE, Spektacom Technologies Pvt Ltd, Stag International, STATSports Group Ltd., Under Armour Inc., WHOOP Inc., Zepp Health Corp., and Sports Tech Solutions Pte. Ltd.
Companies are implementing various strategies, such as strategic alliances, partnerships, mergers and acquisitions, geographical expansion, and product/service launches, to enhance their presence in the market.
adidas AG: The company offers smart gaming equipment such as miCoach smart ball.
Competitive Landscape: Qualitative and quantitative analysis of market growth and trends of companies has been conducted to help clients understand the wider business environment as well as the strengths and weaknesses of key market players. Data is qualitatively analyzed to categorize companies as pure play, category-focused, industry-focused, and diversified. Furthermore, market growth and forecasting it is also quantitatively analyzed to categorize companies as dominant, leading, strong, tentative, and weak.
Market Dynamic
Our researchers analyzed the market research and growth data with 2022 as the base year, along with the key market growth analysis, trends, and challenges. A holistic analysis of drivers, trends, and challenges will help companies refine their marketing strategies to gain a competitive advantage.
Key Market Driver
One of the key factors driving growth in the market is the increased emphasis on the Internet of Things. Its a pivotal role in collecting various strands of data, such as player performance, player health level, and various other vital information using various equipment such as smartwatches, fitness trackers, as well as connected football and connected basketballs. This further is complemented by the advent of other smart devices, such as smart helmets. Smart helmets play a pivotal role in injury management due to the presence of impact sensors that notify team coaches, medical teams, and team managers about the possibility of a head injury.
As a result, smart helmets are increasingly being developed and deployed by amateur and pro teams seeking to determine when an athlete is exposed to a potential brain injury. IoT technology is also being increasingly used to manage and maintain training equipment. Therefore, this increased use of IoT in the market is further expected to drive the growth of the global market.
Major Market Trends
Increased demand for neurostimulation is the primary trend in the global market growth. Neurostimulation techniques use electrical or magnetic stimulation to increase nerve activity in the body and be beneficial in training and performance. One of the main benefits of neurostimulation technology is that it helps improve strength and endurance. This is especially important for athletes looking to push their physical limits. By stimulating the nerves that control muscle movement, neurostimulation can help athletes train harder and recover faster, resulting in improved performance.
Another benefit of neurostimulation technology is that it can help to reduce pain and fatigue during exercise. By stimulating the nerves that control pain and fatigue, neurostimulation can help athletes push through their limits and perform at their best. In addition to these benefits, there has also been growing interest in the use of neurostimulation technology for cognitive training. Hence, owing to various technological innovations in the global smart sports equipment, neurostimulation is gaining prominence, which, in turn, will drive the growth of the market in focus in the forecast period.
Latest Market Challenge
The premium pricing of smart gaming equipment will be a major challenge for the market during the forecast period. Although these accessories such as fitness trackers, and smartwatches are affordable, with the product cost ranging from USD 15 to USD 30, equipment such as smart baseball bats golf sticks and connected basketballs and footballs fall in the premium-priced segment and cannot be afforded by many individual coaches and small sports teams and are purchased by sports clubs with adequate funding to back up their investments.
Moreover, this challenge is more prominent in developing economies wherein individual athletes, sports teams, and team managers do not have adequate financial resources to purchase and use smart gaming equipment. Hence, companies operating in emerging markets try to increase the adoption of their products by offering discounts and various offers. Hence, the rise in the price of equipment will act as a barrier to the growth of the market in focus in the forecast period.
Get a detailed analysis of drivers, trends, and challenges Request Free PDF Sample !
Market Segmentation and Region
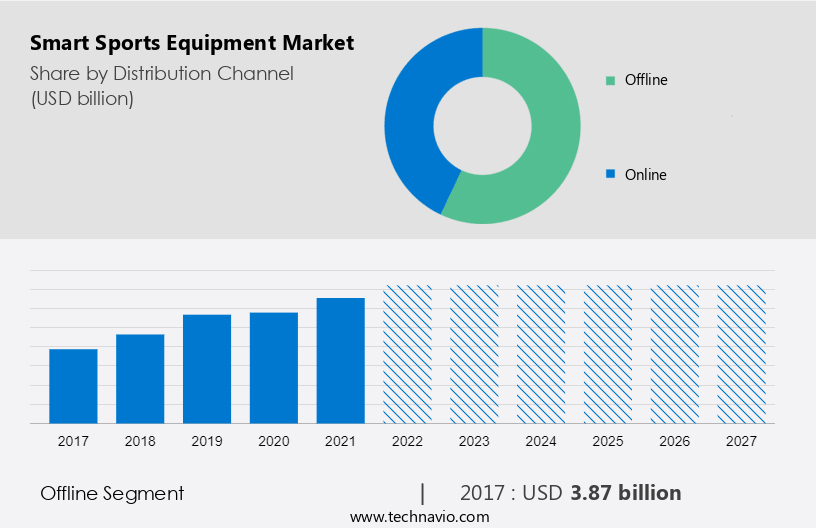
By Distribution Channel: The market share growth by the offline segment will be significant during the forecast period. Based on offline distribution, the global market can be segmented into various categories, including goods stores, Department stores, Specialty stores, Supermarkets/hypermarkets, and Fitness centers /gymnasiums. The offline segment was valued at USD 3.87 billion in 2017 and continued to grow by 2021. Offline distribution channels not only offer customers the opportunity to try products before they buy but also provide a physical location for customer service and support, driving growth in the segment, and thus driving the growth of the market.
To gain further insights on the market contribution of various segments Request a PDF Sample
By Product : The market is segmented into three sub-categories including Ball, Fitness and Other sports.
Geographical Analysis
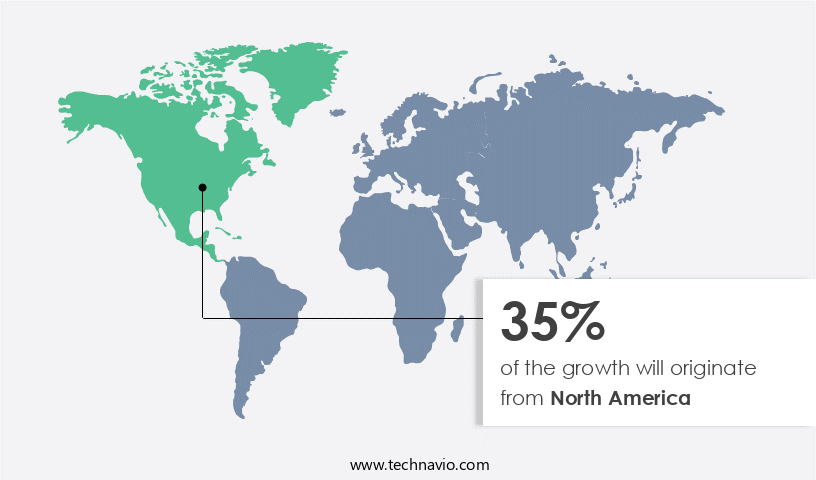
The US and Canada are the largest consumers of smart sporting goods in the region. Various game organizations, federations and sports clubs highlight the use of IoT technology and connected devices such as smart basketballs, smart soccer balls and smart golfers. Increasing demand for digitized devices, such as Wilson X-connected football and various sports analytics platforms from the US game industry, is a key driver of the market.
North America is estimated to contribute 35% during the forecast period.
For more insights on the market share of various regions Request PDF Sample now!
Technavio's analysts have provided extensive insight into the market forecasting, detailing the regional trends and drivers influencing the market's trajectory throughout the forecast period.
Market Analysis
The market is witnessing a dynamic shift driven by the convergence of advanced technologies and changing consumer preferences. With a surge in connected objects and sensor technology, athletic performance is scrutinized through health metrics, especially in ball games like tennis and cricket. Vibration sensors, on-field cameras, and tracking sensors, exemplified by Major League Baseball's StatCast and radar equipment, provide unprecedented insights. As disposable income rises, consumer spending on Wi-Fi compatible features grows. Notable players like Amazon, DICK'S Sporting Goods, and Tennishub capitalize on this trend, leveraging online platforms. The Asia Pacific region, led by innovations such as StanceBeam and their cricket bat sensor Striker further propels the market. Real-time data analytics, exemplified by InfoMotion Sports Technologies and Zepp Labs, redefine shot analysis, setting the stage for a vibrant future in the sports analytics market.
|
Market Scope |
|
|
Report Coverage |
Details |
|
Page number |
120 |
|
Base year |
2022 |
|
Forecast period |
2023-2027 |
|
Growth momentum & CAGR |
Accelerate at a CAGR of 22.12% |
|
Market growth 2023-2027 |
USD 19159.7 million |
|
Market structure |
Fragmented |
|
YoY growth (%) |
21.69 |
|
Regional analysis |
North America, APAC, Europe, South America, and Middle East and Africa |
|
Performing market contribution |
North America at 35% |
|
Key consumer countries |
US, China, Japan, Germany, and UK |
|
Competitive landscape |
Leading companies, Competitive Strategies, Consumer engagement scope |
|
Key companies profiled |
Adidas AG, ANTA Sports Products Ltd., BRG Sports Inc., Callaway Golf Co., DribbleUp Inc., EGYM Inc., HYGEAR Inc., InfomotionSports, JingleTek Co. Ltd., Kinexon GmbH, Mizuno Corp, Nike Inc., PUMA SE, Spektacom Technologies Pvt Ltd, Stag International, STATSports Group Ltd., Under Armour Inc., WHOOP Inc., Zepp Health Corp., and Sports Tech Solutions Pte. Ltd. |
|
Market dynamics |
Parent market analysis, Market growth inducers and obstacles, Fast-growing and slow-growing segment analysis, COVID 19 impact and recovery analysis and future consumer dynamics, Market condition analysis for forecast period |
|
Customization purview |
If our report has not included the data that you are looking for, you can reach out to our analysts and get segments customized. |
Research Analyst View:
The smart sports equipment market is experiencing a transformative shift, driven by advancements in sensor technology and a growing emphasis on fitness and athletic performance. This trend spans various ball games, including golf sticks, tennis rackets, cricket bats, and even equipment used in Major League Baseball with innovations like StatCast. With increasing disposable income and the penetration of emerging markets, there's a rising demand for smart sports gear, encompassing golf sticks, balls, basketballs, footballs, and soccer balls. Major players such as Wilson Sporting Goods, Dick's Sporting Goods, and Academy Sports stores, along with online giants like Amazon and Apple stores, are capitalizing on this trend. The presence of specialized stores, including franchise stores and specialty outlets, further amplifies the accessibility of these products. The integration of IoT technology, exemplified by products like StanceBeam Striker from InfoMotion Sports Technologies, is reshaping the landscape by providing real-time insights and enhancing the overall sporting experience. The convergence of digital media, online distribution channels, and increasing internet penetration is propelling the smart sports equipment market into a new era of innovation and accessibility.
What are the Key Data Covered in this Market Research Report?
- CAGR of the market forecast during the forecast period
- Detailed information on factors that will drive the growth of the market between 2023 and 2027
- Precise estimation of the size of the market size and its contribution of the market in focus to the parent market
- Accurate predictions about upcoming trends and changes in consumer behavior
- Growth of the market industry across North America, APAC, Europe, South America, and Middle East and Africa
- Thorough market analysis and report of the market’s competitive landscape and detailed information about companies
- Comprehensive analysis of factors that will challenge the growth of market companies
We can help! Our analysts can customize this market research report to meet your requirements. Get in touch
1 Executive Summary
- 1.1 Market overview
- Exhibit 01: Executive Summary – Chart on Market Overview
- Exhibit 02: Executive Summary – Data Table on Market Overview
- Exhibit 03: Executive Summary – Chart on Global Market Characteristics
- Exhibit 04: Executive Summary – Chart on Market by Geography
- Exhibit 05: Executive Summary – Chart on Market Segmentation by Distribution Channel
- Exhibit 06: Executive Summary – Chart on Market Segmentation by Product
- Exhibit 07: Executive Summary – Chart on Incremental Growth
- Exhibit 08: Executive Summary – Data Table on Incremental Growth
- Exhibit 09: Executive Summary – Chart on Vendor Market Positioning
2 Market Landscape
- 2.1 Market ecosystem
- Exhibit 10: Parent market
- Exhibit 11: Market Characteristics
3 Market Sizing
- 3.1 Market definition
- Exhibit 12: Offerings of vendors included in the market definition
- 3.2 Market segment analysis
- Exhibit 13: Market segments
- 3.3 Market size 2022
- 3.4 Market outlook: Forecast for 2022-2027
- Exhibit 14: Chart on Global - Market size and forecast 2022-2027 ($ billion)
- Exhibit 15: Data Table on Global - Market size and forecast 2022-2027 ($ billion)
- Exhibit 16: Chart on Global Market: Year-over-year growth 2022-2027 (%)
- Exhibit 17: Data Table on Global Market: Year-over-year growth 2022-2027 (%)
4 Historic Market Size
- 4.1 Global smart sports equipment market 2017 - 2021
- Exhibit 18: Historic Market Size – Data Table on Global smart sports equipment market 2017 - 2021 ($ billion)
- 4.2 Distribution channel Segment Analysis 2017 - 2021
- Exhibit 19: Historic Market Size – Distribution channel Segment 2017 - 2021 ($ billion)
- 4.3 Product Segment Analysis 2017 - 2021
- Exhibit 20: Historic Market Size – Product Segment 2017 - 2021 ($ billion)
- 4.4 Geography Segment Analysis 2017 - 2021
- Exhibit 21: Historic Market Size – Geography Segment 2017 - 2021 ($ billion)
- 4.5 Country Segment Analysis 2017 - 2021
- Exhibit 22: Historic Market Size – Country Segment 2017 - 2021 ($ billion)
5 Five Forces Analysis
- 5.1 Five forces summary
- Exhibit 23: Five forces analysis - Comparison between 2022 and 2027
- 5.2 Bargaining power of buyers
- Exhibit 24: Chart on Bargaining power of buyers – Impact of key factors 2022 and 2027
- 5.3 Bargaining power of suppliers
- Exhibit 25: Bargaining power of suppliers – Impact of key factors in 2022 and 2027
- 5.4 Threat of new entrants
- Exhibit 26: Threat of new entrants – Impact of key factors in 2022 and 2027
- 5.5 Threat of substitutes
- Exhibit 27: Threat of substitutes – Impact of key factors in 2022 and 2027
- 5.6 Threat of rivalry
- Exhibit 28: Threat of rivalry – Impact of key factors in 2022 and 2027
- 5.7 Market condition
- Exhibit 29: Chart on Market condition - Five forces 2022 and 2027
6 Market Segmentation by Distribution Channel
- 6.1 Market segments
- Exhibit 30: Chart on Distribution Channel - Market share 2022-2027 (%)
- Exhibit 31: Data Table on Distribution Channel - Market share 2022-2027 (%)
- 6.2 Comparison by Distribution Channel
- Exhibit 32: Chart on Comparison by Distribution Channel
- Exhibit 33: Data Table on Comparison by Distribution Channel
- 6.3 Offline - Market size and forecast 2022-2027
- Exhibit 34: Chart on Offline - Market size and forecast 2022-2027 ($ billion)
- Exhibit 35: Data Table on Offline - Market size and forecast 2022-2027 ($ billion)
- Exhibit 36: Chart on Offline - Year-over-year growth 2022-2027 (%)
- Exhibit 37: Data Table on Offline - Year-over-year growth 2022-2027 (%)
- 6.4 Online - Market size and forecast 2022-2027
- Exhibit 38: Chart on Online - Market size and forecast 2022-2027 ($ billion)
- Exhibit 39: Data Table on Online - Market size and forecast 2022-2027 ($ billion)
- Exhibit 40: Chart on Online - Year-over-year growth 2022-2027 (%)
- Exhibit 41: Data Table on Online - Year-over-year growth 2022-2027 (%)
- 6.5 Market opportunity by Distribution Channel
- Exhibit 42: Market opportunity by Distribution Channel ($ billion)
- Exhibit 43: Data Table on Market opportunity by Distribution Channel ($ billion)
7 Market Segmentation by Product
- 7.1 Market segments
- Exhibit 44: Chart on Product - Market share 2022-2027 (%)
- Exhibit 45: Data Table on Product - Market share 2022-2027 (%)
- 7.2 Comparison by Product
- Exhibit 46: Chart on Comparison by Product
- Exhibit 47: Data Table on Comparison by Product
- 7.3 Ball sports - Market size and forecast 2022-2027
- Exhibit 48: Chart on Ball sports - Market size and forecast 2022-2027 ($ billion)
- Exhibit 49: Data Table on Ball sports - Market size and forecast 2022-2027 ($ billion)
- Exhibit 50: Chart on Ball sports - Year-over-year growth 2022-2027 (%)
- Exhibit 51: Data Table on Ball sports - Year-over-year growth 2022-2027 (%)
- 7.4 Fitness sports - Market size and forecast 2022-2027
- Exhibit 52: Chart on Fitness sports - Market size and forecast 2022-2027 ($ billion)
- Exhibit 53: Data Table on Fitness sports - Market size and forecast 2022-2027 ($ billion)
- Exhibit 54: Chart on Fitness sports - Year-over-year growth 2022-2027 (%)
- Exhibit 55: Data Table on Fitness sports - Year-over-year growth 2022-2027 (%)
- 7.5 Other sports - Market size and forecast 2022-2027
- Exhibit 56: Chart on Other sports - Market size and forecast 2022-2027 ($ billion)
- Exhibit 57: Data Table on Other sports - Market size and forecast 2022-2027 ($ billion)
- Exhibit 58: Chart on Other sports - Year-over-year growth 2022-2027 (%)
- Exhibit 59: Data Table on Other sports - Year-over-year growth 2022-2027 (%)
- 7.6 Market opportunity by Product
- Exhibit 60: Market opportunity by Product ($ billion)
- Exhibit 61: Data Table on Market opportunity by Product ($ billion)
8 Customer Landscape
- 8.1 Customer landscape overview
- Exhibit 62: Analysis of price sensitivity, lifecycle, customer purchase basket, adoption rates, and purchase criteria
9 Geographic Landscape
- 9.1 Geographic segmentation
- Exhibit 63: Chart on Market share by geography 2022-2027 (%)
- Exhibit 64: Data Table on Market share by geography 2022-2027 (%)
- 9.2 Geographic comparison
- Exhibit 65: Chart on Geographic comparison
- Exhibit 66: Data Table on Geographic comparison
- 9.3 North America - Market size and forecast 2022-2027
- Exhibit 67: Chart on North America - Market size and forecast 2022-2027 ($ billion)
- Exhibit 68: Data Table on North America - Market size and forecast 2022-2027 ($ billion)
- Exhibit 69: Chart on North America - Year-over-year growth 2022-2027 (%)
- Exhibit 70: Data Table on North America - Year-over-year growth 2022-2027 (%)
- 9.4 APAC - Market size and forecast 2022-2027
- Exhibit 71: Chart on APAC - Market size and forecast 2022-2027 ($ billion)
- Exhibit 72: Data Table on APAC - Market size and forecast 2022-2027 ($ billion)
- Exhibit 73: Chart on APAC - Year-over-year growth 2022-2027 (%)
- Exhibit 74: Data Table on APAC - Year-over-year growth 2022-2027 (%)
- 9.5 Europe - Market size and forecast 2022-2027
- Exhibit 75: Chart on Europe - Market size and forecast 2022-2027 ($ billion)
- Exhibit 76: Data Table on Europe - Market size and forecast 2022-2027 ($ billion)
- Exhibit 77: Chart on Europe - Year-over-year growth 2022-2027 (%)
- Exhibit 78: Data Table on Europe - Year-over-year growth 2022-2027 (%)
- 9.6 South America - Market size and forecast 2022-2027
- Exhibit 79: Chart on South America - Market size and forecast 2022-2027 ($ billion)
- Exhibit 80: Data Table on South America - Market size and forecast 2022-2027 ($ billion)
- Exhibit 81: Chart on South America - Year-over-year growth 2022-2027 (%)
- Exhibit 82: Data Table on South America - Year-over-year growth 2022-2027 (%)
- 9.7 Middle East and Africa - Market size and forecast 2022-2027
- Exhibit 83: Chart on Middle East and Africa - Market size and forecast 2022-2027 ($ billion)
- Exhibit 84: Data Table on Middle East and Africa - Market size and forecast 2022-2027 ($ billion)
- Exhibit 85: Chart on Middle East and Africa - Year-over-year growth 2022-2027 (%)
- Exhibit 86: Data Table on Middle East and Africa - Year-over-year growth 2022-2027 (%)
- 9.8 US - Market size and forecast 2022-2027
- Exhibit 87: Chart on US - Market size and forecast 2022-2027 ($ billion)
- Exhibit 88: Data Table on US - Market size and forecast 2022-2027 ($ billion)
- Exhibit 89: Chart on US - Year-over-year growth 2022-2027 (%)
- Exhibit 90: Data Table on US - Year-over-year growth 2022-2027 (%)
- 9.9 China - Market size and forecast 2022-2027
- Exhibit 91: Chart on China - Market size and forecast 2022-2027 ($ billion)
- Exhibit 92: Data Table on China - Market size and forecast 2022-2027 ($ billion)
- Exhibit 93: Chart on China - Year-over-year growth 2022-2027 (%)
- Exhibit 94: Data Table on China - Year-over-year growth 2022-2027 (%)
- 9.10 Japan - Market size and forecast 2022-2027
- Exhibit 95: Chart on Japan - Market size and forecast 2022-2027 ($ billion)
- Exhibit 96: Data Table on Japan - Market size and forecast 2022-2027 ($ billion)
- Exhibit 97: Chart on Japan - Year-over-year growth 2022-2027 (%)
- Exhibit 98: Data Table on Japan - Year-over-year growth 2022-2027 (%)
- 9.11 Germany - Market size and forecast 2022-2027
- Exhibit 99: Chart on Germany - Market size and forecast 2022-2027 ($ billion)
- Exhibit 100: Data Table on Germany - Market size and forecast 2022-2027 ($ billion)
- Exhibit 101: Chart on Germany - Year-over-year growth 2022-2027 (%)
- Exhibit 102: Data Table on Germany - Year-over-year growth 2022-2027 (%)
- 9.12 UK - Market size and forecast 2022-2027
- Exhibit 103: Chart on UK - Market size and forecast 2022-2027 ($ billion)
- Exhibit 104: Data Table on UK - Market size and forecast 2022-2027 ($ billion)
- Exhibit 105: Chart on UK - Year-over-year growth 2022-2027 (%)
- Exhibit 106: Data Table on UK - Year-over-year growth 2022-2027 (%)
- 9.13 Market opportunity by geography
- Exhibit 107: Market opportunity by geography ($ billion)
- Exhibit 108: Data Tables on Market opportunity by geography ($ billion)
10 Drivers, Challenges, and Trends
- 10.1 Market drivers
- 10.2 Market challenges
- 10.3 Impact of drivers and challenges
- Exhibit 109: Impact of drivers and challenges in 2022 and 2027
- 10.4 Market trends
11 Vendor Landscape
- 11.1 Overview
- 11.2 Vendor landscape
- Exhibit 110: Overview on Criticality of inputs and Factors of differentiation
- 11.3 Landscape disruption
- Exhibit 111: Overview on factors of disruption
- 11.4 Industry risks
- Exhibit 112: Impact of key risks on business
12 Vendor Analysis
- 12.1 Vendors covered
- Exhibit 113: Vendors covered
- 12.2 Market positioning of vendors
- Exhibit 114: Matrix on vendor position and classification
- 12.3 Adidas AG
- Exhibit 115: Adidas AG - Overview
- Exhibit 116: Adidas AG - Business segments
- Exhibit 117: Adidas AG - Key news
- Exhibit 118: Adidas AG - Key offerings
- Exhibit 119: Adidas AG - Segment focus
- 12.4 ANTA Sports Products Ltd.
- Exhibit 120: ANTA Sports Products Ltd. - Overview
- Exhibit 121: ANTA Sports Products Ltd. - Business segments
- Exhibit 122: ANTA Sports Products Ltd. - Key news
- Exhibit 123: ANTA Sports Products Ltd. - Key offerings
- Exhibit 124: ANTA Sports Products Ltd. - Segment focus
- 12.5 BRG Sports Inc.
- Exhibit 125: BRG Sports Inc. - Overview
- Exhibit 126: BRG Sports Inc. - Product / Service
- Exhibit 127: BRG Sports Inc. - Key offerings
- 12.6 DribbleUp Inc.
- Exhibit 128: DribbleUp Inc. - Overview
- Exhibit 129: DribbleUp Inc. - Product / Service
- Exhibit 130: DribbleUp Inc. - Key offerings
- 12.7 EGYM Inc.
- Exhibit 131: EGYM Inc. - Overview
- Exhibit 132: EGYM Inc. - Product / Service
- Exhibit 133: EGYM Inc. - Key offerings
- 12.8 HYGEAR Inc.
- Exhibit 134: HYGEAR Inc. - Overview
- Exhibit 135: HYGEAR Inc. - Product / Service
- Exhibit 136: HYGEAR Inc. - Key offerings
- 12.9 InfomotionSports
- Exhibit 137: InfomotionSports - Overview
- Exhibit 138: InfomotionSports - Product / Service
- Exhibit 139: InfomotionSports - Key offerings
- 12.10 Kinexon GmbH
- Exhibit 140: Kinexon GmbH - Overview
- Exhibit 141: Kinexon GmbH - Product / Service
- Exhibit 142: Kinexon GmbH - Key offerings
- 12.11 Mizuno Corp
- Exhibit 143: Mizuno Corp - Overview
- Exhibit 144: Mizuno Corp - Business segments
- Exhibit 145: Mizuno Corp - Key offerings
- Exhibit 146: Mizuno Corp - Segment focus
- 12.12 PUMA SE
- Exhibit 147: PUMA SE - Overview
- Exhibit 148: PUMA SE - Business segments
- Exhibit 149: PUMA SE - Key news
- Exhibit 150: PUMA SE - Key offerings
- Exhibit 151: PUMA SE - Segment focus
- 12.13 Spektacom Technologies Pvt Ltd
- Exhibit 152: Spektacom Technologies Pvt Ltd - Overview
- Exhibit 153: Spektacom Technologies Pvt Ltd - Product / Service
- Exhibit 154: Spektacom Technologies Pvt Ltd - Key offerings
- 12.14 Stag International
- Exhibit 155: Stag International - Overview
- Exhibit 156: Stag International - Product / Service
- Exhibit 157: Stag International - Key offerings
- 12.15 STATSports Group Ltd.
- Exhibit 158: STATSports Group Ltd. - Overview
- Exhibit 159: STATSports Group Ltd. - Product / Service
- Exhibit 160: STATSports Group Ltd. - Key offerings
- 12.16 Under Armour Inc.
- Exhibit 161: Under Armour Inc. - Overview
- Exhibit 162: Under Armour Inc. - Business segments
- Exhibit 163: Under Armour Inc. - Key offerings
- Exhibit 164: Under Armour Inc. - Segment focus
- 12.17 Zepp Health Corp.
- Exhibit 165: Zepp Health Corp. - Overview
- Exhibit 166: Zepp Health Corp. - Business segments
- Exhibit 167: Zepp Health Corp. - Key offerings
- Exhibit 168: Zepp Health Corp. - Segment focus
13 Appendix
- 13.1 Scope of the report
- 13.2 Inclusions and exclusions checklist
- Exhibit 169: Inclusions checklist
- Exhibit 170: Exclusions checklist
- 13.3 Currency conversion rates for US$
- Exhibit 171: Currency conversion rates for US$
- 13.4 Research methodology
- Exhibit 172: Research methodology
- Exhibit 173: Validation techniques employed for market sizing
- Exhibit 174: Information sources
- 13.5 List of abbreviations
- Exhibit 175: List of abbreviations
Research Framework
Technavio presents a detailed picture of the market by way of study, synthesis, and summation of data from multiple sources. The analysts have presented the various facets of the market with a particular focus on identifying the key industry influencers. The data thus presented is comprehensive, reliable, and the result of extensive research, both primary and secondary.
INFORMATION SOURCES
Primary sources
- Manufacturers and suppliers
- Channel partners
- Industry experts
- Strategic decision makers
Secondary sources
- Industry journals and periodicals
- Government data
- Financial reports of key industry players
- Historical data
- Press releases
DATA ANALYSIS
Data Synthesis
- Collation of data
- Estimation of key figures
- Analysis of derived insights
Data Validation
- Triangulation with data models
- Reference against proprietary databases
- Corroboration with industry experts
REPORT WRITING
Qualitative
- Market drivers
- Market challenges
- Market trends
- Five forces analysis
Quantitative
- Market size and forecast
- Market segmentation
- Geographical insights
- Competitive landscape
PURCHASE FULL REPORT OF
smart sports equipment market market
Key Questions Answered
- What are the key global market and the regional market share?
- What are the revenue-generating key market segments?
- What are the key factors driving and challenging this market’s growth?
- Who are the key market vendors and their growth strategies?
- What are the latest trends influencing the growth of this market?
- What are the variables influencing the market growth in the primary regions?
- What are the factors influencing the growth of the parent market?
Why should you prefer Technavio's market insights report?
- Off-the-shelf research reports
- Reports can be tailored to meet the customer's needs
- Trusted by more than 100 fortune 500 organizations
- Information about the market's key drivers, trends, and challenges
- Parent market analysis
- Every week, 50,000 people visit our subscription platform
- Detailed vendors report with competitive landscape
- Covid-19 impact and recovery analysis
- Data on revenue-generating market segments
- Details on the market shares of various regions
- Five-force market analysis