Content Marketing Market 2025-2029

What We Offer in this Sample:

Content Marketing Market 2025-2029

Base Year: 2024

1. INTRODUCTION

1.1 Research Objective

1.2 Market Scope

2. Market Segmentation

2.1 End-user

2.1.2 Retail

2.2 Geography

3. Market Landscape

3.1 Market Overview

3.2 Market Sizing

3.3 Drivers, Trends, & Challenges

3.4 Market Characteristics

4. Customer Landscape

4.1 Customer Landscape Overview

5. Competitive Landscape

5.1 Companies Covered

5.2 Company Positioning

5.2.1 Uplandsoftware com

5.2.2 Overview on factors of disruption

6. Research Methodology

6.1 Value Chain Analysis

6.2 Research Approach

6.3 Information Sources

6.4 Validation Techniques

7. Appendix

7.1 Key Questions Answered

7.2 TOC & LOE

7.3 Customization Available

7.4 About Technavio & Disclaimer

SAMPLE - Content Marketing Market 2025-2029

Research Objective

  • Define, depict, and forecast the worldwide Contenting, categorized by end-user, platform, objective, geography, enterprise size, content type, deployment type and technology integration, with in-depth analysis of regional and national markets with their historic region wise segment data.
  • Understand market dynamics, including historical data, factual insights, current market size, and future growth projections, while addressing key benefits and industry-specific challenges.
  • Identify primary drivers, challenges, and emerging trends to help businesses navigate market shifts effectively and seize new opportunities.
  • Evaluate the competitive landscape and company positioning, offering actionable insights for strategic collaborations and maintaining a competitive edge.
  • Monitor and analyze competitive advancements, such as partnerships, mergers, acquisitions, product innovations, market expansions, AI Impact of Market Trends and R&D activities shaping the Contenting.

1.2 Market Scope

Page number 233
List of Charts & Table 260
Historic period 2019 - 2023
Forecast period 2025-2029
Market growth 2025-2029 USD 539.3 million
YoY growth 2022-2023 (%) 12.2


Unlock the full report within minutes

SAMPLE - Content Marketing Market 2025-2029
Regional Analysis
  • APAC
  • North America
  • Europe
  • South America
  • Middle East and Africa
Regional Contribution
  • North America at 36%
Segment Overview
  • End-user
    • Retail
    • Automotive
    • Financial services
    • Telecom
    • Others
  • Platform
    • Blogging
    • Videos
    • Infographics
    • Case studies
    • Others
  • Objective
    • Lead generation
    • Brand awareness
    • Thought leadership
    • Others
  • Geography
    • APAC
    • North America
    • Europe
    • South America
    • Middle East and Africa
  • Enterprise Size
    • Large Enterprises
    • Small and Medium Enterprises (SMEs)
  • Content Type
    • Social Media Content
    • Email Marketing
    • Whitepapers
    • Podcasts
  • Deployment Type
    • On-premise
    • Cloud-based solutions
  • Technology Integration
    • AI-driven
    • Non-AI-driven
Exclusive Research on Customer Landscape
  • Drivers of Price Sensitivity
    • Purchases are undifferentiated
    • Purchase is a key cost to the buyer
    • Quality is not important
    • Price sensitivity
  • Adoption Lifecycle
    • Adoption lifecycle
    • Innovator
    • Early adopters
    • Late majority
    • Laggards
  • Adoption Rates
    • North America
    • APAC
    • Europe
    • South America
  • Key Purchase Criteria
    • Price
    • Quality
    • Service
    • Reliability
    • Innovation
    • Regulatory compliance


Unlock the full report within minutes

02

Market Segmentation

2.1 End-user

2.1.2 Retail

2.2 Geography

SAMPLE - Content Marketing Market 2025-2029

Graph on End-user - Market share 2019 - 2024 (%)

  • The Market is divided into different segment such as end-user, platform and objective .The end-user segment is further segmented into, retail, automotive, financial services, telecom, and others.


Unlock the full report within minutes

SAMPLE - Content Marketing Market 2025-2029

Retail - Market size and forecast 2019 - 2029 (USD Mn)

2019: USD 108.70 Mn

The retail segment includes distribution channels and all types of omnichannel companies, such as branded wholesalers with retail outlets, traditional retailers, grocery store retail operators, convenience store retail operators, and other retail operators. The benefits of content marketing in the retail segment are listed below:


Unlock the full report within minutes

SAMPLE - Content Marketing Market 2025-2029

Market share by geography % (USD Mn)

  • The region market share is widely explained from 2019 to 2029 along with highest region contributor mentioned in our reports.​
  • Region and country wise segment analysis; historic (2019 to 2023) and forecast 2025-2029
  • Furthermost our reports explain pandemic, recession and AI impact on the market.​


Unlock the full report within minutes

SAMPLE - Content Marketing Market 2025-2029

Chart on North America - Market size and forecast 2019 - 2029 (USD mn)

2019: USD 165.20 Mn

The demand for content marketing is expected to grow in APAC, primarily due to its increasing demand from sectors such as automotive, financial service, consumer electronics, and health and pharma.


Unlock the full report within minutes

SAMPLE - Content Marketing Market 2025-2029

APAC - Year-over-year growth 2024 - 2029 period.​ (%)

[The chart serves as a sample presentation; for the actual values, please buy the full report.]

  • APAC being the largest country sharing in market size for the forecast period 2024 - 2029.​
  • The chart provide the forecast of CAGR and the incremental growth value for the 2024 - 2029 period.​


Unlock the full report within minutes

03

Market Landscape

3.1 Market Overview

3.2 Market Sizing

3.3 Drivers, Trends, & Challenges

3.4 Market Characteristics

3.5 Porter’s Five Summary & Analysis

SAMPLE - Content Marketing Market 2025-2029
  • The report provides a forecast and historical analysis for the global Contenting with precise information on countries involved during the 2025-2029 period. The market is expected to grow at a CAGR of 13.9% by 2029.
  • Our reports covers in-depth forecast and historical geographical segment analysis with major regions such as APAC,North America,Europe,South America,Middle East and Africa showing the highest market size​.
  • The market is fragmentation with several players involved and expected to change the market structure if the industry consolidation or some vendors exit from the market.
  • To assess the supply side and the demand side challenges faced by vendors in the market, the interplay of inputs for vendors with the differentiated product and service outputs as presented to the customer are analyzed. The most important inputs for vendors in the Contenting are capex and technology.


Unlock the full report within minutes

SAMPLE - Content Marketing Market 2025-2029

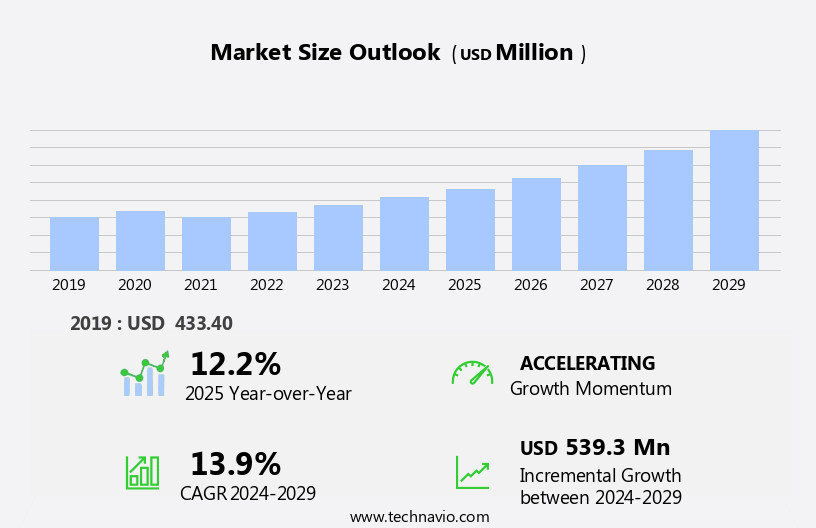
Chart on Global - Market size and forecast 2019-2029 (USD mn)

Historic Data 2019 - 2024 (USD mn ) Forecasted Data 2024 - 2029 (USD mn )

In the realm of business marketing, content marketing signifies the strategic process of generating and disseminating valuable content to captivate and engage with the target audience, ultimately enhancing brand reputation. This approach employs various channels, including digital platforms, in-person events, mobile applications, and social media, to attract potential customers and foster loyalty among existing ones. A well-planned content marketing strategy leverages consumer insights, data analysis, and AI-powered automation to optimize content advertising and deliver personalized experiences. Client involvement is paramount, ensuring the alignment of marketing efforts with business objectives.

  • Technavio reports elaborately highlights the historic market size from 2019 to 2024. Furthermost we also provide the forecast till 2029 with in-depth market share and their CAGR.​
  • We also have 10+ specific vendor with their key offering and product/service segments in specific.​​


Unlock the full report within minutes

SAMPLE - Content Marketing Market 2025-2029

Factors that define the market characteristics

[The chart serves as a sample presentation; for the actual values, please buy the full report.]

The reports include market characteristics that have been analyzed considering:


  • The market lifecycle stages are comprehensively defined, progressing from innovation to growth and eventually reaching maturity.​
  • In 2019, the market was characterized as fragmentation, and it is projected to remain fragmented through 2029​.
  • Our reports provide detailed insights into the external factors impacting the market, both in 2019 and in the forecast period up to 2029. Key factors such as regulatory control and disruption threats are thoroughly analyzed. Additionally, we evaluate the intensity of their impact on the market during the 2025-2029 forecast period, categorizing it as high, medium, or low


Unlock the full report within minutes

SAMPLE - Content Marketing Market 2025-2029

Five Forces Summary - Comparison between 2024-2029

[The chart serves as a sample presentation; for the actual values, please buy the full report.]

2024
2029


Unlock the full report within minutes

SAMPLE - Content Marketing Market 2025-2029

Five Force Analysis


Bargaining Power Of Buyers

  • Number of vendors that offer the product or service
  • Product or service differentiation
  • Purchase volumes of buyers
  • Variations in the cost of products or services provided by vendors
  • Criticality of the product or service for buyers
  • Availability of substitute products or services
  • Buyers’ ability to switch to a substitute product or service
  • Impact of product or service quality on the output of buyers
  • Threat of backward integration by buyers

Bargaining Power Of Suppliers

  • Number of suppliers that offer the product or service
  • Product or service differentiation
  • Purchase volume of vendors
  • Variations in the cost of products or services provided by suppliers
  • Criticality of the product or service for vendors
  • Availability of substitute products or services
  • Vendors’ ability to switch to a substitute product or service
  • Impact of product or service quality on the output of vendors
  • Threat of forward integration by suppliers
  • Supplier dependency on industry

Threat Of New Entrants

  • Economies of scale of established vendors
  • Product or service differentiation
  • Capital requirements
  • Access to distribution channels
  • Regulatory control

Threat of substitutes

  • Availability of substitutes
  • Buyers’ cost of switching to substitutes
  • Relative price performance of substitutes
  • Buyer propensity to shift to substitutes
  • Differentiation of substitutes

Threat Of Rivalry

  • Number of vendors
  • Parity across vendors in terms of size and power
  • Industry growth stage
  • Product or service differentiation
  • Cost of switching products or services
  • Fixed costs
  • Overcapacity and price reduction
  • Exit barriers


Unlock the full report within minutes

04

Customer Landscape

4.1 Customer Landscape Overview

SAMPLE - Content Marketing Market 2025-2029

Exclusive Research Report on Customer Landscape by Technavio

[The chart serves as a sample presentation; for the actual values, please buy the full report.]

  • Technavio analysts has done in depth research on Customer Landscape which covers the Life stages, adoption rate and key purchase factors along with drivers impact on price sensitivity.
  • Furthermost our reports provide a detailed Lifecycle stages from innovation to laggards and their region wise adoption rates for the forecast period of 2025-2029


Unlock the full report within minutes

05

Competitive Landscape

5.1 Companies Covered

5.2 Company Positioning

5.2.1 Uplandsoftware com

5.2.2 Overview on factors of disruption

SAMPLE - Content Marketing Market 2025-2029
  • Companies are included in the report based on their offerings in the Contenting. They are identified based on their revenues, market dominance, geographical presence, product portfolio, and financials. 20 important companies in the Contenting have been covered in this report.
  • For all the 20 companies, the revenue from the Contenting contributes to the overall revenue of the vendor but is not a key component of the companies revenue and hence all companies have been classified as contributing on the influence index.
  • Majority of the companies covered are classified as contributing on the influence index, changes in the market dynamics may not significantly impact the business prospects of companies in the Contenting.
SAMPLE - Content Marketing Market 2025-2029

Exclusively research by Technavio

Company Market Positioning

  • Technavio analysts provided the matrix showing the market  positioning and the classification  of this market.
  • The majority of the companies covered are classified as contributing on the influence index, changes in the market dynamics may not significantly impact the business prospects of companies in the Contenting.

1: Adobe Inc.11: HubSpot Inc.
2: Aghreni Technologies Pvt. Ltd.12: Influence and Co.
3: Alma Media Corp.13: Interact Marketing
4: Brafton Inc.14: IZEA Worldwide Inc.
5: Contently Inc.15: NewsCred
6: Contentoo B.V.16: Rock Content
7: CoSchedule LLC17: Seismic Software Inc.
8: Curata Inc.18: Skyword Inc.
9: DivvyHQ19: Sprinklr Inc.
10: Hootsuite Inc.20: Upland Software Inc.


Unlock the full report within minutes

SAMPLE - Content Marketing Market 2025-2029


Segment Name

Description

Unified

Under this segment the company provides cloud based enterprise work management software solutions.

SAMPLE - Content Marketing Market 2025-2029

The potential for the disruption of the market landscape was moderate in 2024, and its threat is expected to remain unchanged by 2029.


[The chart serves as a sample presentation; for the actual values, please buy the full report.]


Unlock the full report within minutes

06

Research Methodology

6.1 Value Chain Analysis

6.2 Research Approach

6.3 Information Sources

6.4 Validation Techniques

SAMPLE - Content Marketing Market 2025-2029

07

Appendix

7.1 Key Questions Answered

7.2 TOC & LOE

7.3 Customization Available

7.4 About Technavio & Disclaimer

SAMPLE - Content Marketing Market 2025-2029

Market Analysis

  • What are the key drivers, inhibitors, and trends in the Content Marketing Market 2025-2029?
  • How do the five forces impact the market?
  • What are the adoption rates of Contenting in different regions?
  • What are the factors influencing buyers’ price sensitivity?

Technavio's Exclusive Insights

  • What are the factors considered by buyers when purchasing Contenting?
  • What is the criticality of inputs for vendors?
  • What are the factors of differentiation for vendors?
  • What are the disruptive sources in the market?
  • What are the factors driving disruption?
  • What is the threat of disruption?
SAMPLE - Content Marketing Market 2025-2029

1 Executive Summary

  • 1.1 Market overview

    • Executive Summary - Chart on Market Overview
    • Executive Summary - Data Table on Market Overview
    • Executive Summary - Chart on Global Market Characteristics
    • Executive Summary - Chart on Market by Geography
    • Executive Summary - Chart on Market Segmentation by End-user
    • Executive Summary - Chart on Market Segmentation by Platform
    • Executive Summary - Chart on Market Segmentation by Objective
    • Executive Summary - Chart on Incremental Growth
    • Executive Summary - Data Table on Incremental Growth
    • Executive Summary - Chart on Company Market Positioning

2 Technavio Analysis

  • 2.1 Analysis of price sensitivity, lifecycle, customer purchase basket, adoption rates, and purchase criteria

    • Analysis of price sensitivity, lifecycle, customer purchase basket, adoption rates, and purchase criteria

  • 2.2 Criticality of inputs and Factors of differentiation

    • Overview on criticality of inputs and factors of differentiation

  • 2.3 Factors of disruption

    • Overview on factors of disruption

  • 2.4 Impact of drivers and challenges

    • Impact of drivers and challenges in 2024 and 2029

3 Market Landscape

  • 3.1 Market ecosystem

    • Parent Market
    • Data Table on - Parent Market

  • 3.2 Market characteristics

    • Market characteristics analysis

  • 3.3 Value chain analysis

    • Value chain analysis

4 Market Sizing

  • 4.1 Market definition

    • Offerings of companies included in the market definition

  • 4.2 Market segment analysis

    • Market segments

  • 4.3 Market size 2024

    • 4.4 Market outlook: Forecast for 2024-2029

      • Chart on Global - Market size and forecast 2024-2029 ($ million)
      • Data Table on Global - Market size and forecast 2024-2029 ($ million)
      • Chart on Global Market: Year-over-year growth 2024-2029 (%)
      • Data Table on Global Market: Year-over-year growth 2024-2029 (%)

    5 Historic Market Size

    • 5.1 Global Content Marketing Market 2019 - 2023

      • Historic Market Size - Data Table on Global Content Marketing Market 2019 - 2023 ($ million)

    • 5.2 End-user segment analysis 2019 - 2023

      • Historic Market Size - End-user Segment 2019 - 2023 ($ million)

    • 5.3 Platform segment analysis 2019 - 2023

      • Historic Market Size - Platform Segment 2019 - 2023 ($ million)

    • 5.4 Objective segment analysis 2019 - 2023

      • Historic Market Size - Objective Segment 2019 - 2023 ($ million)

    • 5.5 Geography segment analysis 2019 - 2023

      • Historic Market Size - Geography Segment 2019 - 2023 ($ million)

    • 5.6 Country segment analysis 2019 - 2023

      • Historic Market Size - Country Segment 2019 - 2023 ($ million)


    SAMPLE - Content Marketing Market 2025-2029

    6 Qualitative Analysis

    • 6.1 The impact of AI in Global Content Marketing Market

    7 Five Forces Analysis

    • 7.1 Five forces summary

      • Five forces analysis - Comparison between 2024 and 2029

    • 7.2 Bargaining power of buyers

      • Bargaining power of buyers - Impact of key factors 2024 and 2029

    • 7.3 Bargaining power of suppliers

      • Bargaining power of suppliers - Impact of key factors in 2024 and 2029

    • 7.4 Threat of new entrants

      • Threat of new entrants - Impact of key factors in 2024 and 2029

    • 7.5 Threat of substitutes

      • Threat of substitutes - Impact of key factors in 2024 and 2029

    • 7.6 Threat of rivalry

      • Threat of rivalry - Impact of key factors in 2024 and 2029

    • 7.7 Market condition

      • Chart on Market condition - Five forces 2024 and 2029

    8 Market Segmentation by End-user

    • 8.1 Market segments

      • Chart on End-user - Market share (2024-2029) (%)
      • Data Table on End-user - Market share (2024-2029) (%)

    • 8.2 Comparison by End-user

      • Chart on Comparison by End-user
      • Data Table on Comparison by End-user

    • 8.3 Retail - Market size and forecast (2024-2029)

      • Chart on Retail - Market size and forecast (2024-2029) ($ million)
      • Data Table on Retail - Market size and forecast (2024-2029) ($ million)
      • Chart on Retail - Year-over-year growth (2024-2029) (%)
      • Data Table on Retail - Year-over-year growth (2024-2029) (%)

    • 8.4 Automotive - Market size and forecast (2024-2029)

      • Chart on Automotive - Market size and forecast (2024-2029) ($ million)
      • Data Table on Automotive - Market size and forecast (2024-2029) ($ million)
      • Chart on Automotive - Year-over-year growth (2024-2029) (%)
      • Data Table on Automotive - Year-over-year growth (2024-2029) (%)

    • 8.5 Financial services - Market size and forecast (2024-2029)

      • Chart on Financial services - Market size and forecast (2024-2029) ($ million)
      • Data Table on Financial services - Market size and forecast (2024-2029) ($ million)
      • Chart on Financial services - Year-over-year growth (2024-2029) (%)
      • Data Table on Financial services - Year-over-year growth (2024-2029) (%)

    • 8.6 Telecom - Market size and forecast (2024-2029)

      • Chart on Telecom - Market size and forecast (2024-2029) ($ million)
      • Data Table on Telecom - Market size and forecast (2024-2029) ($ million)
      • Chart on Telecom - Year-over-year growth (2024-2029) (%)
      • Data Table on Telecom - Year-over-year growth (2024-2029) (%)

    • 8.7 Others - Market size and forecast (2024-2029)

      • Chart on Others - Market size and forecast (2024-2029) ($ million)
      • Data Table on Others - Market size and forecast (2024-2029) ($ million)
      • Chart on Others - Year-over-year growth (2024-2029) (%)
      • Data Table on Others - Year-over-year growth (2024-2029) (%)

    • 8.8 Market opportunity by End-user

      • Market opportunity by End-user ($ million)
      • Data Table on Market opportunity by End-user ($ million)

    9 Market Segmentation by Platform

    • 9.1 Market segments

      • Chart on Platform - Market share (2024-2029) (%)
      • Data Table on Platform - Market share (2024-2029) (%)

    • 9.2 Comparison by Platform

      • Chart on Comparison by Platform
      • Data Table on Comparison by Platform

    • 9.3 Blogging - Market size and forecast (2024-2029)

      • Chart on Blogging - Market size and forecast (2024-2029) ($ million)
      • Data Table on Blogging - Market size and forecast (2024-2029) ($ million)
      • Chart on Blogging - Year-over-year growth (2024-2029) (%)
      • Data Table on Blogging - Year-over-year growth (2024-2029) (%)

  • 9.4 Videos - Market size and forecast (2024-2029)

    • Chart on Videos - Market size and forecast (2024-2029) ($ million)
    • Data Table on Videos - Market size and forecast (2024-2029) ($ million)
    • Chart on Videos - Year-over-year growth (2024-2029) (%)
    • Data Table on Videos - Year-over-year growth (2024-2029) (%)
    • 9.5 Infographics - Market size and forecast (2024-2029)

      • Chart on Infographics - Market size and forecast (2024-2029) ($ million)
      • Data Table on Infographics - Market size and forecast (2024-2029) ($ million)
      • Chart on Infographics - Year-over-year growth (2024-2029) (%)
      • Data Table on Infographics - Year-over-year growth (2024-2029) (%)

    • 9.6 Case studies - Market size and forecast (2024-2029)

      • Chart on Case studies - Market size and forecast (2024-2029) ($ million)
      • Data Table on Case studies - Market size and forecast (2024-2029) ($ million)
      • Chart on Case studies - Year-over-year growth (2024-2029) (%)
      • Data Table on Case studies - Year-over-year growth (2024-2029) (%)

    • 9.7 Others - Market size and forecast (2024-2029)

      • Chart on Others - Market size and forecast (2024-2029) ($ million)
      • Data Table on Others - Market size and forecast (2024-2029) ($ million)
      • Chart on Others - Year-over-year growth (2024-2029) (%)
      • Data Table on Others - Year-over-year growth (2024-2029) (%)

    • 9.8 Market opportunity by Platform

      • Market opportunity by Platform ($ million)
      • Data Table on Market opportunity by Platform ($ million)

    10 Market Segmentation by Objective

    • 10.1 Market segments

      • Chart on Objective - Market share (2024-2029) (%)
      • Data Table on Objective - Market share (2024-2029) (%)

    • 10.2 Comparison by Objective

      • Chart on Comparison by Objective
      • Data Table on Comparison by Objective

    • 10.3 Lead generation - Market size and forecast (2024-2029)

      • Chart on Lead generation - Market size and forecast (2024-2029) ($ million)
      • Data Table on Lead generation - Market size and forecast (2024-2029) ($ million)
      • Chart on Lead generation - Year-over-year growth (2024-2029) (%)
      • Data Table on Lead generation - Year-over-year growth (2024-2029) (%)

    • 10.4 Brand awareness - Market size and forecast (2024-2029)

      • Chart on Brand awareness - Market size and forecast (2024-2029) ($ million)
      • Data Table on Brand awareness - Market size and forecast (2024-2029) ($ million)
      • Chart on Brand awareness - Year-over-year growth (2024-2029) (%)
      • Data Table on Brand awareness - Year-over-year growth (2024-2029) (%)

    • 10.5 Thought leadership - Market size and forecast (2024-2029)

      • Chart on Thought leadership - Market size and forecast (2024-2029) ($ million)
      • Data Table on Thought leadership - Market size and forecast (2024-2029) ($ million)
      • Chart on Thought leadership - Year-over-year growth (2024-2029) (%)
      • Data Table on Thought leadership - Year-over-year growth (2024-2029) (%)

    • 10.6 Others - Market size and forecast (2024-2029)

      • Chart on Others - Market size and forecast (2024-2029) ($ million)
      • Data Table on Others - Market size and forecast (2024-2029) ($ million)
      • Chart on Others - Year-over-year growth (2024-2029) (%)
      • Data Table on Others - Year-over-year growth (2024-2029) (%)

    • 10.7 Market opportunity by Objective

      • Market opportunity by Objective ($ million)
      • Data Table on Market opportunity by Objective ($ million)

    11 Market Segmentation by Enterprise Size

    • 11.1 Market segments

      • Chart on Enterprise Size - Market share (2024-2029) (%)
      • Data Table on Enterprise Size - Market share (2024-2029) (%)

    • 11.2 Comparison by Enterprise Size

      • Chart on Comparison by Enterprise Size
      • Data Table on Comparison by Enterprise Size

    • 11.3 Large Enterprises - Market size and forecast (2024-2029)

      • Chart on Large Enterprises - Market size and forecast (2024-2029) ($ million)
      • Data Table on Large Enterprises - Market size and forecast (2024-2029) ($ million)
      • Chart on Large Enterprises - Year-over-year growth (2024-2029) (%)
      • Data Table on Large Enterprises - Year-over-year growth (2024-2029) (%)

    • 11.4 Small and Medium Enterprises (SMEs) - Market size and forecast (2024-2029)

      • Chart on Small and Medium Enterprises (SMEs) - Market size and forecast (2024-2029) ($ million)
      • Data Table on Small and Medium Enterprises (SMEs) - Market size and forecast (2024-2029) ($ million)
      • Chart on Small and Medium Enterprises (SMEs) - Year-over-year growth (2024-2029) (%)
      • Data Table on Small and Medium Enterprises (SMEs) - Year-over-year growth (2024-2029) (%)

    • 11.5 Market opportunity by Enterprise Size

      • Market opportunity by Enterprise Size ($ million)
      • Data Table on Market opportunity by Enterprise Size ($ million)


    SAMPLE - Content Marketing Market 2025-2029

    12 Market Segmentation by Content Type

    • 12.1 Market segments

      • Chart on Content Type - Market share (2024-2029) (%)
      • Data Table on Content Type - Market share (2024-2029) (%)

    • 12.2 Comparison by Content Type

      • Chart on Comparison by Content Type
      • Data Table on Comparison by Content Type

    • 12.3 Social Media Content - Market size and forecast (2024-2029)

      • Chart on Social Media Content - Market size and forecast (2024-2029) ($ million)
      • Data Table on Social Media Content - Market size and forecast (2024-2029) ($ million)
      • Chart on Social Media Content - Year-over-year growth (2024-2029) (%)
      • Data Table on Social Media Content - Year-over-year growth (2024-2029) (%)

    • 12.4 Email Marketing - Market size and forecast (2024-2029)

      • Chart on Email Marketing - Market size and forecast (2024-2029) ($ million)
      • Data Table on Email Marketing - Market size and forecast (2024-2029) ($ million)
      • Chart on Email Marketing - Year-over-year growth (2024-2029) (%)
      • Data Table on Email Marketing - Year-over-year growth (2024-2029) (%)

    • 12.5 Whitepapers - Market size and forecast (2024-2029)

      • Chart on Whitepapers - Market size and forecast (2024-2029) ($ million)
      • Data Table on Whitepapers - Market size and forecast (2024-2029) ($ million)
      • Chart on Whitepapers - Year-over-year growth (2024-2029) (%)
      • Data Table on Whitepapers - Year-over-year growth (2024-2029) (%)

    • 12.6 Podcasts - Market size and forecast (2024-2029)

      • Chart on Podcasts - Market size and forecast (2024-2029) ($ million)
      • Data Table on Podcasts - Market size and forecast (2024-2029) ($ million)
      • Chart on Podcasts - Year-over-year growth (2024-2029) (%)
      • Data Table on Podcasts - Year-over-year growth (2024-2029) (%)

    • 12.7 Market opportunity by Content Type

      • Market opportunity by Content Type ($ million)
      • Data Table on Market opportunity by Content Type ($ million)

    13 Market Segmentation by Deployment Type

    • 13.1 Market segments

      • Chart on Deployment Type - Market share (2024-2029) (%)
      • Data Table on Deployment Type - Market share (2024-2029) (%)

    • 13.2 Comparison by Deployment Type

      • Chart on Comparison by Deployment Type
      • Data Table on Comparison by Deployment Type

    • 13.3 On-premise - Market size and forecast (2024-2029)

      • Chart on On-premise - Market size and forecast (2024-2029) ($ million)
      • Data Table on On-premise - Market size and forecast (2024-2029) ($ million)
      • Chart on On-premise - Year-over-year growth (2024-2029) (%)
      • Data Table on On-premise - Year-over-year growth (2024-2029) (%)

    • 13.4 Cloud-based solutions - Market size and forecast (2024-2029)

      • Chart on Cloud-based solutions - Market size and forecast (2024-2029) ($ million)
      • Data Table on Cloud-based solutions - Market size and forecast (2024-2029) ($ million)
      • Chart on Cloud-based solutions - Year-over-year growth (2024-2029) (%)
      • Data Table on Cloud-based solutions - Year-over-year growth (2024-2029) (%)

    • 13.5 Market opportunity by Deployment Type

      • Market opportunity by Deployment Type ($ million)
      • Data Table on Market opportunity by Deployment Type ($ million)

    14 Market Segmentation by Technology Integration

    • 14.1 Market segments

      • Chart on Technology Integration - Market share (2024-2029) (%)
      • Data Table on Technology Integration - Market share (2024-2029) (%)

    • 14.2 Comparison by Technology Integration

      • Chart on Comparison by Technology Integration
      • Data Table on Comparison by Technology Integration

    • 14.3 AI-driven - Market size and forecast (2024-2029)

      • Chart on AI-driven - Market size and forecast (2024-2029) ($ million)
      • Data Table on AI-driven - Market size and forecast (2024-2029) ($ million)
      • Chart on AI-driven - Year-over-year growth (2024-2029) (%)
      • Data Table on AI-driven - Year-over-year growth (2024-2029) (%)

    • 14.4 Non-AI-driven - Market size and forecast (2024-2029)

      • Chart on Non-AI-driven - Market size and forecast (2024-2029) ($ million)
      • Data Table on Non-AI-driven - Market size and forecast (2024-2029) ($ million)
      • Chart on Non-AI-driven - Year-over-year growth (2024-2029) (%)
      • Data Table on Non-AI-driven - Year-over-year growth (2024-2029) (%)

    • 14.5 Market opportunity by Technology Integration

      • Market opportunity by Technology Integration ($ million)
      • Data Table on Market opportunity by Technology Integration ($ million)

    15 Customer Landscape

    • 15.1 Customer landscape overview

      • Analysis of price sensitivity, lifecycle, customer purchase basket, adoption rates, and purchase criteria

    16 Geographic Landscape

    • 16.1 Geographic segmentation

      • Chart on Market share by geography 2024-2029 (%)
      • Data Table on Market share by geography 2024-2029 (%)

    • 16.2 Geographic comparison

      • Chart on Geographic comparison
      • Data Table on Geographic comparison

    • 16.3 APAC - Market size and forecast 2024-2029

      • Chart on APAC - Market size and forecast 2024-2029 ($ million)
      • Data Table on APAC - Market size and forecast 2024-2029 ($ million)
      • Chart on APAC - Year-over-year growth 2024-2029 (%)
      • Data Table on APAC - Year-over-year growth 2024-2029 (%)

    • 16.4 North America - Market size and forecast 2024-2029

      • Chart on North America - Market size and forecast 2024-2029 ($ million)
      • Data Table on North America - Market size and forecast 2024-2029 ($ million)
      • Chart on North America - Year-over-year growth 2024-2029 (%)
      • Data Table on North America - Year-over-year growth 2024-2029 (%)

    • 16.5 Europe - Market size and forecast 2024-2029

      • Chart on Europe - Market size and forecast 2024-2029 ($ million)
      • Data Table on Europe - Market size and forecast 2024-2029 ($ million)
      • Chart on Europe - Year-over-year growth 2024-2029 (%)
      • Data Table on Europe - Year-over-year growth 2024-2029 (%)

    • 16.6 South America - Market size and forecast 2024-2029

      • Chart on South America - Market size and forecast 2024-2029 ($ million)
      • Data Table on South America - Market size and forecast 2024-2029 ($ million)
      • Chart on South America - Year-over-year growth 2024-2029 (%)
      • Data Table on South America - Year-over-year growth 2024-2029 (%)

    • 16.7 Middle East and Africa - Market size and forecast 2024-2029

      • Chart on Middle East and Africa - Market size and forecast 2024-2029 ($ million)
      • Data Table on Middle East and Africa - Market size and forecast 2024-2029 ($ million)
      • Chart on Middle East and Africa - Year-over-year growth 2024-2029 (%)
      • Data Table on Middle East and Africa - Year-over-year growth 2024-2029 (%)

    • 16.8 US - Market size and forecast 2024-2029

      • Chart on US - Market size and forecast 2024-2029 ($ million)
      • Data Table on US - Market size and forecast 2024-2029 ($ million)
      • Chart on US - Year-over-year growth 2024-2029 (%)
      • Data Table on US - Year-over-year growth 2024-2029 (%)

    • 16.9 China - Market size and forecast 2024-2029

      • Chart on China - Market size and forecast 2024-2029 ($ million)
      • Data Table on China - Market size and forecast 2024-2029 ($ million)
      • Chart on China - Year-over-year growth 2024-2029 (%)
      • Data Table on China - Year-over-year growth 2024-2029 (%)

    • 16.10 Japan - Market size and forecast 2024-2029

      • Chart on Japan - Market size and forecast 2024-2029 ($ million)
      • Data Table on Japan - Market size and forecast 2024-2029 ($ million)
      • Chart on Japan - Year-over-year growth 2024-2029 (%)
      • Data Table on Japan - Year-over-year growth 2024-2029 (%)

    • 16.11 Germany - Market size and forecast 2024-2029

      • Chart on Germany - Market size and forecast 2024-2029 ($ million)
      • Data Table on Germany - Market size and forecast 2024-2029 ($ million)
      • Chart on Germany - Year-over-year growth 2024-2029 (%)
      • Data Table on Germany - Year-over-year growth 2024-2029 (%)

    • 16.12 Canada - Market size and forecast 2024-2029

      • Chart on Canada - Market size and forecast 2024-2029 ($ million)
      • Data Table on Canada - Market size and forecast 2024-2029 ($ million)
      • Chart on Canada - Year-over-year growth 2024-2029 (%)
      • Data Table on Canada - Year-over-year growth 2024-2029 (%)

    • 16.13 India - Market size and forecast 2024-2029

      • Chart on India - Market size and forecast 2024-2029 ($ million)
      • Data Table on India - Market size and forecast 2024-2029 ($ million)
      • Chart on India - Year-over-year growth 2024-2029 (%)
      • Data Table on India - Year-over-year growth 2024-2029 (%)

    • 16.14 Brazil - Market size and forecast 2024-2029

      • Chart on Brazil - Market size and forecast 2024-2029 ($ million)
      • Data Table on Brazil - Market size and forecast 2024-2029 ($ million)
      • Chart on Brazil - Year-over-year growth 2024-2029 (%)
      • Data Table on Brazil - Year-over-year growth 2024-2029 (%)

    • 16.15 Saudi Arabia - Market size and forecast 2024-2029

      • Chart on Saudi Arabia - Market size and forecast 2024-2029 ($ million)
      • Data Table on Saudi Arabia - Market size and forecast 2024-2029 ($ million)
      • Chart on Saudi Arabia - Year-over-year growth 2024-2029 (%)
      • Data Table on Saudi Arabia - Year-over-year growth 2024-2029 (%)

    • 16.16 Argentina - Market size and forecast 2024-2029

      • Chart on Argentina - Market size and forecast 2024-2029 ($ million)
      • Data Table on Argentina - Market size and forecast 2024-2029 ($ million)
      • Chart on Argentina - Year-over-year growth 2024-2029 (%)
      • Data Table on Argentina - Year-over-year growth 2024-2029 (%)

    • 16.17 UAE - Market size and forecast 2024-2029

      • Chart on UAE - Market size and forecast 2024-2029 ($ million)
      • Data Table on UAE - Market size and forecast 2024-2029 ($ million)
      • Chart on UAE - Year-over-year growth 2024-2029 (%)
      • Data Table on UAE - Year-over-year growth 2024-2029 (%)

    • 16.18 Market opportunity by geography

      • Market opportunity by geography ($ million)
      • Data Tables on Market opportunity by geography ($ million)

    • 16.19 UK - Market size and forecast (2024-2029)

      • Chart on UK - Market size and forecast (2024-2029) ($ million)
      • Data Table on UK - Market size and forecast (2024-2029) ($ million)
      • Chart on UK - Year-over-year growth (2024-2029) (%)
      • Data Table on UK - Year-over-year growth (2024-2029) (%)

    • 16.20 Italy - Market size and forecast (2024-2029)

      • Chart on Italy - Market size and forecast (2024-2029) ($ million)
      • Data Table on Italy - Market size and forecast (2024-2029) ($ million)
      • Chart on Italy - Year-over-year growth (2024-2029) (%)
      • Data Table on Italy - Year-over-year growth (2024-2029) (%)

    • 16.21 France - Market size and forecast (2024-2029)

      • Chart on France - Market size and forecast (2024-2029) ($ million)
      • Data Table on France - Market size and forecast (2024-2029) ($ million)
      • Chart on France - Year-over-year growth (2024-2029) (%)
      • Data Table on France - Year-over-year growth (2024-2029) (%)

    • 16.22 Egypt - Market size and forecast (2024-2029)

      • Chart on Egypt - Market size and forecast (2024-2029) ($ million)
      • Data Table on Egypt - Market size and forecast (2024-2029) ($ million)
      • Chart on Egypt - Year-over-year growth (2024-2029) (%)
      • Data Table on Egypt - Year-over-year growth (2024-2029) (%)

    • 16.23 Oman - Market size and forecast (2024-2029)

      • Chart on Oman - Market size and forecast (2024-2029) ($ million)
      • Data Table on Oman - Market size and forecast (2024-2029) ($ million)
      • Chart on Oman - Year-over-year growth (2024-2029) (%)
      • Data Table on Oman - Year-over-year growth (2024-2029) (%)

    • 16.24 KSA - Market size and forecast (2024-2029)

      • Chart on KSA - Market size and forecast (2024-2029) ($ million)
      • Data Table on KSA - Market size and forecast (2024-2029) ($ million)
      • Chart on KSA - Year-over-year growth (2024-2029) (%)
      • Data Table on KSA - Year-over-year growth (2024-2029) (%)

    • 16.25 Rest of World (ROW) - Market size and forecast (2024-2029)

      • Chart on Rest of World (ROW) - Market size and forecast (2024-2029) ($ million)
      • Data Table on Rest of World (ROW) - Market size and forecast (2024-2029) ($ million)
      • Chart on Rest of World (ROW) - Year-over-year growth (2024-2029) (%)
      • Data Table on Rest of World (ROW) - Year-over-year growth (2024-2029) (%)

    17 Drivers, Challenges, and Opportunity/Restraints

    • 17.1 Market drivers

    • 17.2 Market challenges

    • 17.3 Impact of drivers and challenges

      • Impact of drivers and challenges in 2024 and 2029

    • 17.4 Market opportunities/restraints

    18 Competitive Landscape

    • 18.1 Overview

    • 18.2 Competitive Landscape

      • Overview on criticality of inputs and factors of differentiation

    • 18.3 Landscape disruption

      • Overview on factors of disruption

    • 18.4 Industry risks

      • Impact of key risks on business

    19 Competitive Analysis

    • 19.1 Companies profiled

      • Companies covered

    • 19.2 Market positioning of companies

  • Matrix on companies position and classification
    • 19.3 Adobe Inc.

      • Adobe Inc. - Overview
      • Adobe Inc. - Product / Service
      • Adobe Inc. - Key offerings

    • 19.4 Aghreni Technologies Pvt. Ltd.

      • Aghreni Technologies Pvt. Ltd. - Overview
      • Aghreni Technologies Pvt. Ltd. - Product / Service
      • Aghreni Technologies Pvt. Ltd. - Key offerings

    • 19.5 Alma Media Corp.

      • Alma Media Corp. - Overview
      • Alma Media Corp. - Product / Service
      • Alma Media Corp. - Key offerings

    • 19.6 Brafton Inc.

      • Brafton Inc. - Overview
      • Brafton Inc. - Product / Service
      • Brafton Inc. - Key offerings

    • 19.7 Contently Inc.

      • Contently Inc. - Overview
      • Contently Inc. - Product / Service
      • Contently Inc. - Key offerings

    • 19.8 Contentoo B.V.

      • Contentoo B.V. - Overview
      • Contentoo B.V. - Product / Service
      • Contentoo B.V. - Key offerings

    • 19.9 CoSchedule LLC

      • CoSchedule LLC - Overview
      • CoSchedule LLC - Product / Service
      • CoSchedule LLC - Key offerings

    • 19.10 Curata Inc.

      • Curata Inc. - Overview
      • Curata Inc. - Product / Service
      • Curata Inc. - Key offerings

    • 19.11 DivvyHQ

      • DivvyHQ - Overview
      • DivvyHQ - Product / Service
      • DivvyHQ - Key offerings

    • 19.12 Hootsuite Inc.

      • Hootsuite Inc. - Overview
      • Hootsuite Inc. - Product / Service
      • Hootsuite Inc. - Key offerings

    • 19.13 HubSpot Inc.

      • HubSpot Inc. - Overview
      • HubSpot Inc. - Product / Service
      • HubSpot Inc. - Key offerings

    • 19.14 Influence and Co.

      • Influence and Co. - Overview
      • Influence and Co. - Product / Service
      • Influence and Co. - Key offerings

    • 19.15 Interact Marketing

      • Interact Marketing - Overview
      • Interact Marketing - Product / Service
      • Interact Marketing - Key offerings

    • 19.16 IZEA Worldwide Inc.

      • IZEA Worldwide Inc. - Overview
      • IZEA Worldwide Inc. - Product / Service
      • IZEA Worldwide Inc. - Key offerings

    • 19.17 NewsCred

      • NewsCred - Overview
      • NewsCred - Product / Service
      • NewsCred - Key offerings

    • 19.18 Rock Content

      • Rock Content - Overview
      • Rock Content - Product / Service
      • Rock Content - Key offerings

    • 19.19 Seismic Software Inc.

      • Seismic Software Inc. - Overview
      • Seismic Software Inc. - Product / Service
      • Seismic Software Inc. - Key offerings

    • 19.20 Skyword Inc.

      • Skyword Inc. - Overview
      • Skyword Inc. - Product / Service
      • Skyword Inc. - Key offerings

    • 19.21 Sprinklr Inc.

      • Sprinklr Inc. - Overview
      • Sprinklr Inc. - Product / Service
      • Sprinklr Inc. - Key offerings

    • 19.22 Upland Software Inc.

      • Upland Software Inc. - Overview
      • Upland Software Inc. - Product / Service
      • Upland Software Inc. - Key offerings

    • 19.23 Adobe Inc. (USA)

      • Adobe Inc. (USA) - Overview
      • Adobe Inc. (USA) - Product / Service
      • Adobe Inc. (USA) - Key offerings

    • 19.24 Aghreni Technologies Pvt. Ltd. (India)

      • Aghreni Technologies Pvt. Ltd. (India) - Overview
      • Aghreni Technologies Pvt. Ltd. (India) - Product / Service
      • Aghreni Technologies Pvt. Ltd. (India) - Key offerings

    • 19.25 Alma Media Corp. (Finland)

      • Alma Media Corp. (Finland) - Overview
      • Alma Media Corp. (Finland) - Product / Service
      • Alma Media Corp. (Finland) - Key offerings

    • 19.26 Brafton Inc. (USA)

      • Brafton Inc. (USA) - Overview
      • Brafton Inc. (USA) - Product / Service
      • Brafton Inc. (USA) - Key offerings

    • 19.27 Contently Inc. (USA)

      • Contently Inc. (USA) - Overview
      • Contently Inc. (USA) - Product / Service
      • Contently Inc. (USA) - Key offerings

    • 19.28 Contentoo B.V. (Netherlands)

      • Contentoo B.V. (Netherlands) - Overview
      • Contentoo B.V. (Netherlands) - Product / Service
      • Contentoo B.V. (Netherlands) - Key offerings

    • 19.29 CoSchedule LLC (USA)

      • CoSchedule LLC (USA) - Overview
      • CoSchedule LLC (USA) - Product / Service
      • CoSchedule LLC (USA) - Key offerings

    • 19.30 Curata Inc. (USA)

      • Curata Inc. (USA) - Overview
      • Curata Inc. (USA) - Product / Service
      • Curata Inc. (USA) - Key offerings

    • 19.31 DivvyHQ (USA)

      • DivvyHQ (USA) - Overview
      • DivvyHQ (USA) - Product / Service
      • DivvyHQ (USA) - Key offerings

    • 19.32 Hootsuite Inc. (Canada)

      • Hootsuite Inc. (Canada) - Overview
      • Hootsuite Inc. (Canada) - Product / Service
      • Hootsuite Inc. (Canada) - Key offerings

    • 19.33 HubSpot Inc. (USA)

      • HubSpot Inc. (USA) - Overview
      • HubSpot Inc. (USA) - Product / Service
      • HubSpot Inc. (USA) - Key offerings

    • 19.34 Influence and Co. (USA)

      • Influence and Co. (USA) - Overview
      • Influence and Co. (USA) - Product / Service
      • Influence and Co. (USA) - Key offerings

    • 19.35 Interact Marketing (USA)

      • Interact Marketing (USA) - Overview
      • Interact Marketing (USA) - Product / Service
      • Interact Marketing (USA) - Key offerings

    • 19.36 IZEA Worldwide Inc. (USA)

      • IZEA Worldwide Inc. (USA) - Overview
      • IZEA Worldwide Inc. (USA) - Product / Service
      • IZEA Worldwide Inc. (USA) - Key offerings

    • 19.37 NewsCred (USA)

      • NewsCred (USA) - Overview
      • NewsCred (USA) - Product / Service
      • NewsCred (USA) - Key offerings

    • 19.38 Rock Content (Brazil)

      • Rock Content (Brazil) - Overview
      • Rock Content (Brazil) - Product / Service
      • Rock Content (Brazil) - Key offerings

    • 19.39 Seismic Software Inc. (USA)

      • Seismic Software Inc. (USA) - Overview
      • Seismic Software Inc. (USA) - Product / Service
      • Seismic Software Inc. (USA) - Key offerings

    • 19.40 Skyword Inc. (USA)

      • Skyword Inc. (USA) - Overview
      • Skyword Inc. (USA) - Product / Service
      • Skyword Inc. (USA) - Key offerings

    • 19.41 Sprinklr Inc. (USA)

      • Sprinklr Inc. (USA) - Overview
      • Sprinklr Inc. (USA) - Product / Service
      • Sprinklr Inc. (USA) - Key offerings

    • 19.42 Upland Software Inc. (USA)

      • Upland Software Inc. (USA) - Overview
      • Upland Software Inc. (USA) - Product / Service
      • Upland Software Inc. (USA) - Key offerings

    20 Appendix

    • 20.1 Scope of the report

    • 20.2 Inclusions and exclusions checklist

      • Inclusions checklist
      • Exclusions checklist

    • 20.3 Currency conversion rates for US$

      • Currency conversion rates for US$

    • 20.4 Research methodology

      • Research methodology

    • 20.5 Data procurement

      • Information sources

    • 20.6 Data validation

      • Data validation

    • 20.7 Validation techniques employed for market sizing

      • Validation techniques employed for market sizing

    • 20.8 Data synthesis

      • Data synthesis

    • 20.9 360 degree market analysis

      • 360 degree market analysis

    • 20.10 List of abbreviations

      • List of abbreviations
      • o Strong financial performance


    SAMPLE - Content Marketing Market 2025-2029
      Deep dive market size
      • Additional segments
      • Additional region or country
      Vendor market share
      • By region/country
      • By segment
      Volume data (historical and forecast) by
      • Region or country or segment
      • Up to 10-year historical forecast
      Detailed analysis
      • Regulatory landscape
      • Mergers & Acquisitions
      • List of distributors or customers
      • Production, export or imports
      • Cost structure
      • Trends, drivers and challenges for specific region or country or segment
      • Price analysis for products or services or regions or country or segments
      • Installed based for products or services for region or country
      • For health care sector: procedure volumes or cost
      Company profiles: addition or new vendors including further deep dive profiling or market share analysis:
      • Brief overview
      • Headquarter/Geographical Presence
      • Revenue (Global/Regional/Country level)
      • Employees
      • Market share analysis
      • Product/service portfolio
      • SWOT analysis
      • Production locations and capacity
      • Average Selling Price (ASP) of product or services
      • Key News (Mergers and Acquisitions, New product launches, Geographical expansion, etc.)

    North America

    110 E. Schiller, #208, Elmhurst, IL 60126, U.S.A.
    Tel: +1 630 530 7340

    Asia Pacific

    Asia-Pacific The Hive Workspaces Level 10, Prestige Tech Platina – Block 2 Kadubeesanahalli, Outer Ring Road Marathahalli Bangalore - 560087, Karnataka, India
    Tel: +91 806 191 4606

    Europe

    Europe 8 Wimpole Street, W1G 9SP, London, United Kingdom.
    Tel: +44 203 893 3400

    About Us

    Technavio is a division of Infiniti Research - a leading market intelligence company with a global presence. We study markets in more than 100 countries to help you analyze competitive activity, see beyond market disruptions, and develop intelligent business strategies. With over a decade of experience and offices across three continents, we regularly provide deep-dive market assessment, strategy and research services to more than a 1,000 leading global companies. You can reach us at hello@infinitiresearch.com

    DISCLAIMER

    This report has been prepared from sources and data that we believe to be reliable, but we make no representation as to its accuracy or completeness. Any decision or action taken by the recipient based on this report shall be solely and entirely at the risk of the recipient. Opinions and information provided are made as at the date of the report issue and are subject to change without notice. All trademarks and copyrights remain the sole ownership of their rightful owners/licensees. In no event shall Infiniti research have any liability to any party for special, incidental, tort, or consequential damages arising out of or in connection with this report, even if Infiniti Research has been advised of the possibility of such damages. Reproduction without written permission is completely forbidden. NOT FOR FURTHER DISTRIBUTION. Copyright © 2026 Infiniti Research. All Rights Reserved.

    SKU: IRTNTR41556

    Content Marketing Market 2025-2029

    x1 $2500
    Subtotal $2500
    Total $2500
    Buy Now

    Technavio Unlock the full report within minutes.

    Didn't find what you are looking for?
    Share your feedback, and get a tailored report at a special discount on current prices!