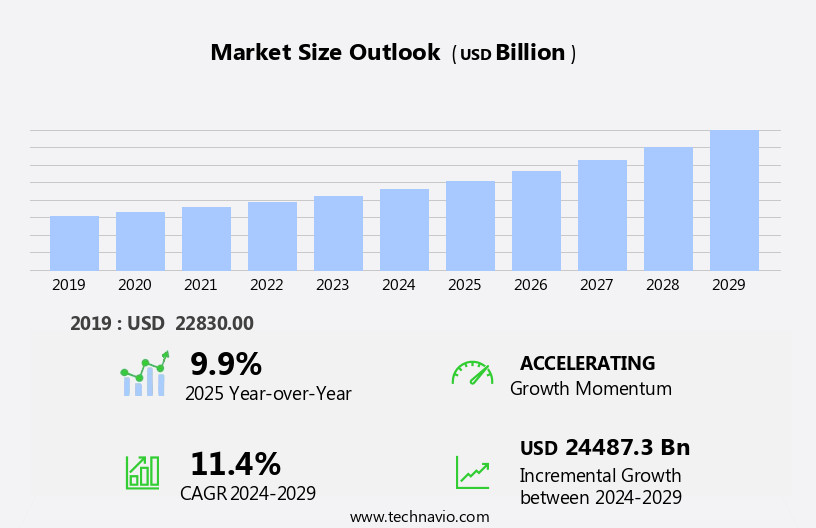
Chart on Global - Market size and forecast 2019-2029 (USD bn)
| Historic Data 2019 - 2023 (USD bn )
|
Forecasted Data 2024 - 2029 (USD bn )
|

|
|
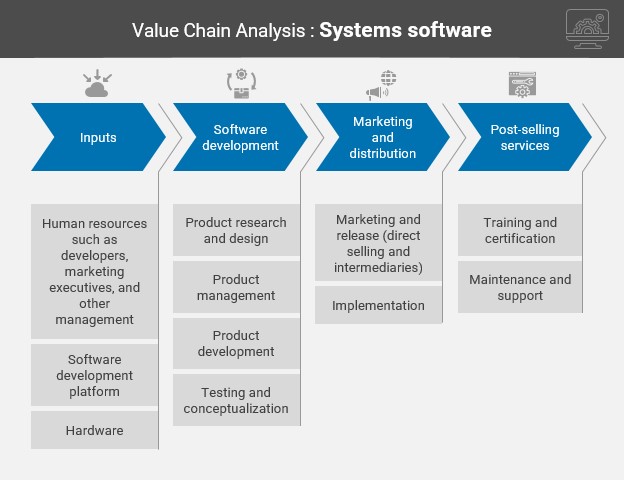
Software testing services play a crucial role in ensuring the quality and functionality of software products and applications in today's technology-driven market. Machine learning algorithms are increasingly being integrated into testing processes to enhance efficiency and accuracy. Skilled professionals specializing in testing services employ various free testing tools to identify defects and address security concerns. Outsourced testing services enable businesses to focus on their core competencies while ensuring robust testing frameworks and continuous training programs for their testing teams.
Functional testing, including unit testing, regression testing, system testing, acceptance testing, alpha testing, and beta testing, checks the software's functionality. Non-functional testing encompasses performance testing, security testing, compatibility testing, usability testing, load testing, and security testing. Agile and DevOps methodologies, such as cloud-based testing, shift left testing, and crowdtesting, have become essential for continuous application updates and cross-platform support.
Security threats, such as AI, Big Data, IoT, and transactions, require specialized testing, including security testing and test automation. DevOps teams leverage automated test environments to streamline testing processes and improve the ROI of software development. Platforms and systems must support various mobile-based applications and entertainment and gaming industries, making compatibility testing and usability testing essential. In conclusion, software testing services are a vital investment for businesses seeking to deliver high-quality software and applications, addressing the evolving needs of the technology landscape.
- Technavio reports elaborately highlights the historic market size from 2019 to 2024. Furthermost we also provide the forecast till 2029 with in-depth market share and their CAGR.
- We also have 10+ specific vendor with their key offering and product/service segments in specific.
Unlock the full report within minutes