Content Market 2024-2028

Content Market 2024-2028

Base Year: 2023

1. INTRODUCTION

1.1 Research Objective

1.2 Market Scope

2. Market Segmentation

2.1 End-user

2.1.2 Retail

2.2 Geography

3. Market Landscape

3.1 Market Overview

3.2 Market Sizing

3.3 Drivers, Trends, & Challenges

3.4 Market Characteristics

4. Customer Landscape

4.1 Customer Landscape Overview

5. Competitive Landscape

5.1 Companies Covered

5.2 Company Positioning

5.2.1 Vendasta com

5.2.2 Overview on factors of disruption

6. Research Methodology

6.1 Value Chain Analysis

6.2 Research Approach

6.3 Information Sources

6.4 Validation Techniques

7. Appendix

7.1 Key Questions Answered

7.2 TOC & LOE

7.3 Customization Available

7.4 About Technavio & Disclaimer

SAMPLE - Content Market 2024-2028

Research Objective

  • Define, depict, and forecast the worldwide Content Marketing Market, categorizing it based on End-user and Platform Segments (with further breakdowns for specific national markets) .
  • Understand market dynamics, including historical trends, factual data, current market size, and future projections, encompassing benefits and industry-specific challenges.
  • Identify key drivers, challenges, and trends enables companies to adapt quickly to market shifts and capitalize on emerging opportunities.
  • Evaluate the companies landscape and positioning, providing valuable insights for strategic partnerships and competitive advantages
  • Monitor and assess competitive advancements, including joint ventures, mergers, acquisitions, new product developments, expansions, and research and development activities in the Tiny Homes Market

1.2 Market Scope

Page number 201
List of Charts & Table 217
Historic period 2018 - 2022
Forecast period 2024-2028
Market growth 2024-2028 USD 654.78 million
YoY growth 2022-2023 (%) 15.34


Unlock the full report within minutes

SAMPLE - Content Market 2024-2028
Regional Analysis
  • APAC
  • North America
  • Europe
  • South America
  • Middle East and Africa
Regional Contribution
  • APAC at 38%
Companies Profiled
  • Adobe Inc.
  • Alma Media
  • Brafton Inc.
  • ClearVoice Inc.
  • Contentoo B.V.
  • Eucalypt LLC
  • Hootsuite Inc
  • HubSpot Inc.
  • Influence and Co.
  • IZEA Worldwide Inc.
  • Rock Content
  • Seismic Software Inc.
  • Skyword Inc.
  • Sprinklr Inc.
  • Upland Software Inc.
  • Contently Inc.
  • CoSchedule LLC
  •  Interact Marketing
  • Kenscio
  • Vendasta Technologies Inc.
Segment Overview
  • End-user
    • Retail
    • Automotive
    • Financial services
    • Telecom
    • Others
  • Platform
    • Blogging
    • Videos
    • Infographics
    • Case studies
    • Others
  • Objective
    • Lead generation
    • Brand awareness
    • Thought leadership
    • Others
  • Geography
    • APAC
    • North America
    • Europe
    • South America
    • Middle East and Africa
Exclusive Research on Customer Landscape
  • Drivers of Price Sensitivity
    • Purchases are undifferentiated
    • Purchase is a key cost to the buyer
    • Quality is not important
    • Price sensitivity
  • Adoption Lifecycle
    • Adoption lifecycle
    • Innovator
    • Early adopters
    • Late majority
    • Laggards
  • Adoption Rates
    • North America
    • APAC
    • Europe
    • South America
  • Key Purchase Criteria
    • Price
    • Quality
    • Service
    • Reliability
    • Innovation
    • Regulatory compliance


Unlock the full report within minutes

02

Market Segmentation

2.1 End-user

2.1.2 Retail

2.2 Geography

SAMPLE - Content Market 2024-2028
  • The Market is divided into different segment such as End-user, Platform and Objective .The End-user is further segmented into, Retail, Automotive, Financial services, Telecom, and Others.

Graph on End-user - Market share 2018 - 2022 (%)

Retail Automotive Financial services Telecom Others


Unlock the full report within minutes

SAMPLE - Content Market 2024-2028
  • Market Size & Forecast 2023 - 2028 with Historic data analysis from 2018 - 2022.
  • The retail segment includes distribution channels and all types of omnichannel companies, such as branded wholesalers with retail outlets, traditional retailers, grocery store retail operators, convenience store retail operators, and other retail operators
  • The benefits of content marketing in the retail segment are listed below:

Retail - Market size and forecast 2018 - 2028 (USD Mn)

2018: USD 90.23 Mn

Unlock the full report within minutes

SAMPLE - Content Market 2024-2028
  • The region market share is widely explained from 2018 to 2028 along with highest region contributor mentioned in our reports.​
  • Furthermost our reports explain pandemic impact of the region on the market.​

Market share by geography % (USD Mn)


Unlock the full report within minutes

SAMPLE - Content Market 2024-2028
  • The demand for content marketing is expected to grow in APAC, primarily due to its increasing demand from sectors such as automotive, financial service, consumer electronics, and health and pharma..

Chart on APAC - Market size and forecast 2018 - 2028 (USD mn)

2018: USD 135.71 Mn

Unlock the full report within minutes

SAMPLE - Content Market 2024-2028
  • Our reports elaborate the region wise growth in APAC. China being the largest country sharing in market size for the forecast period 2023 - 2028.​
  • The chart provide the historical and forecast of CAGR and the incremental growth value for the 2018 - 2028 period.​

China - Year-over-year growth 2018 - 2028 period.​ (%)

[The chart serves as a sample presentation; for the actual values, please buy the full report.]

Unlock the full report within minutes

03

Market Landscape

3.1 Market Overview

3.2 Market Sizing

3.3 Drivers, Trends, & Challenges

3.4 Market Characteristics

3.5 Porter’s Five Summary & Analysis

SAMPLE - Content Market 2024-2028
  • The report provides a forecast and historical analysis for the global Content Marketing Market with precise giving information on countries involved during the 2024-2028 period. The market is expected to grow at a CAGR of 16.01% by 2028.
  • Our reports covers in-depth forecast and historical geographical analysis with major region as North America, South America, Europe, Asia Pacific (APAC), and Middle East and Africa (MEA) with South America showing the highest share.​
  • The market is fragmentation with several played involved and expected to change the market structure if the industry consolidation or some vendor exit from the market.
  • To assess the supply side and the demand side challenges faced by vendors in the market, the interplay of inputs for vendors with the differentiated product and service outputs as presented to the customer are analyzed. The most important inputs for vendors in the global test new series market are capex and technology.​

Unlock the full report within minutes

SAMPLE - Content Market 2024-2028

Content marketing refers to the business and marketing process for the creation and distribution of valuable content with the aim of acquiring, attracting, and engaging with target audiences and improving brand image. A content marketing strategy can leverage different channels, such as online platforms and apps, in-person, mobile apps, and social media, to attract target audiences and retain and gain the loyalty of existing customers.

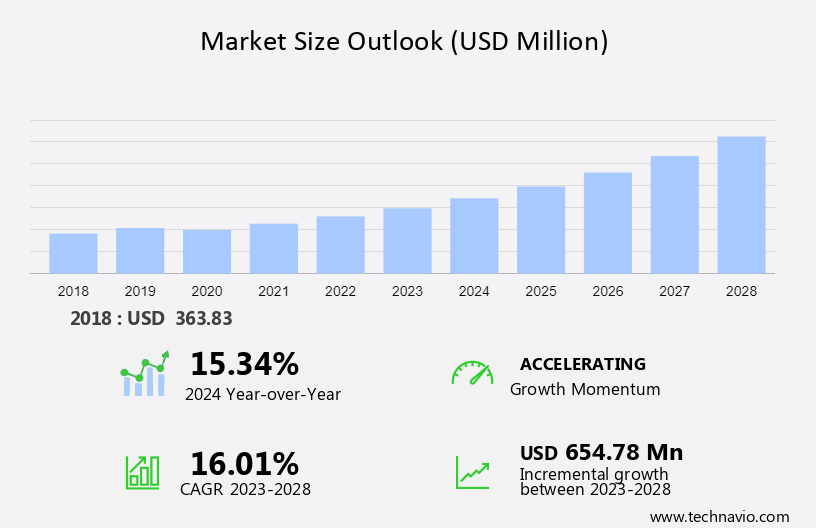
  • Technavio reports elaborately highlights the historic market size from 2018 to 2023. Furthermost we also provide the forecast till 2028 with in-depth market share and their CAGR.​
  • We also have 10+ specific vendor with their key offering and product/service segments in specific.​​

Chart on Global - Market size and forecast 2023-2028 (USD mn)

Historic Data 2018 - 2022 (USD mn ) Forecasted Data 2023 - 2028 (USD mn )

Unlock the full report within minutes

SAMPLE - Content Market 2024-2028

The reports include market characteristics that has been analyzed considering:


  • The Lifecycle stage of the market is clearly defined from –Innovation to growth and maturity.​
  • The market is shown as fragmentation in 2018 and followed same as fragmented in 2028​
  • Our reports also talk in detailed about the external factors affecting the market in 2018 and also for the forecast of 2028 such as Regulatory control and Disruption threat are two major factors. Furthermost we also major the impact on the market such as high, medium or low in forecast period of 2024-2028​

Factors that define the market characteristics

[The chart serves as a sample presentation; for the actual values, please buy the full report.]

Unlock the full report within minutes

SAMPLE - Content Market 2024-2028

Five Forces Summary - Comparison between 2023-2028

[The chart serves as a sample presentation; for the actual values, please buy the full report.]


Unlock the full report within minutes

SAMPLE - Content Market 2024-2028

Five Force Analysis


Bargaining Power Of Buyers

  • Number of vendors that offer the product or service
  • Product or service differentiation
  • Purchase volumes of buyers
  • Variations in the cost of products or services provided by vendors
  • Criticality of the product or service for buyers
  • Availability of substitute products or services
  • Buyers’ ability to switch to a substitute product or service
  • Impact of product or service quality on the output of buyers
  • Threat of backward integration by buyers

Bargaining Power Of Suppliers

  • Number of suppliers that offer the product or service
  • Product or service differentiation
  • Purchase volume of vendors
  • Variations in the cost of products or services provided by suppliers
  • Criticality of the product or service for vendors
  • Availability of substitute products or services
  • Vendors’ ability to switch to a substitute product or service
  • Impact of product or service quality on the output of vendors
  • Threat of forward integration by suppliers
  • Supplier dependency on industry

Threat Of New Entrants

  • Economies of scale of established vendors
  • Product or service differentiation
  • Capital requirements
  • Access to distribution channels
  • Regulatory control

Threat of substitutes

  • Availability of substitutes
  • Buyers’ cost of switching to substitutes
  • Relative price performance of substitutes
  • Buyer propensity to shift to substitutes
  • Differentiation of substitutes

Threat Of Rivalry

  • Number of vendors
  • Parity across vendors in terms of size and power
  • Industry growth stage
  • Product or service differentiation
  • Cost of switching products or services
  • Fixed costs
  • Overcapacity and price reduction
  • Exit barriers

Unlock the full report within minutes

04

Customer Landscape

4.1 Customer Landscape Overview

SAMPLE - Content Market 2024-2028

Exclusive Research Report on Customer Landscape by Technavio

  • Technavio analysts has done in depth research on Customer Landscape which covers the Life stages, adoption rate and key purchase factors along with drivers impact on price sensitivity.
  • Furthermost our reports provide a detailed Lifecycle stages from innovation to laggards and their region wise adoption rates for the forecast period of 2024-2028

[The chart serves as a sample presentation; for the actual values, please buy the full report.]


Unlock the full report within minutes

05

Competitive Landscape

5.1 Companies Covered

5.2 Company Positioning

5.2.1 Vendasta com

5.2.2 Overview on factors of disruption

SAMPLE - Content Market 2024-2028
  • Companies are included in the report based on their offerings in the global test new series market. They are identified based on their revenues, market dominance, geographical presence, product portfolio, and financials. 20 important companies in the global test new series market have been covered in this report.
  • For all the 20 companies, the revenue from the global test new series market contributes to the overall revenue of the vendor but is not a key component of the companies revenue and hence all companies have been classified as contributing on the influence index.
  • Majority of the companies covered are classified as contributing on the influence index, changes in the market dynamics may not significantly impact the business prospects of companies in the global test new series market.
SAMPLE - Content Market 2024-2028

Exclusively research by Technavio

  • Technavio analysts provided the matrix showing the market  positioning and the classification  of this market.
  • The majority of the companies covered are classified as contributing on the influence index, changes in the market dynamics may not significantly impact the business prospects of companies in the global test new series market.

Company Market Positioning

1: Adobe Inc.11: Rock Content
2: Alma Media12: Seismic Software Inc.
3: Brafton Inc.13: Skyword Inc.
4: ClearVoice Inc.14: Sprinklr Inc.
5: Contentoo B.V.15: Upland Software Inc.
6: Eucalypt LLC16: Contently Inc.
7: Hootsuite Inc17: CoSchedule LLC
8: HubSpot Inc.18:  Interact Marketing
9: Influence and Co.19: Kenscio
10: IZEA Worldwide Inc.20: Vendasta Technologies Inc.


Unlock the full report within minutes

SAMPLE - Content Market 2024-2028


Segment Name

Description

Unified

Under this segment, the company's product provide information related to lifestyle, career and business development.

SAMPLE - Content Market 2024-2028

The potential for the disruption of the market landscape was moderate in 2023, and its threat is expected to remain unchanged by 2028.


[The chart serves as a sample presentation; for the actual values, please buy the full report.]

Unlock the full report within minutes

06

Research Methodology

6.1 Value Chain Analysis

6.2 Research Approach

6.3 Information Sources

6.4 Validation Techniques

SAMPLE - Content Market 2024-2028

07

Appendix

7.1 Key Questions Answered

7.2 TOC & LOE

7.3 Customization Available

7.4 About Technavio & Disclaimer

SAMPLE - Content Market 2024-2028

Market Analysis

  • What are the key drivers, inhibitors, and trends in the Content Market 2024-2028?
  • How do the five forces impact the market?
  • What are the adoption rates of Content Marketing Market in different regions?
  • What are the factors influencing buyers’ price sensitivity?

Technavio's Exclusive Insights

  • What are the factors considered by buyers when purchasing Content Marketing Market
  • What is the criticality of inputs for vendors?
  • What are the factors of differentiation for vendors?
  • What are the disruptive sources in the market?
  • What are the factors driving disruption?
  • What is the threat of disruption?
SAMPLE - Content Market 2024-2028

1 Executive Summary

  • 1.1 Market overview

    • Exhibit 01: Executive Summary – Chart on Market Overview
    • Exhibit 02: Executive Summary – Data Table on Market Overview
    • Exhibit 03: Executive Summary – Chart on Global Market Characteristics
    • Exhibit 04: Executive Summary – Chart on Market by Geography
    • Exhibit 05: Executive Summary – Chart on Market Segmentation by End-user
    • Exhibit 06: Executive Summary – Chart on Market Segmentation by Platform
    • Exhibit 07: Executive Summary – Chart on Market Segmentation by Objective
    • Exhibit 08: Executive Summary – Chart on Incremental Growth
    • Exhibit 09: Executive Summary – Data Table on Incremental Growth
    • Exhibit 10: Executive Summary – Chart on Vendor Market Positioning

2 Market Landscape

  • 2.1 Market ecosystem

    • Exhibit 11: Parent market
    • Exhibit 12: Market Characteristics

3 Market Sizing

  • 3.1 Market definition

    • Exhibit 13: Offerings of vendors included in the market definition

  • 3.2 Market segment analysis

    • Exhibit 14: Market segments

  • 3.3 Market size 2023

  • 3.4 Market outlook: Forecast for 2023-2028

    • Exhibit 15: Chart on Global - Market size and forecast 2023-2028 ($ million)
    • Exhibit 16: Data Table on Global - Market size and forecast 2023-2028 ($ million)
    • Exhibit 17: Chart on Global Market: Year-over-year growth 2023-2028 (%)
    • Exhibit 18: Data Table on Global Market: Year-over-year growth 2023-2028 (%)

4 Historic Market Size

  • 4.1 Global content marketing market 2018 - 2022

    • Exhibit 19: Historic Market Size – Data Table on global content marketing market 2018 - 2022 ($ million)

  • 4.2 End-user Segment Analysis 2018 - 2022

    • Exhibit 20: Historic Market Size – End-user Segment 2018 - 2022 ($ million)

  • 4.3 Platform Segment Analysis 2018 - 2022

    • Exhibit 21: Historic Market Size – Platform Segment 2018 - 2022 ($ million)

  • 4.4 Objective Segment Analysis 2018 - 2022

    • Exhibit 22: Historic Market Size – Objective Segment 2018 - 2022 ($ million)

  • 4.5 Geography Segment Analysis 2018 - 2022

  • Exhibit 23: Historic Market Size – Geography Segment 2018 - 2022 ($ million)
    • 4.6 Country Segment Analysis 2018 - 2022

      • Exhibit 24: Historic Market Size – Country Segment 2018 - 2022 ($ million)

    5 Five Forces Analysis

    • 5.1 Five forces summary

      • Exhibit 25: Five forces analysis - Comparison between 2023 and 2028

    • 5.2 Bargaining power of buyers

      • Exhibit 26: Chart on Bargaining power of buyers – Impact of key factors 2023 and 2028

    • 5.3 Bargaining power of suppliers

      • Exhibit 27: Bargaining power of suppliers – Impact of key factors in 2023 and 2028

    • 5.4 Threat of new entrants

      • Exhibit 28: Threat of new entrants – Impact of key factors in 2023 and 2028

    • 5.5 Threat of substitutes

      • Exhibit 29: Threat of substitutes – Impact of key factors in 2023 and 2028

    • 5.6 Threat of rivalry

      • Exhibit 30: Threat of rivalry – Impact of key factors in 2023 and 2028

    • 5.7 Market condition

      • Exhibit 31: Chart on Market condition - Five forces 2023 and 2028


    SAMPLE - Content Market 2024-2028

    6 Market Segmentation by End-user

    • 6.1 Market segments

      • Exhibit 32: Chart on End-user - Market share 2023-2028 (%)
      • Exhibit 33: Data Table on End-user - Market share 2023-2028 (%)

    • 6.2 Comparison by End-user

      • Exhibit 34: Chart on Comparison by End-user
      • Exhibit 35: Data Table on Comparison by End-user

    • 6.3 Retail - Market size and forecast 2023-2028

      • Exhibit 36: Chart on Retail - Market size and forecast 2023-2028 ($ million)
      • Exhibit 37: Data Table on Retail - Market size and forecast 2023-2028 ($ million)
      • Exhibit 38: Chart on Retail - Year-over-year growth 2023-2028 (%)
      • Exhibit 39: Data Table on Retail - Year-over-year growth 2023-2028 (%)

    • 6.4 Automotive - Market size and forecast 2023-2028

      • Exhibit 40: Chart on Automotive - Market size and forecast 2023-2028 ($ million)
      • Exhibit 41: Data Table on Automotive - Market size and forecast 2023-2028 ($ million)
      • Exhibit 42: Chart on Automotive - Year-over-year growth 2023-2028 (%)
      • Exhibit 43: Data Table on Automotive - Year-over-year growth 2023-2028 (%)

    • 6.5 Financial services - Market size and forecast 2023-2028

      • Exhibit 44: Chart on Financial services - Market size and forecast 2023-2028 ($ million)
      • Exhibit 45: Data Table on Financial services - Market size and forecast 2023-2028 ($ million)
      • Exhibit 46: Chart on Financial services - Year-over-year growth 2023-2028 (%)
      • Exhibit 47: Data Table on Financial services - Year-over-year growth 2023-2028 (%)

    • 6.6 Telecom - Market size and forecast 2023-2028

      • Exhibit 48: Chart on Telecom - Market size and forecast 2023-2028 ($ million)
      • Exhibit 49: Data Table on Telecom - Market size and forecast 2023-2028 ($ million)
      • Exhibit 50: Chart on Telecom - Year-over-year growth 2023-2028 (%)
      • Exhibit 51: Data Table on Telecom - Year-over-year growth 2023-2028 (%)

    • 6.7 Others - Market size and forecast 2023-2028

      • Exhibit 52: Chart on Others - Market size and forecast 2023-2028 ($ million)
      • Exhibit 53: Data Table on Others - Market size and forecast 2023-2028 ($ million)
      • Exhibit 54: Chart on Others - Year-over-year growth 2023-2028 (%)
      • Exhibit 55: Data Table on Others - Year-over-year growth 2023-2028 (%)

    • 6.8 Market opportunity by End-user

      • Exhibit 56: Market opportunity by End-user ($ million)
      • Exhibit 57: Data Table on Market opportunity by End-user ($ million)

    7 Market Segmentation by Platform

    • 7.1 Market segments

      • Exhibit 58: Chart on Platform - Market share 2023-2028 (%)
      • Exhibit 59: Data Table on Platform - Market share 2023-2028 (%)

    • 7.2 Comparison by Platform

      • Exhibit 60: Chart on Comparison by Platform
      • Exhibit 61: Data Table on Comparison by Platform

    • 7.3 Blogging - Market size and forecast 2023-2028

      • Exhibit 62: Chart on Blogging - Market size and forecast 2023-2028 ($ million)
      • Exhibit 63: Data Table on Blogging - Market size and forecast 2023-2028 ($ million)
      • Exhibit 64: Chart on Blogging - Year-over-year growth 2023-2028 (%)
      • Exhibit 65: Data Table on Blogging - Year-over-year growth 2023-2028 (%)

    • 7.4 Videos - Market size and forecast 2023-2028

      • Exhibit 66: Chart on Videos - Market size and forecast 2023-2028 ($ million)
      • Exhibit 67: Data Table on Videos - Market size and forecast 2023-2028 ($ million)
      • Exhibit 68: Chart on Videos - Year-over-year growth 2023-2028 (%)
      • Exhibit 69: Data Table on Videos - Year-over-year growth 2023-2028 (%)

    • 7.5 Infographics - Market size and forecast 2023-2028

      • Exhibit 70: Chart on Infographics - Market size and forecast 2023-2028 ($ million)
      • Exhibit 71: Data Table on Infographics - Market size and forecast 2023-2028 ($ million)
      • Exhibit 72: Chart on Infographics - Year-over-year growth 2023-2028 (%)
      • Exhibit 73: Data Table on Infographics - Year-over-year growth 2023-2028 (%)

    • 7.6 Case studies - Market size and forecast 2023-2028

      • Exhibit 74: Chart on Case studies - Market size and forecast 2023-2028 ($ million)
      • Exhibit 75: Data Table on Case studies - Market size and forecast 2023-2028 ($ million)
      • Exhibit 76: Chart on Case studies - Year-over-year growth 2023-2028 (%)
      • Exhibit 77: Data Table on Case studies - Year-over-year growth 2023-2028 (%)

    • 7.7 Others - Market size and forecast 2023-2028

      • Exhibit 78: Chart on Others - Market size and forecast 2023-2028 ($ million)
      • Exhibit 79: Data Table on Others - Market size and forecast 2023-2028 ($ million)
      • Exhibit 80: Chart on Others - Year-over-year growth 2023-2028 (%)
      • Exhibit 81: Data Table on Others - Year-over-year growth 2023-2028 (%)

    • 7.8 Market opportunity by Platform

      • Exhibit 82: Market opportunity by Platform ($ million)
      • Exhibit 83: Data Table on Market opportunity by Platform ($ million)

    8 Market Segmentation by Objective

    • 8.1 Market segments

      • Exhibit 84: Chart on Objective - Market share 2023-2028 (%)
      • Exhibit 85: Data Table on Objective - Market share 2023-2028 (%)

    • 8.2 Comparison by Objective

      • Exhibit 86: Chart on Comparison by Objective
      • Exhibit 87: Data Table on Comparison by Objective

    • 8.3 Lead generation - Market size and forecast 2023-2028

      • Exhibit 88: Chart on Lead generation - Market size and forecast 2023-2028 ($ million)
      • Exhibit 89: Data Table on Lead generation - Market size and forecast 2023-2028 ($ million)
      • Exhibit 90: Chart on Lead generation - Year-over-year growth 2023-2028 (%)
      • Exhibit 91: Data Table on Lead generation - Year-over-year growth 2023-2028 (%)

    • 8.4 Brand awareness - Market size and forecast 2023-2028

      • Exhibit 92: Chart on Brand awareness - Market size and forecast 2023-2028 ($ million)
      • Exhibit 93: Data Table on Brand awareness - Market size and forecast 2023-2028 ($ million)
      • Exhibit 94: Chart on Brand awareness - Year-over-year growth 2023-2028 (%)
      • Exhibit 95: Data Table on Brand awareness - Year-over-year growth 2023-2028 (%)

    • 8.5 Thought leadership - Market size and forecast 2023-2028

      • Exhibit 96: Chart on Thought leadership - Market size and forecast 2023-2028 ($ million)
      • Exhibit 97: Data Table on Thought leadership - Market size and forecast 2023-2028 ($ million)
      • Exhibit 98: Chart on Thought leadership - Year-over-year growth 2023-2028 (%)
      • Exhibit 99: Data Table on Thought leadership - Year-over-year growth 2023-2028 (%)

    • 8.6 Others - Market size and forecast 2023-2028

  • Exhibit 100: Chart on Others - Market size and forecast 2023-2028 ($ million)
  • Exhibit 101: Data Table on Others - Market size and forecast 2023-2028 ($ million)
  • Exhibit 102: Chart on Others - Year-over-year growth 2023-2028 (%)
  • Exhibit 103: Data Table on Others - Year-over-year growth 2023-2028 (%)
    • 8.7 Market opportunity by Objective

      • Exhibit 104: Market opportunity by Objective ($ million)
      • Exhibit 105: Data Table on Market opportunity by Objective ($ million)

    9 Customer Landscape

    • 9.1 Customer landscape overview

      • Exhibit 106: Analysis of price sensitivity, lifecycle, customer purchase basket, adoption rates, and purchase criteria

    10 Geographic Landscape

    • 10.1 Geographic segmentation

      • Exhibit 107: Chart on Market share by geography 2023-2028 (%)
      • Exhibit 108: Data Table on Market share by geography 2023-2028 (%)

    • 10.2 Geographic comparison

      • Exhibit 109: Chart on Geographic comparison
      • Exhibit 110: Data Table on Geographic comparison

    • 10.3 APAC - Market size and forecast 2023-2028

      • Exhibit 111: Chart on APAC - Market size and forecast 2023-2028 ($ million)
      • Exhibit 112: Data Table on APAC - Market size and forecast 2023-2028 ($ million)
      • Exhibit 113: Chart on APAC - Year-over-year growth 2023-2028 (%)
      • Exhibit 114: Data Table on APAC - Year-over-year growth 2023-2028 (%)

    • 10.4 North America - Market size and forecast 2023-2028

      • Exhibit 115: Chart on North America - Market size and forecast 2023-2028 ($ million)
      • Exhibit 116: Data Table on North America - Market size and forecast 2023-2028 ($ million)
      • Exhibit 117: Chart on North America - Year-over-year growth 2023-2028 (%)
      • Exhibit 118: Data Table on North America - Year-over-year growth 2023-2028 (%)

    • 10.5 Europe - Market size and forecast 2023-2028

      • Exhibit 119: Chart on Europe - Market size and forecast 2023-2028 ($ million)
      • Exhibit 120: Data Table on Europe - Market size and forecast 2023-2028 ($ million)
      • Exhibit 121: Chart on Europe - Year-over-year growth 2023-2028 (%)
      • Exhibit 122: Data Table on Europe - Year-over-year growth 2023-2028 (%)

    • 10.6 South America - Market size and forecast 2023-2028

      • Exhibit 123: Chart on South America - Market size and forecast 2023-2028 ($ million)
      • Exhibit 124: Data Table on South America - Market size and forecast 2023-2028 ($ million)
      • Exhibit 125: Chart on South America - Year-over-year growth 2023-2028 (%)
      • Exhibit 126: Data Table on South America - Year-over-year growth 2023-2028 (%)

    • 10.7 Middle East and Africa - Market size and forecast 2023-2028

      • Exhibit 127: Chart on Middle East and Africa - Market size and forecast 2023-2028 ($ million)
      • Exhibit 128: Data Table on Middle East and Africa - Market size and forecast 2023-2028 ($ million)
      • Exhibit 129: Chart on Middle East and Africa - Year-over-year growth 2023-2028 (%)
      • Exhibit 130: Data Table on Middle East and Africa - Year-over-year growth 2023-2028 (%)

    • 10.8 US - Market size and forecast 2023-2028

      • Exhibit 131: Chart on US - Market size and forecast 2023-2028 ($ million)
      • Exhibit 132: Data Table on US - Market size and forecast 2023-2028 ($ million)
      • Exhibit 133: Chart on US - Year-over-year growth 2023-2028 (%)
      • Exhibit 134: Data Table on US - Year-over-year growth 2023-2028 (%)

    • 10.9 China - Market size and forecast 2023-2028

      • Exhibit 135: Chart on China - Market size and forecast 2023-2028 ($ million)
      • Exhibit 136: Data Table on China - Market size and forecast 2023-2028 ($ million)
      • Exhibit 137: Chart on China - Year-over-year growth 2023-2028 (%)
      • Exhibit 138: Data Table on China - Year-over-year growth 2023-2028 (%)

    • 10.10 Japan - Market size and forecast 2023-2028

      • Exhibit 139: Chart on Japan - Market size and forecast 2023-2028 ($ million)
      • Exhibit 140: Data Table on Japan - Market size and forecast 2023-2028 ($ million)
      • Exhibit 141: Chart on Japan - Year-over-year growth 2023-2028 (%)
      • Exhibit 142: Data Table on Japan - Year-over-year growth 2023-2028 (%)

    • 10.11 Germany - Market size and forecast 2023-2028

      • Exhibit 143: Chart on Germany - Market size and forecast 2023-2028 ($ million)
      • Exhibit 144: Data Table on Germany - Market size and forecast 2023-2028 ($ million)
      • Exhibit 145: Chart on Germany - Year-over-year growth 2023-2028 (%)
      • Exhibit 146: Data Table on Germany - Year-over-year growth 2023-2028 (%)

    • 10.12 Canada - Market size and forecast 2023-2028

      • Exhibit 147: Chart on Canada - Market size and forecast 2023-2028 ($ million)
      • Exhibit 148: Data Table on Canada - Market size and forecast 2023-2028 ($ million)
      • Exhibit 149: Chart on Canada - Year-over-year growth 2023-2028 (%)
      • Exhibit 150: Data Table on Canada - Year-over-year growth 2023-2028 (%)

    • 10.13 Market opportunity by geography

      • Exhibit 151: Market opportunity by geography ($ million)
      • Exhibit 152: Data Tables on Market opportunity by geography ($ million)

    11 Drivers, Challenges, and Trends

    • 11.1 Market drivers

    • 11.2 Market challenges

    • 11.3 Impact of drivers and challenges

      • Exhibit 153: Impact of drivers and challenges in 2023 and 2028

    • 11.4 Market trends


    SAMPLE - Content Market 2024-2028

    12 Vendor Landscape

    • 12.1 Overview

    • 12.2 Vendor landscape

      • Exhibit 154: Overview on Criticality of inputs and Factors of differentiation

    • 12.3 Landscape disruption

      • Exhibit 155: Overview on factors of disruption

    • 12.4 Industry risks

      • Exhibit 156: Impact of key risks on business

    13 Vendor Analysis

    • 13.1 Vendors covered

      • Exhibit 157: Vendors covered

    • 13.2 Market positioning of vendors

      • Exhibit 158: Matrix on vendor position and classification

    • 13.3 Adobe Inc.

      • Exhibit 159: Adobe Inc. - Overview
      • Exhibit 160: Adobe Inc. - Business segments
      • Exhibit 161: Adobe Inc. - Key offerings
      • Exhibit 162: Adobe Inc. - Segment focus

    • 13.4 Alma Media

      • Exhibit 163: Alma Media - Overview
      • Exhibit 164: Alma Media - Product / Service
      • Exhibit 165: Alma Media - Key offerings

    • 13.5 Brafton Inc.

      • Exhibit 166: Brafton Inc. - Overview
      • Exhibit 167: Brafton Inc. - Product / Service
      • Exhibit 168: Brafton Inc. - Key offerings

    • 13.6 Contently Inc.

      • Exhibit 169: Contently Inc. - Overview
      • Exhibit 170: Contently Inc. - Product / Service
      • Exhibit 171: Contently Inc. - Key news
      • Exhibit 172: Contently Inc. - Key offerings

    • 13.7 Contentoo B.V.

      • Exhibit 173: Contentoo B.V. - Overview
      • Exhibit 174: Contentoo B.V. - Product / Service
      • Exhibit 175: Contentoo B.V. - Key offerings

    • 13.8 CoSchedule LLC

      • Exhibit 176: CoSchedule LLC - Overview
      • Exhibit 177: CoSchedule LLC - Product / Service
      • Exhibit 178: CoSchedule LLC - Key news
      • Exhibit 179: CoSchedule LLC - Key offerings

    • 13.9 Eucalypt LLC

      • Exhibit 180: Eucalypt LLC - Overview
      • Exhibit 181: Eucalypt LLC - Product / Service
      • Exhibit 182: Eucalypt LLC - Key offerings

    • 13.10 Hootsuite Inc

      • Exhibit 183: Hootsuite Inc - Overview
      • Exhibit 184: Hootsuite Inc - Product / Service
      • Exhibit 185: Hootsuite Inc - Key offerings

  • 13.11 HubSpot Inc.

    • Exhibit 186: HubSpot Inc. - Overview
    • Exhibit 187: HubSpot Inc. - Product / Service
    • Exhibit 188: HubSpot Inc. - Key news
    • Exhibit 189: HubSpot Inc. - Key offerings
    • 13.12 Influence and Co.

      • Exhibit 190: Influence and Co. - Overview
      • Exhibit 191: Influence and Co. - Product / Service
      • Exhibit 192: Influence and Co. - Key offerings

    • 13.13 Rock Content

      • Exhibit 193: Rock Content - Overview
      • Exhibit 194: Rock Content - Product / Service
      • Exhibit 195: Rock Content - Key offerings

    • 13.14 Seismic Software Inc.

      • Exhibit 196: Seismic Software Inc. - Overview
      • Exhibit 197: Seismic Software Inc. - Product / Service
      • Exhibit 198: Seismic Software Inc. - Key news
      • Exhibit 199: Seismic Software Inc. - Key offerings

    • 13.15 Skyword Inc.

      • Exhibit 200: Skyword Inc. - Overview
      • Exhibit 201: Skyword Inc. - Product / Service
      • Exhibit 202: Skyword Inc. - Key offerings

    • 13.16 Sprinklr Inc.

      • Exhibit 203: Sprinklr Inc. - Overview
      • Exhibit 204: Sprinklr Inc. - Product / Service
      • Exhibit 205: Sprinklr Inc. - Key news
      • Exhibit 206: Sprinklr Inc. - Key offerings

    • 13.17 Upland Software Inc.

      • Exhibit 207: Upland Software Inc. - Overview
      • Exhibit 208: Upland Software Inc. - Product / Service
      • Exhibit 209: Upland Software Inc. - Key news
      • Exhibit 210: Upland Software Inc. - Key offerings

    14 Appendix

    • 14.1 Scope of the report

    • 14.2 Inclusions and exclusions checklist

      • Exhibit 211: Inclusions checklist
      • Exhibit 212: Exclusions checklist

    • 14.3 Currency conversion rates for US$

      • Exhibit 213: Currency conversion rates for US$

    • 14.4 Research methodology

      • Exhibit 214: Research methodology
      • Exhibit 215: Validation techniques employed for market sizing
      • Exhibit 216: Information sources

    • 14.5 List of abbreviations

      • Exhibit 217: List of abbreviations


    SAMPLE - Content Market 2024-2028
      Deep dive market size
      • Additional segments
      • Additional region or country
      Vendor market share
      • By region/country
      • By segment
      Volume data (historical and forecast) by
      • Region or country or segment
      • Up to 10-year historical forecast
      Detailed analysis
      • Regulatory landscape
      • Mergers & Acquisitions
      • List of distributors or customers
      • Production, export or imports
      • Cost structure
      • Trends, drivers and challenges for specific region or country or segment
      • Price analysis for products or services or regions or country or segments
      • Installed based for products or services for region or country
      • For health care sector: procedure volumes or cost
      Company profiles: addition or new vendors including further deep dive profiling or market share analysis:
      • Brief overview
      • Headquarter/Geographical Presence
      • Revenue (Global/Regional/Country level)
      • Employees
      • Market share analysis
      • Product/service portfolio
      • SWOT analysis
      • Production locations and capacity
      • Average Selling Price (ASP) of product or services
      • Key News (Mergers and Acquisitions, New product launches, Geographical expansion, etc.)

    North America

    110 E. Schiller, #208, Elmhurst, IL 60126, U.S.A.
    Tel: +1 630 530 7340

    Asia Pacific

    Asia-Pacific 1st Floor - Left Wing, Embassy Signet, Cessna Business Park, Kadubeesanahalli Outer Ring Road, Bengaluru 560103, India
    Tel: +91 806 191 4606

    Europe

    Europe 8 Wimpole Street, W1G 9SP, London, United Kingdom.
    Tel: +44 203 893 3400

    About Us

    Technavio is a division of Infiniti Research - a leading market intelligence company with a global presence. We study markets in more than 100 countries to help you analyze competitive activity, see beyond market disruptions, and develop intelligent business strategies. With over a decade of experience and offices across three continents, we regularly provide deep-dive market assessment, strategy and research services to more than a 1,000 leading global companies. You can reach us at hello@infinitiresearch.com

    DISCLAIMER

    This report has been prepared from sources and data that we believe to be reliable, but we make no representation as to its accuracy or completeness. Any decision or action taken by the recipient based on this report shall be solely and entirely at the risk of the recipient. Opinions and information provided are made as at the date of the report issue and are subject to change without notice. All trademarks and copyrights remain the sole ownership of their rightful owners/licensees. In no event shall Infiniti research have any liability to any party for special, incidental, tort, or consequential damages arising out of or in connection with this report, even if Infiniti Research has been advised of the possibility of such damages. Reproduction without written permission is completely forbidden. NOT FOR FURTHER DISTRIBUTION. Copyright © 2024 Infiniti Research. All Rights Reserved.

    SKU: IRTNTR41556

    Content Market 2024-2028

    x1 $2500

    Smart Deal (Save 20% today)

    - $500
    Ends in
    Subtotal $2000.00 $2500
    Total $2000.00 $2500
    Buy Now

    Technavio Unlock the full report within minutes.