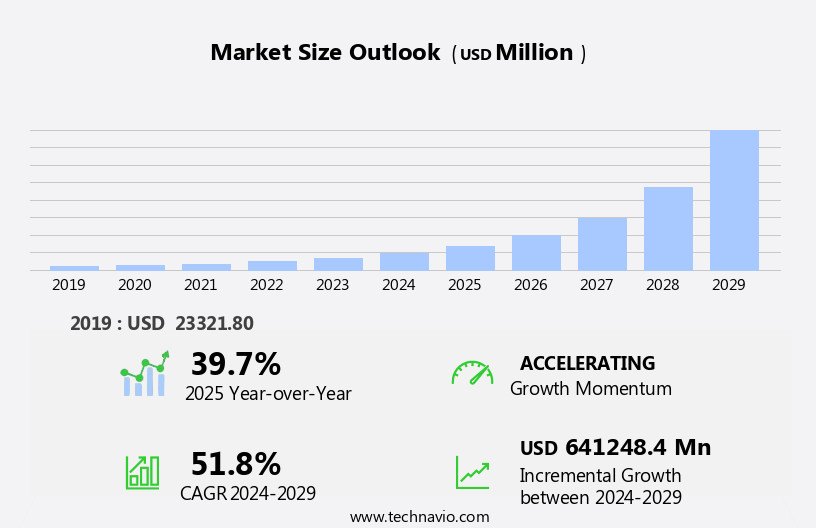
Chart on Global - Market size and forecast 2019-2029 (USD mn)
| Historic Data 2019 - 2023 (USD mn )
|
Forecasted Data 2024 - 2029 (USD mn )
|

|
|
Augmented Reality (AR) and Virtual Reality (VR) technologies are revolutionizing various industries by offering immersive and interactive experiences. VR, characterized by a 3D, computer-generated environment, is delivered via dedicated headsets or smartphones, often accompanied by 3D audio and haptic feedback. Applications span gaming, construction, retail, e-commerce, healthcare, education, media and entertainment, and marketing. AR, in contrast, overlays digital content onto the real world, enhancing it with sound, video, or graphics. In healthcare, VR facilitates real-time training and surgical visualization, while AR enables virtual try-ons and complex surgery assistance. These technologies, driven by artificial intelligence, are transforming digital content and redefining user experiences.
- Technavio reports elaborately highlights the historic market size from 2019 to 2024. Furthermost we also provide the forecast till 2029 with in-depth market share and their CAGR.
- We also have 10+ specific vendor with their key offering and product/service segments in specific.
Unlock the full report within minutes