Commercial Aircraft Leasing Market Analysis, Size, and Forecast 2026-2030: APAC (China, India, and Japan), Europe (Germany, UK, and France), North America (US, Canada, and Mexico), South America (Brazil and Argentina), Middle East and Africa (UAE, Saudi Arabia, and South Africa), and Rest of World (ROW)

Commercial Aircraft Leasing Market Analysis, Size, and Forecast 2026-2030:
APAC (China, India, and Japan), Europe (Germany, UK, and France), North America (US, Canada, and Mexico), South America (Brazil and Argentina), Middle East and Africa (UAE, Saudi Arabia, and South Africa), and Rest of World (ROW)

Published: Mar 2026 296 Pages SKU: IRTNTR70321

Market Overview at a Glance

$28.38 B
Market Opportunity
11.3%
CAGR 2025 - 2030
41%
APAC Growth
$15.14 B
Narrow-body aircrafts segment 2024

Commercial Aircraft Leasing Market Size 2026-2030

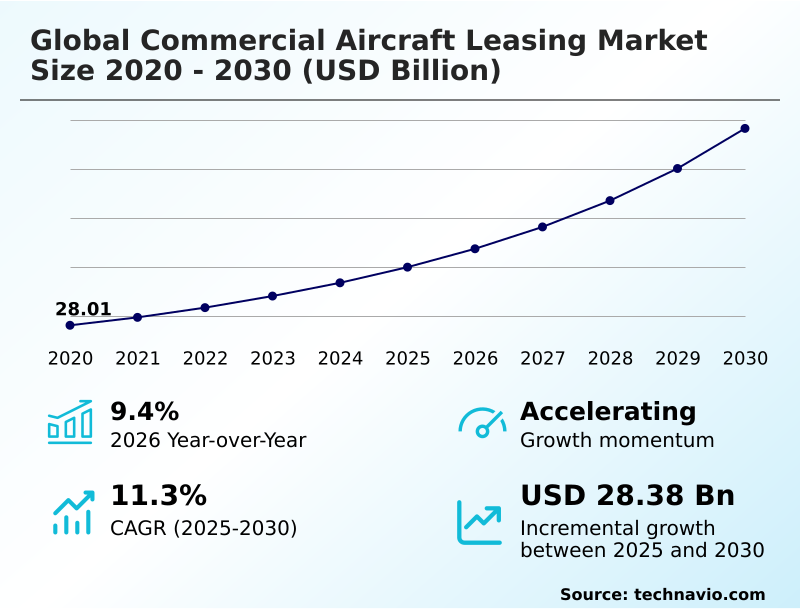
The commercial aircraft leasing market size is valued to increase by USD 28.38 billion, at a CAGR of 11.3% from 2025 to 2030. Growing strategic shift toward widebody leasing for long-haul recovery will drive the commercial aircraft leasing market.

Major Market Trends & Insights

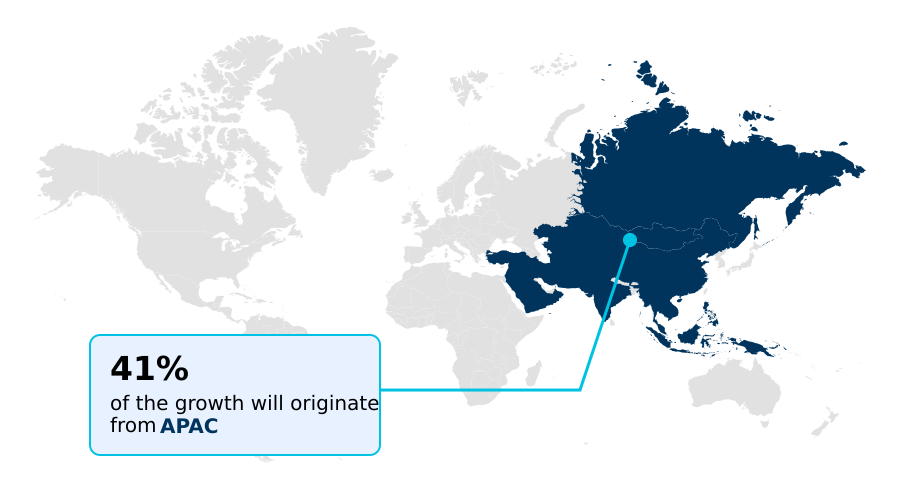
  • APAC dominated the market and accounted for a 41% growth during the forecast period.
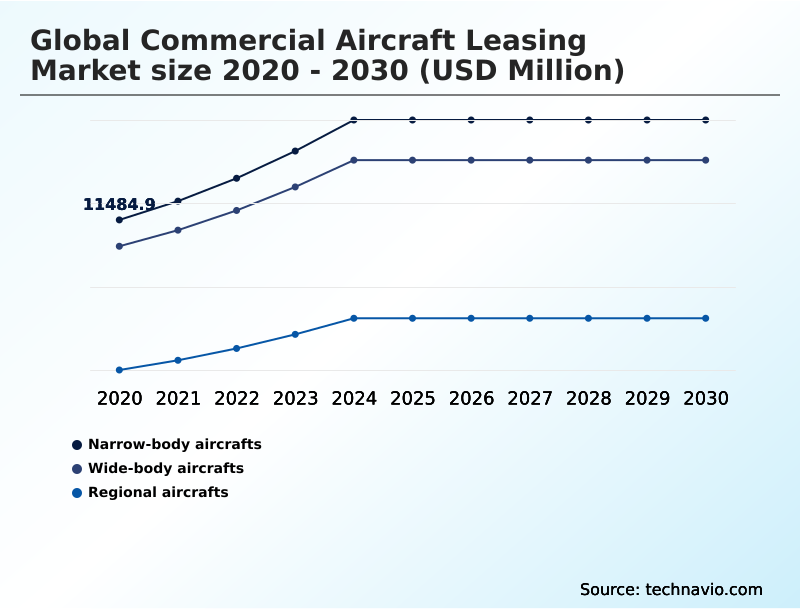
  • By Product - Narrow-body aircrafts segment was valued at USD 15.14 billion in 2024
  • By Type - Wet lease segment accounted for the largest market revenue share in 2024

Market Size & Forecast

  • Market Opportunities: USD 40.28 billion
  • Market Future Opportunities: USD 28.38 billion
  • CAGR from 2025 to 2030 : 11.3%

Market Summary

  • The commercial aircraft leasing market functions as a critical financial and operational backbone for the global aviation industry, enabling airlines to manage fleet flexibility and capital expenditure. Lessors provide access to aircraft through arrangements like the dry lease structure and wet lease agreement, allowing carriers to scale capacity in response to demand without the heavy upfront investment of direct purchases.
  • A primary driver is the widespread adoption of the sale-and-leaseback transaction, where airlines sell new aircraft to lessors and lease them back, unlocking immediate capital for operational resilience. This dynamic is crucial for a fleet modernization strategy, as carriers seek next-generation assets to comply with fuel efficiency standards and environmental mandates.
  • For instance, an airline might leverage leasing to upgrade its fleet, reducing fuel burn by over 15% and aligning with sustainability-linked financing goals. However, the sector faces significant headwinds from supply chain dislocation and OEM delivery delays, creating scarcity and elevating lease rates.
  • Concurrently, managing residual value risk and navigating jurisdictional risk in emerging markets remain persistent challenges that shape lessor strategy and portfolio management solutions.

What will be the Size of the Commercial Aircraft Leasing Market during the forecast period?

Get Key Insights on Market Forecast (PDF) Request Free Sample

How is the Commercial Aircraft Leasing Market Segmented?

The commercial aircraft leasing industry research report provides comprehensive data (region-wise segment analysis), with forecasts and estimates in "USD million" for the period 2026-2030, as well as historical data from 2020-2024 for the following segments.

  • Product
    • Narrow-body aircrafts
    • Wide-body aircrafts
    • Regional aircrafts
  • Type
    • Wet lease
    • Dry lease
  • Application
    • Passenger
    • Freight
  • Usage
    • Short-term
    • Long-term
  • Geography
    • APAC
      • China
      • India
      • Japan
    • Europe
      • Germany
      • UK
      • France
    • North America
      • US
      • Canada
      • Mexico
    • South America
      • Brazil
      • Argentina
    • Middle East and Africa
      • UAE
      • Saudi Arabia
      • South Africa
    • Rest of World (ROW)

By Product Insights

The narrow-body aircrafts segment is estimated to witness significant growth during the forecast period.

The narrow-body aircraft segment is the cornerstone of the market, prized for its operational versatility and strong narrowbody aircraft liquidity. These single-aisle jets, essential for high-frequency domestic and regional routes, are central to airline fleet modernization strategy.

Lessors favor this segment for its broad operator base and stable asset values, which simplifies aircraft remarketing. Demand is fueled by the need to replace older fleets, with new-generation models reducing fuel consumption by up to 20%.

The high cost of funds makes direct purchasing difficult, reinforcing the reliance on lessors. The segment's resilience is supported by robust aircraft financing mechanisms like fixed-rate notes and green bonds.

However, persistent supply chain dislocation creates challenges, leading to potential asset valuation impairments on older jets as carriers await new deliveries.

Request Free Sample

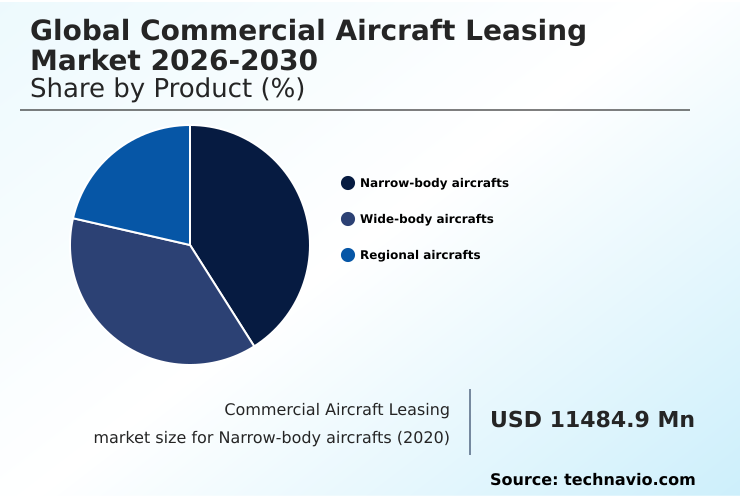
The Narrow-body aircrafts segment was valued at USD 15.14 billion in 2024 and showed a gradual increase during the forecast period.

Request Free Sample

Regional Analysis

APAC is estimated to contribute 41% to the growth of the global market during the forecast period.Technavio’s analysts have elaborately explained the regional trends and drivers that shape the market during the forecast period.

See How Commercial Aircraft Leasing Market Demand is Rising in APAC Request Free Sample

The geographic landscape is shifting, with APAC poised to account for over 41% of incremental growth, driven by fleet expansion in China and India.

In North America, which shows a strong growth trajectory, carriers are leveraging leasing to mitigate supply chain dislocation and secure lift. European operators are aggressively pursuing portfolio management solutions to comply with carbon reduction mandates, prioritizing new technology aircraft.

Specialized financial instruments are gaining traction globally; for example, the japanese operating lease and sharia-compliant lease products are channeling new capital into the industry. Meanwhile, sovereign-backed leasing platforms in the Middle East are reshaping regional competition.

The effectiveness of a dry lease structure versus a wet lease agreement varies by region, depending on operational needs and regulatory environments, influencing how lessors deploy assets.

Market Dynamics

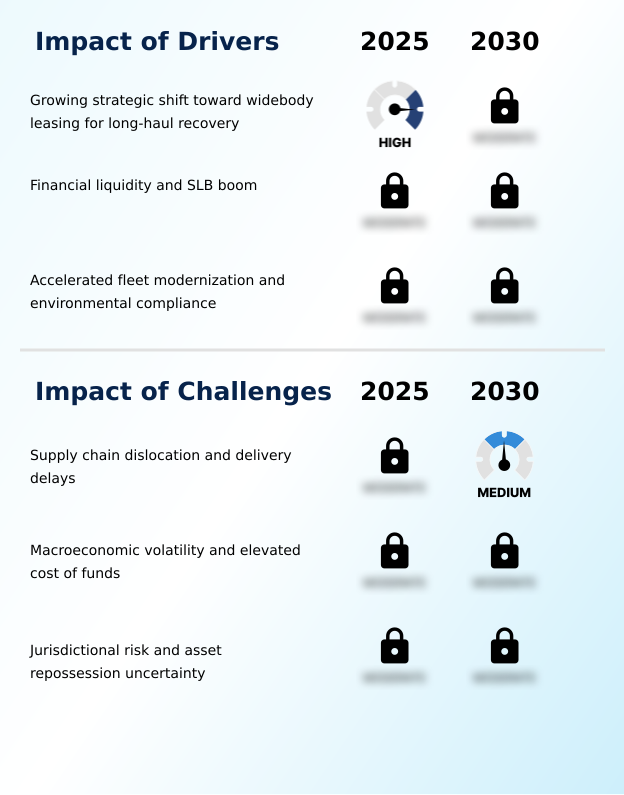
Our researchers analyzed the data with 2025 as the base year, along with the key drivers, trends, and challenges. A holistic analysis of drivers will help companies refine their marketing strategies to gain a competitive advantage.

  • Understanding the commercial aircraft leasing market dynamics requires analyzing several interconnected factors. The impact of OEM delivery delays on lessors is a central challenge, creating revenue uncertainty and complicating fleet management. In response, the sale-and-leaseback model for fleet expansion has become a primary tool for airlines to secure new assets while preserving capital.
  • This aligns with the broader role of leasing in fleet modernization strategies, allowing carriers to adopt new technology without bearing full ownership risk. A key trend is the strategic pivot toward widebody asset acquisition, driven by the strong recovery in international travel.
  • The demand drivers for widebody aircraft leasing are now outpacing those for narrowbodies in terms of value, leading to new opportunities in the secondary widebody market. Financially, the effect of interest rates on lessor profitability is forcing more disciplined capital allocation, while asset-backed securitization for aircraft portfolios remains a vital liquidity source.
  • The economics of passenger-to-freighter p2f conversions are also gaining attention, offering a second life for mid-life assets. Operationally, a comparison of wet lease vs dry lease structures shows that long-term dry leases still dominate, but demand for short-term wet leases is growing faster.
  • Throughout these activities, managing residual value risk for leased aircraft and navigating jurisdictional risk in aircraft finance are constant priorities. The Cape Town Convention helps, but challenges of aircraft repossession in emerging markets persist.
  • Finally, the rise of sustainability-linked financing in aviation leasing is fundamentally reshaping how deals are structured, reflecting the industry's commitment to decarbonization and providing a new lens through which to view the trends in the global commercial aircraft leasing market 2026-2030.

What are the key market drivers leading to the rise in the adoption of Commercial Aircraft Leasing Industry?

  • The market is primarily driven by a strategic shift toward widebody aircraft leasing, which is fueled by the strong recovery of long-haul international networks.

  • A key driver is the urgent need for fleet renewal to meet environmental social governance (ESG) goals and achieve significant operational cost savings.
  • Lessors act as the primary conduit for ESG capital, facilitating the adoption of aircraft that meet new fuel efficiency standards.
  • This transition is made possible through sustainability-linked financing, which ties financial terms to performance targets like increased sustainable aviation fuel usage. Simultaneously, the strategic prioritization of liquidity has fueled a boom in sale-and-leaseback transactions, allowing carriers to optimize balance sheets.
  • Short-term capacity gaps, often filled by an ACMI provider under a flight crew maintenance insurance model, highlight the market's need for flexibility.
  • These drivers collectively strengthen the lessor's role in providing capital and asset management expertise, with some airlines reporting a 15% improvement in capital efficiency.

What are the market trends shaping the Commercial Aircraft Leasing Industry?

  • A strategic resurgence in widebody asset acquisition is reshaping the market. Lessors are rebalancing portfolios to capitalize on the scarcity of production slots and a robust recovery in long-haul international travel.

  • A dominant trend is the strategic pivot toward widebody asset acquisition, driven by recovering long-haul international networks. An aviation finance company is now balancing portfolios beyond the commercial jet transport aircraft to capitalize on higher margins. This shift is complemented by the industrial-scale acceleration of passenger-to-freighter conversion, creating new revenue streams for mid-life assets and strengthening the air cargo network.
  • The financial architecture is also evolving, with asset-backed securitization becoming more common for managing large portfolios. These trends transform how lessors manage the aircraft operating lease, moving from simple financing to complex asset lifecycle management.
  • This strategic repositioning is critical for navigating a market where growth in the regional aircraft market outpaces certain legacy segments and the risk of airline insolvency remains a constant consideration.

What challenges does the Commercial Aircraft Leasing Industry face during its growth?

  • Systemic supply chain dislocations and persistent delivery delays from original equipment manufacturers present a key challenge affecting industry growth.

  • The market faces significant challenges, primarily from production slot scarcity, which complicates fleet planning support and hinders growth for airlines seeking to expand. The inability of airframe manufacturers to meet demand for next-generation assets, including both single-aisle transactions and twin-aisle segment orders, creates a significant capital expenditure burden. This forces airlines toward balance sheet optimization through leasing.
  • Managing aircraft lifecycle management becomes more complex as operators extend leases on older jets while awaiting new deliveries. This dynamic is exacerbated by OEM delivery delays, which have a cascading effect across the industry.
  • The carbon intensity of the fleet remains a concern as the transition to more efficient models like the Airbus A330neo and Embraer e-jet e2 family is slowed by these supply-side constraints.

Exclusive Technavio Analysis on Customer Landscape

The commercial aircraft leasing market forecasting report includes the adoption lifecycle of the market, covering from the innovator’s stage to the laggard’s stage. It focuses on adoption rates in different regions based on penetration. Furthermore, the commercial aircraft leasing market report also includes key purchase criteria and drivers of price sensitivity to help companies evaluate and develop their market growth analysis strategies.

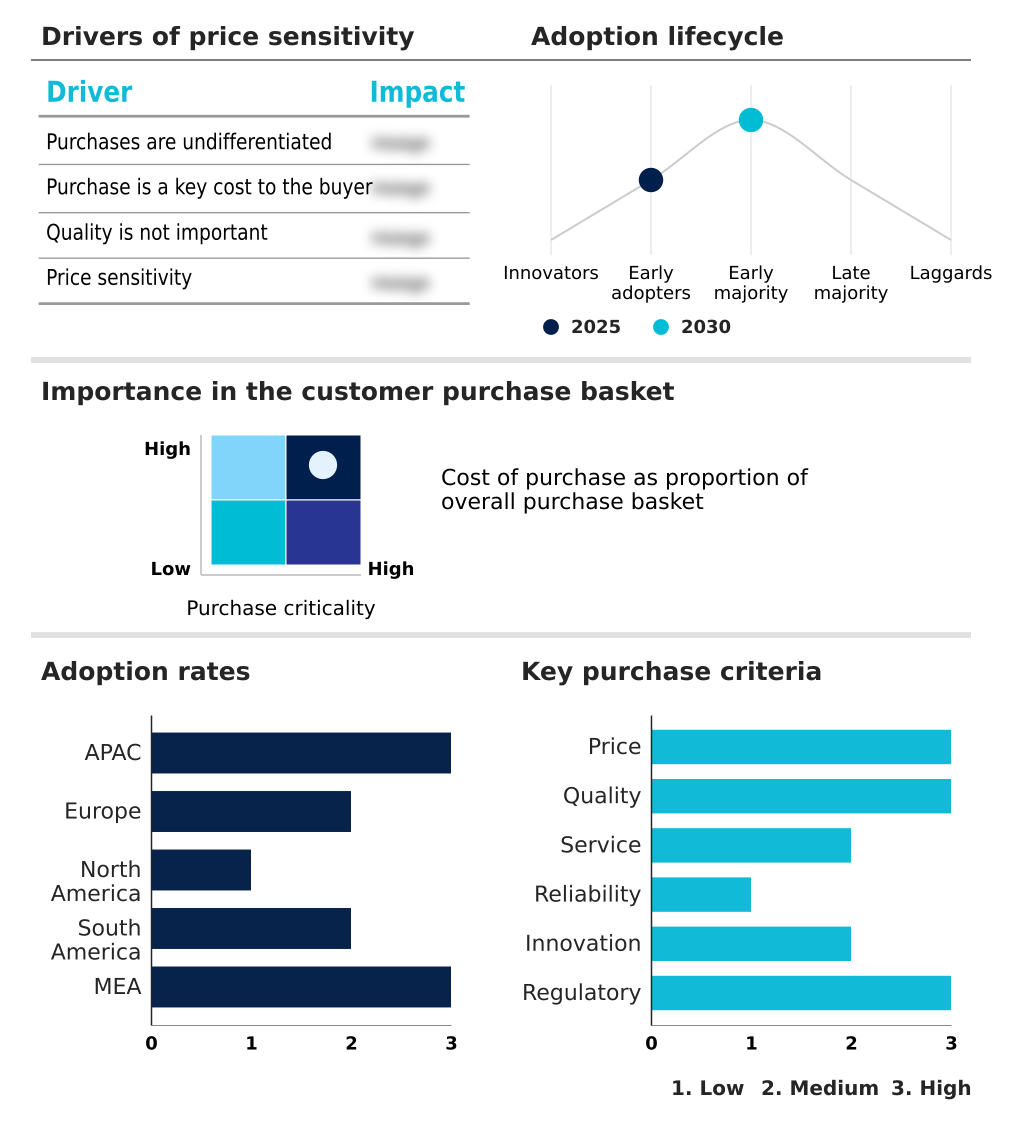
Customer Landscape of Commercial Aircraft Leasing Industry

Competitive Landscape

Companies are implementing various strategies, such as strategic alliances, commercial aircraft leasing market forecast, partnerships, mergers and acquisitions, geographical expansion, and product/service launches, to enhance their presence in the industry.

AerCap Holdings N.V. - Providers deliver comprehensive fleet solutions, including operating leases, sale-and-leaseback transactions, and aircraft portfolio management, facilitating airline fleet modernization and financial flexibility.

The industry research and growth report includes detailed analyses of the competitive landscape of the market and information about key companies, including:

  • AerCap Holdings N.V.
  • Air Lease Corp.
  • Aircastle Ltd.
  • Aviation Capital Group
  • Avolon Aerospace Leasing Ltd.
  • Azorra Aviation Holdings LLC
  • BBAM US LP
  • BOC Aviation Ltd.
  • CDB Aviation
  • DAE Ltd.
  • Deucalion Aviation Ltd.
  • ICBC Financial Leasing Co.
  • Jackson Square Aviation LLC
  • Macquarie Group Ltd.
  • SMBC Aviation Capital Ltd.
  • Stratos
  • The Carlyle Group Inc.
  • TrueNoord

Qualitative and quantitative analysis of companies has been conducted to help clients understand the wider business environment as well as the strengths and weaknesses of key industry players. Data is qualitatively analyzed to categorize companies as pure play, category-focused, industry-focused, and diversified; it is quantitatively analyzed to categorize companies as dominant, leading, strong, tentative, and weak.

Recent Development and News in Commercial aircraft leasing market

  • In January 2025, CDB Aviation announced the delivery of a new Boeing 737-8 to United Airlines as part of a broader series of sale-and-leaseback transactions supporting the carrier's fleet modernization and capital efficiency.
  • In February 2025, Air Lease Corp. released its financial results, highlighting significant operational strain from persistent delivery slippages by major manufacturers that compromised its order book and necessitated constant renegotiations with airline customers.
  • In March 2025, BOC Aviation Limited successfully priced a $500 million issuance of green notes, with proceeds specifically allocated to financing latest-technology aircraft that meet rigorous fuel efficiency standards.
  • In April 2025, Avolon issued a trading update for its first quarter, revealing a significant uptick in the placement of new technology aircraft like the Airbus A320neo and Boeing 737 MAX, directly linked to customers' aggressive sustainability roadmaps.

Dive into Technavio’s robust research methodology, blending expert interviews, extensive data synthesis, and validated models for unparalleled Commercial Aircraft Leasing Market insights. See full methodology.

Market Scope
Page number 296
Base year 2025
Historic period 2020-2024
Forecast period 2026-2030
Growth momentum & CAGR Accelerate at a CAGR of 11.3%
Market growth 2026-2030 USD 28381.9 million
Market structure Fragmented
YoY growth 2025-2026(%) 9.4%
Key countries China, India, Japan, Singapore, Australia, Indonesia, Ireland, Germany, UK, France, The Netherlands, Spain, US, Canada, Mexico, Brazil, Argentina, Chile, UAE, Saudi Arabia, South Africa, Egypt and Turkey
Competitive landscape Leading Companies, Market Positioning of Companies, Competitive Strategies, and Industry Risks

Request Free Sample

Research Analyst Overview

  • The commercial aircraft leasing market is defined by its indispensable role in financing a fleet modernization strategy and managing asset valuation impairments for airlines globally. Lessors facilitate the transition to new technology aircraft, enabling carriers to meet stringent carbon reduction mandates and achieve fuel efficiency standards.
  • This is critical as operational cost savings from a 15% to 20% reduction in fuel burn can offset lease payments. Key mechanisms include the aircraft operating lease and the sale-and-leaseback transaction, which provide liquidity and remove residual value risk from airline balance sheets.
  • However, the landscape is fraught with challenges, including OEM delivery delays and supply chain dislocation, which disrupt revenue streams tied to pre-delivery payments. Jurisdictional risk premium and asset repossession uncertainty, despite protections from the Cape Town Convention, remain concerns. Lessors navigate this environment through sophisticated aircraft remarketing and portfolio management solutions, and by managing engine maintenance reserves.
  • The market's financial architecture relies on aircraft financing tools like asset-backed securitization, green bonds, and fixed-rate notes to manage the cost of funds and net interest margins. Ultimately, success hinges on balancing widebody asset acquisition with narrowbody aircraft liquidity and aircraft lifecycle management.

What are the Key Data Covered in this Commercial Aircraft Leasing Market Research and Growth Report?

  • What is the expected growth of the Commercial Aircraft Leasing Market between 2026 and 2030?

    • USD 28.38 billion, at a CAGR of 11.3%

  • What segmentation does the market report cover?

    • The report is segmented by Product (Narrow-body aircrafts, Wide-body aircrafts, and Regional aircrafts), Type (Wet lease, and Dry lease), Application (Passenger, and Frieght), Usage (Short-term, and Long-term) and Geography (APAC, Europe, North America, South America, Middle East and Africa)

  • Which regions are analyzed in the report?

    • APAC, Europe, North America, South America and Middle East and Africa

  • What are the key growth drivers and market challenges?

    • Growing strategic shift toward widebody leasing for long-haul recovery, Supply chain dislocation and delivery delays

  • Who are the major players in the Commercial Aircraft Leasing Market?

    • AerCap Holdings N.V., Air Lease Corp., Aircastle Ltd., Aviation Capital Group, Avolon Aerospace Leasing Ltd., Azorra Aviation Holdings LLC, BBAM US LP, BOC Aviation Ltd., CDB Aviation, DAE Ltd., Deucalion Aviation Ltd., ICBC Financial Leasing Co., Jackson Square Aviation LLC, Macquarie Group Ltd., SMBC Aviation Capital Ltd., Stratos, The Carlyle Group Inc. and TrueNoord

Market Research Insights

  • Market dynamics are increasingly shaped by the pursuit of balance sheet optimization and the need to manage capital expenditure burden. Airlines are leveraging lessors to access commercial jet transport aircraft for long-haul international networks without large upfront costs. This is particularly true in the regional aircraft market, where fleet flexibility is paramount.
  • An aviation finance company now plays a critical role in facilitating access to models like the Boeing 787 Dreamliner and the Airbus A320neo family, with lease agreements often leading to operational cost savings of 15% or more. The scarcity of production slots has further elevated the lessor's importance.
  • The ability to structure financing around environmental social governance (ESG) principles, addressing the carbon intensity of a fleet, is becoming a key competitive differentiator, with ESG-aligned portfolios showing a 10% higher placement rate.

We can help! Our analysts can customize this commercial aircraft leasing market research report to meet your requirements.

Get in touch

1. Executive Summary

1.1 Market overview

Executive Summary - Chart on Market Overview
Executive Summary - Data Table on Market Overview
Executive Summary - Chart on Global Market Characteristics
Executive Summary - Chart on Market by Geography
Executive Summary - Chart on Market Segmentation by Product
Executive Summary - Chart on Market Segmentation by Type
Executive Summary - Chart on Market Segmentation by Application
Executive Summary - Chart on Market Segmentation by Usage
Executive Summary - Chart on Incremental Growth
Executive Summary - Data Table on Incremental Growth
Executive Summary - Chart on Company Market Positioning

2. Technavio Analysis

2.1 Analysis of price sensitivity, lifecycle, customer purchase basket, adoption rates, and purchase criteria

2.2 Criticality of inputs and Factors of differentiation

Chart on Overview on criticality of inputs and factors of differentiation

2.3 Factors of disruption

Chart on Overview on factors of disruption

2.4 Impact of drivers and challenges

Chart on Impact of drivers and challenges in 2025 and 2030

3. Market Landscape

3.1 Market ecosystem

Chart on Parent Market
Data Table on - Parent Market

3.2 Market characteristics

Chart on Market characteristics analysis

3.3 Value chain analysis

Chart on Value chain analysis

4. Market Sizing

4.1 Market definition

Data Table on Offerings of companies included in the market definition

4.2 Market segment analysis

Market segments

4.3 Market size 2025

4.4 Market outlook: Forecast for 2025-2030

Chart on Global - Market size and forecast 2025-2030 ($ million)
Data Table on Global - Market size and forecast 2025-2030 ($ million)
Chart on Global Market: Year-over-year growth 2025-2030 (%)
Data Table on Global Market: Year-over-year growth 2025-2030 (%)

5. Historic Market Size

5.1 Global Commercial Aircraft Leasing Market 2020 - 2024

Historic Market Size - Data Table on Global Commercial Aircraft Leasing Market 2020 - 2024 ($ million)

5.2 Product segment analysis 2020 - 2024

Historic Market Size - Product Segment 2020 - 2024 ($ million)

5.3 Type segment analysis 2020 - 2024

Historic Market Size - Type Segment 2020 - 2024 ($ million)

5.4 Application segment analysis 2020 - 2024

Historic Market Size - Application Segment 2020 - 2024 ($ million)

5.5 Usage segment analysis 2020 - 2024

Historic Market Size - Usage Segment 2020 - 2024 ($ million)

5.6 Geography segment analysis 2020 - 2024

Historic Market Size - Geography Segment 2020 - 2024 ($ million)

5.7 Country segment analysis 2020 - 2024

Historic Market Size - Country Segment 2020 - 2024 ($ million)

6. Qualitative Analysis

6.1 Impact of AI on Global Commercial Aircraft Leasing Market

7. Five Forces Analysis

7.1 Five forces summary

Five forces analysis - Comparison between 2025 and 2030

7.2 Bargaining power of buyers

Bargaining power of buyers - Impact of key factors 2025 and 2030

7.3 Bargaining power of suppliers

Bargaining power of suppliers - Impact of key factors in 2025 and 2030

7.4 Threat of new entrants

Threat of new entrants - Impact of key factors in 2025 and 2030

7.5 Threat of substitutes

Threat of substitutes - Impact of key factors in 2025 and 2030

7.6 Threat of rivalry

Threat of rivalry - Impact of key factors in 2025 and 2030

7.7 Market condition

Chart on Market condition - Five forces 2025 and 2030

8. Market Segmentation by Product

8.1 Market segments

Chart on Product - Market share 2025-2030 (%)
Data Table on Product - Market share 2025-2030 (%)

8.2 Comparison by Product

Chart on Comparison by Product
Data Table on Comparison by Product

8.3 Narrow-body aircrafts - Market size and forecast 2025-2030

Chart on Narrow-body aircrafts - Market size and forecast 2025-2030 ($ million)
Data Table on Narrow-body aircrafts - Market size and forecast 2025-2030 ($ million)
Chart on Narrow-body aircrafts - Year-over-year growth 2025-2030 (%)
Data Table on Narrow-body aircrafts - Year-over-year growth 2025-2030 (%)

8.4 Wide-body aircrafts - Market size and forecast 2025-2030

Chart on Wide-body aircrafts - Market size and forecast 2025-2030 ($ million)
Data Table on Wide-body aircrafts - Market size and forecast 2025-2030 ($ million)
Chart on Wide-body aircrafts - Year-over-year growth 2025-2030 (%)
Data Table on Wide-body aircrafts - Year-over-year growth 2025-2030 (%)

8.5 Regional aircrafts - Market size and forecast 2025-2030

Chart on Regional aircrafts - Market size and forecast 2025-2030 ($ million)
Data Table on Regional aircrafts - Market size and forecast 2025-2030 ($ million)
Chart on Regional aircrafts - Year-over-year growth 2025-2030 (%)
Data Table on Regional aircrafts - Year-over-year growth 2025-2030 (%)

8.6 Market opportunity by Product

Market opportunity by Product ($ million)
Data Table on Market opportunity by Product ($ million)

9. Market Segmentation by Type

9.1 Market segments

Chart on Type - Market share 2025-2030 (%)
Data Table on Type - Market share 2025-2030 (%)

9.2 Comparison by Type

Chart on Comparison by Type
Data Table on Comparison by Type

9.3 Wet lease - Market size and forecast 2025-2030

Chart on Wet lease - Market size and forecast 2025-2030 ($ million)
Data Table on Wet lease - Market size and forecast 2025-2030 ($ million)
Chart on Wet lease - Year-over-year growth 2025-2030 (%)
Data Table on Wet lease - Year-over-year growth 2025-2030 (%)

9.4 Dry lease - Market size and forecast 2025-2030

Chart on Dry lease - Market size and forecast 2025-2030 ($ million)
Data Table on Dry lease - Market size and forecast 2025-2030 ($ million)
Chart on Dry lease - Year-over-year growth 2025-2030 (%)
Data Table on Dry lease - Year-over-year growth 2025-2030 (%)

9.5 Market opportunity by Type

Market opportunity by Type ($ million)
Data Table on Market opportunity by Type ($ million)

10. Market Segmentation by Application

10.1 Market segments

Chart on Application - Market share 2025-2030 (%)
Data Table on Application - Market share 2025-2030 (%)

10.2 Comparison by Application

Chart on Comparison by Application
Data Table on Comparison by Application

10.3 Passenger - Market size and forecast 2025-2030

Chart on Passenger - Market size and forecast 2025-2030 ($ million)
Data Table on Passenger - Market size and forecast 2025-2030 ($ million)
Chart on Passenger - Year-over-year growth 2025-2030 (%)
Data Table on Passenger - Year-over-year growth 2025-2030 (%)

10.4 Freight - Market size and forecast 2025-2030

Chart on Freight - Market size and forecast 2025-2030 ($ million)
Data Table on Freight - Market size and forecast 2025-2030 ($ million)
Chart on Freight - Year-over-year growth 2025-2030 (%)
Data Table on Freight - Year-over-year growth 2025-2030 (%)

10.5 Market opportunity by Application

Market opportunity by Application ($ million)
Data Table on Market opportunity by Application ($ million)

11. Market Segmentation by Usage

11.1 Market segments

Chart on Usage - Market share 2025-2030 (%)
Data Table on Usage - Market share 2025-2030 (%)

11.2 Comparison by Usage

Chart on Comparison by Usage
Data Table on Comparison by Usage

11.3 Short-term - Market size and forecast 2025-2030

Chart on Short-term - Market size and forecast 2025-2030 ($ million)
Data Table on Short-term - Market size and forecast 2025-2030 ($ million)
Chart on Short-term - Year-over-year growth 2025-2030 (%)
Data Table on Short-term - Year-over-year growth 2025-2030 (%)

11.4 Long-term - Market size and forecast 2025-2030

Chart on Long-term - Market size and forecast 2025-2030 ($ million)
Data Table on Long-term - Market size and forecast 2025-2030 ($ million)
Chart on Long-term - Year-over-year growth 2025-2030 (%)
Data Table on Long-term - Year-over-year growth 2025-2030 (%)

11.5 Market opportunity by Usage

Market opportunity by Usage ($ million)
Data Table on Market opportunity by Usage ($ million)

12. Customer Landscape

12.1 Customer landscape overview

Analysis of price sensitivity, lifecycle, customer purchase basket, adoption rates, and purchase criteria

13. Geographic Landscape

13.1 Geographic segmentation

Chart on Market share by geography 2025-2030 (%)
Data Table on Market share by geography 2025-2030 (%)

13.2 Geographic comparison

Chart on Geographic comparison
Data Table on Geographic comparison

13.3 APAC - Market size and forecast 2025-2030

Chart on APAC - Market size and forecast 2025-2030 ($ million)
Data Table on APAC - Market size and forecast 2025-2030 ($ million)
Chart on APAC - Year-over-year growth 2025-2030 (%)
Data Table on APAC - Year-over-year growth 2025-2030 (%)
Chart on Regional Comparison - APAC
Data Table on Regional Comparison - APAC

13.3.1 China - Market size and forecast 2025-2030

Chart on China - Market size and forecast 2025-2030 ($ million)
Data Table on China - Market size and forecast 2025-2030 ($ million)
Chart on China - Year-over-year growth 2025-2030 (%)
Data Table on China - Year-over-year growth 2025-2030 (%)

13.3.2 India - Market size and forecast 2025-2030

Chart on India - Market size and forecast 2025-2030 ($ million)
Data Table on India - Market size and forecast 2025-2030 ($ million)
Chart on India - Year-over-year growth 2025-2030 (%)
Data Table on India - Year-over-year growth 2025-2030 (%)

13.3.3 Japan - Market size and forecast 2025-2030

Chart on Japan - Market size and forecast 2025-2030 ($ million)
Data Table on Japan - Market size and forecast 2025-2030 ($ million)
Chart on Japan - Year-over-year growth 2025-2030 (%)
Data Table on Japan - Year-over-year growth 2025-2030 (%)

13.3.4 Singapore - Market size and forecast 2025-2030

Chart on Singapore - Market size and forecast 2025-2030 ($ million)
Data Table on Singapore - Market size and forecast 2025-2030 ($ million)
Chart on Singapore - Year-over-year growth 2025-2030 (%)
Data Table on Singapore - Year-over-year growth 2025-2030 (%)

13.3.5 Australia - Market size and forecast 2025-2030

Chart on Australia - Market size and forecast 2025-2030 ($ million)
Data Table on Australia - Market size and forecast 2025-2030 ($ million)
Chart on Australia - Year-over-year growth 2025-2030 (%)
Data Table on Australia - Year-over-year growth 2025-2030 (%)

13.3.6 Indonesia - Market size and forecast 2025-2030

Chart on Indonesia - Market size and forecast 2025-2030 ($ million)
Data Table on Indonesia - Market size and forecast 2025-2030 ($ million)
Chart on Indonesia - Year-over-year growth 2025-2030 (%)
Data Table on Indonesia - Year-over-year growth 2025-2030 (%)

13.4 Europe - Market size and forecast 2025-2030

Chart on Europe - Market size and forecast 2025-2030 ($ million)
Data Table on Europe - Market size and forecast 2025-2030 ($ million)
Chart on Europe - Year-over-year growth 2025-2030 (%)
Data Table on Europe - Year-over-year growth 2025-2030 (%)
Chart on Regional Comparison - Europe
Data Table on Regional Comparison - Europe

13.4.1 Ireland - Market size and forecast 2025-2030

Chart on Ireland - Market size and forecast 2025-2030 ($ million)
Data Table on Ireland - Market size and forecast 2025-2030 ($ million)
Chart on Ireland - Year-over-year growth 2025-2030 (%)
Data Table on Ireland - Year-over-year growth 2025-2030 (%)

13.4.2 Germany - Market size and forecast 2025-2030

Chart on Germany - Market size and forecast 2025-2030 ($ million)
Data Table on Germany - Market size and forecast 2025-2030 ($ million)
Chart on Germany - Year-over-year growth 2025-2030 (%)
Data Table on Germany - Year-over-year growth 2025-2030 (%)

13.4.3 UK - Market size and forecast 2025-2030

Chart on UK - Market size and forecast 2025-2030 ($ million)
Data Table on UK - Market size and forecast 2025-2030 ($ million)
Chart on UK - Year-over-year growth 2025-2030 (%)
Data Table on UK - Year-over-year growth 2025-2030 (%)

13.4.4 France - Market size and forecast 2025-2030

Chart on France - Market size and forecast 2025-2030 ($ million)
Data Table on France - Market size and forecast 2025-2030 ($ million)
Chart on France - Year-over-year growth 2025-2030 (%)
Data Table on France - Year-over-year growth 2025-2030 (%)

13.4.5 The Netherlands - Market size and forecast 2025-2030

Chart on The Netherlands - Market size and forecast 2025-2030 ($ million)
Data Table on The Netherlands - Market size and forecast 2025-2030 ($ million)
Chart on The Netherlands - Year-over-year growth 2025-2030 (%)
Data Table on The Netherlands - Year-over-year growth 2025-2030 (%)

13.4.6 Spain - Market size and forecast 2025-2030

Chart on Spain - Market size and forecast 2025-2030 ($ million)
Data Table on Spain - Market size and forecast 2025-2030 ($ million)
Chart on Spain - Year-over-year growth 2025-2030 (%)
Data Table on Spain - Year-over-year growth 2025-2030 (%)

13.5 North America - Market size and forecast 2025-2030

Chart on North America - Market size and forecast 2025-2030 ($ million)
Data Table on North America - Market size and forecast 2025-2030 ($ million)
Chart on North America - Year-over-year growth 2025-2030 (%)
Data Table on North America - Year-over-year growth 2025-2030 (%)
Chart on Regional Comparison - North America
Data Table on Regional Comparison - North America

13.5.1 US - Market size and forecast 2025-2030

Chart on US - Market size and forecast 2025-2030 ($ million)
Data Table on US - Market size and forecast 2025-2030 ($ million)
Chart on US - Year-over-year growth 2025-2030 (%)
Data Table on US - Year-over-year growth 2025-2030 (%)

13.5.2 Canada - Market size and forecast 2025-2030

Chart on Canada - Market size and forecast 2025-2030 ($ million)
Data Table on Canada - Market size and forecast 2025-2030 ($ million)
Chart on Canada - Year-over-year growth 2025-2030 (%)
Data Table on Canada - Year-over-year growth 2025-2030 (%)

13.5.3 Mexico - Market size and forecast 2025-2030

Chart on Mexico - Market size and forecast 2025-2030 ($ million)
Data Table on Mexico - Market size and forecast 2025-2030 ($ million)
Chart on Mexico - Year-over-year growth 2025-2030 (%)
Data Table on Mexico - Year-over-year growth 2025-2030 (%)

13.6 South America - Market size and forecast 2025-2030

Chart on South America - Market size and forecast 2025-2030 ($ million)
Data Table on South America - Market size and forecast 2025-2030 ($ million)
Chart on South America - Year-over-year growth 2025-2030 (%)
Data Table on South America - Year-over-year growth 2025-2030 (%)
Chart on Regional Comparison - South America
Data Table on Regional Comparison - South America

13.6.1 Brazil - Market size and forecast 2025-2030

Chart on Brazil - Market size and forecast 2025-2030 ($ million)
Data Table on Brazil - Market size and forecast 2025-2030 ($ million)
Chart on Brazil - Year-over-year growth 2025-2030 (%)
Data Table on Brazil - Year-over-year growth 2025-2030 (%)

13.6.2 Argentina - Market size and forecast 2025-2030

Chart on Argentina - Market size and forecast 2025-2030 ($ million)
Data Table on Argentina - Market size and forecast 2025-2030 ($ million)
Chart on Argentina - Year-over-year growth 2025-2030 (%)
Data Table on Argentina - Year-over-year growth 2025-2030 (%)

13.6.3 Chile - Market size and forecast 2025-2030

Chart on Chile - Market size and forecast 2025-2030 ($ million)
Data Table on Chile - Market size and forecast 2025-2030 ($ million)
Chart on Chile - Year-over-year growth 2025-2030 (%)
Data Table on Chile - Year-over-year growth 2025-2030 (%)

13.7 Middle East and Africa - Market size and forecast 2025-2030

Chart on Middle East and Africa - Market size and forecast 2025-2030 ($ million)
Data Table on Middle East and Africa - Market size and forecast 2025-2030 ($ million)
Chart on Middle East and Africa - Year-over-year growth 2025-2030 (%)
Data Table on Middle East and Africa - Year-over-year growth 2025-2030 (%)
Chart on Regional Comparison - Middle East and Africa
Data Table on Regional Comparison - Middle East and Africa

13.7.1 UAE - Market size and forecast 2025-2030

Chart on UAE - Market size and forecast 2025-2030 ($ million)
Data Table on UAE - Market size and forecast 2025-2030 ($ million)
Chart on UAE - Year-over-year growth 2025-2030 (%)
Data Table on UAE - Year-over-year growth 2025-2030 (%)

13.7.2 Saudi Arabia - Market size and forecast 2025-2030

Chart on Saudi Arabia - Market size and forecast 2025-2030 ($ million)
Data Table on Saudi Arabia - Market size and forecast 2025-2030 ($ million)
Chart on Saudi Arabia - Year-over-year growth 2025-2030 (%)
Data Table on Saudi Arabia - Year-over-year growth 2025-2030 (%)

13.7.3 South Africa - Market size and forecast 2025-2030

Chart on South Africa - Market size and forecast 2025-2030 ($ million)
Data Table on South Africa - Market size and forecast 2025-2030 ($ million)
Chart on South Africa - Year-over-year growth 2025-2030 (%)
Data Table on South Africa - Year-over-year growth 2025-2030 (%)

13.7.4 Egypt - Market size and forecast 2025-2030

Chart on Egypt - Market size and forecast 2025-2030 ($ million)
Data Table on Egypt - Market size and forecast 2025-2030 ($ million)
Chart on Egypt - Year-over-year growth 2025-2030 (%)
Data Table on Egypt - Year-over-year growth 2025-2030 (%)

13.7.5 Turkey - Market size and forecast 2025-2030

Chart on Turkey - Market size and forecast 2025-2030 ($ million)
Data Table on Turkey - Market size and forecast 2025-2030 ($ million)
Chart on Turkey - Year-over-year growth 2025-2030 (%)
Data Table on Turkey - Year-over-year growth 2025-2030 (%)

13.8 Market opportunity by geography

Market opportunity by geography ($ million)
Data Tables on Market opportunity by geography ($ million)

14. Drivers, Challenges, and Opportunity

14.1 Market drivers

Growing strategic shift toward widebody leasing for long-haul recovery
Financial liquidity and SLB boom
Accelerated fleet modernization and environmental compliance

14.2 Market challenges

Supply chain dislocation and delivery delays
Macroeconomic volatility and elevated cost of funds
Jurisdictional risk and asset repossession uncertainty

14.3 Impact of drivers and challenges

Impact of drivers and challenges in 2025 and 2030

14.4 Market opportunities

Strategic resurgence of widebody asset acquisition
Institutionalization of sustainability-linked financing
Acceleration of P2F conversions

15. Competitive Landscape

15.1 Overview

15.2

Overview on criticality of inputs and factors of differentiation

15.3 Landscape disruption

Overview on factors of disruption

15.4 Industry risks

Impact of key risks on business

16. Competitive Analysis

16.1 Companies profiled

Companies covered

16.2 Company ranking index

16.3 Market positioning of companies

Matrix on companies position and classification

16.4 AerCap Holdings N.V.

AerCap Holdings N.V. - Overview
AerCap Holdings N.V. - Product / Service
AerCap Holdings N.V. - Key offerings
SWOT

16.5 Air Lease Corp.

Air Lease Corp. - Overview
Air Lease Corp. - Product / Service
Air Lease Corp. - Key offerings
SWOT

16.6 Aircastle Ltd.

Aircastle Ltd. - Overview
Aircastle Ltd. - Product / Service
Aircastle Ltd. - Key offerings
SWOT

16.7 Aviation Capital Group

Aviation Capital Group - Overview
Aviation Capital Group - Product / Service
Aviation Capital Group - Key offerings
SWOT

16.8 Avolon Aerospace Leasing Ltd.

Avolon Aerospace Leasing Ltd. - Overview
Avolon Aerospace Leasing Ltd. - Product / Service
Avolon Aerospace Leasing Ltd. - Key offerings
SWOT

16.9 Azorra Aviation Holdings LLC

Azorra Aviation Holdings LLC - Overview
Azorra Aviation Holdings LLC - Product / Service
Azorra Aviation Holdings LLC - Key offerings
SWOT

16.10 BBAM US LP

BBAM US LP - Overview
BBAM US LP - Product / Service
BBAM US LP - Key offerings
SWOT

16.11 BOC Aviation Ltd.

BOC Aviation Ltd. - Overview
BOC Aviation Ltd. - Product / Service
BOC Aviation Ltd. - Key offerings
SWOT

16.12 CDB Aviation

CDB Aviation - Overview
CDB Aviation - Product / Service
CDB Aviation - Key offerings
SWOT

16.13 Deucalion Aviation Ltd.

Deucalion Aviation Ltd. - Overview
Deucalion Aviation Ltd. - Product / Service
Deucalion Aviation Ltd. - Key offerings
SWOT

16.14 Jackson Square Aviation LLC

Jackson Square Aviation LLC - Overview
Jackson Square Aviation LLC - Product / Service
Jackson Square Aviation LLC - Key offerings
SWOT

16.15 Macquarie Group Ltd.

Macquarie Group Ltd. - Overview
Macquarie Group Ltd. - Business segments
Macquarie Group Ltd. - Key news
Macquarie Group Ltd. - Key offerings
Macquarie Group Ltd. - Segment focus
SWOT

16.16 SMBC Aviation Capital Ltd.

SMBC Aviation Capital Ltd. - Overview
SMBC Aviation Capital Ltd. - Product / Service
SMBC Aviation Capital Ltd. - Key offerings
SWOT

16.17 The Carlyle Group Inc.

The Carlyle Group Inc. - Overview
The Carlyle Group Inc. - Business segments
The Carlyle Group Inc. - Key news
The Carlyle Group Inc. - Key offerings
The Carlyle Group Inc. - Segment focus
SWOT

16.18 TrueNoord

TrueNoord - Overview
TrueNoord - Product / Service
TrueNoord - Key offerings
SWOT

17. Appendix

17.1 Scope of the report

Market definition
Objectives
Notes and caveats

17.2 Inclusions and exclusions checklist

Inclusions checklist
Exclusions checklist

17.3 Currency conversion rates for US$

17.4 Research methodology

17.5 Data procurement

Information sources

17.6 Data validation

17.7 Validation techniques employed for market sizing

17.8 Data synthesis

17.9 360 degree market analysis

17.10 List of abbreviations

Research Methodology

Technavio presents a detailed picture of the market by way of study, synthesis, and summation of data from multiple sources. The analysts have presented the various facets of the market with a particular focus on identifying the key industry influencers. The data thus presented is comprehensive, reliable, and the result of extensive research, both primary and secondary.

INFORMATION SOURCES

Primary sources

  • Manufacturers and suppliers
  • Channel partners
  • Industry experts
  • Strategic decision makers

Secondary sources

  • Industry journals and periodicals
  • Government data
  • Financial reports of key industry players
  • Historical data
  • Press releases

DATA ANALYSIS

Data Synthesis

  • Collation of data
  • Estimation of key figures
  • Analysis of derived insights

Data Validation

  • Triangulation with data models
  • Reference against proprietary databases
  • Corroboration with industry experts

REPORT WRITING

Qualitative

  • Market drivers
  • Market challenges
  • Market trends
  • Five forces analysis

Quantitative

  • Market size and forecast
  • Market segmentation
  • Geographical insights
  • Competitive landscape

Interested in this report?

Get your sample now to see our research methodology and insights!

Download Now

Frequently Asked Questions

Commercial Aircraft Leasing market growth will increase by USD 28381.9 million during 2026-2030.

The Commercial Aircraft Leasing market is expected to grow at a CAGR of 11.3% during 2026-2030.

Commercial Aircraft Leasing market is segmented by Product (Narrow-body aircrafts, Wide-body aircrafts, Regional aircrafts) Type (Wet lease, Dry lease) Application (Passenger, Freight) Usage (Short-term, Long-term)

AerCap Holdings N.V., Air Lease Corp., Aircastle Ltd., Aviation Capital Group, Avolon Aerospace Leasing Ltd., Azorra Aviation Holdings LLC, BBAM US LP, BOC Aviation Ltd., CDB Aviation, DAE Ltd., Deucalion Aviation Ltd., ICBC Financial Leasing Co., Jackson Square Aviation LLC, Macquarie Group Ltd., SMBC Aviation Capital Ltd., Stratos, The Carlyle Group Inc., TrueNoord are a few of the key vendors in the Commercial Aircraft Leasing market.

APAC will register the highest growth rate of 41% among the other regions. Therefore, the Commercial Aircraft Leasing market in APAC is expected to garner significant business opportunities for the vendors during the forecast period.

China, India, Japan, Singapore, Australia, Indonesia, Ireland, Germany, UK, France, The Netherlands, Spain, US, Canada, Mexico, Brazil, Argentina, Chile, UAE, Saudi Arabia, South Africa, Egypt, Turkey

  • Growing strategic shift toward widebody leasing for long-haul recovery is the driving factor this market.

The Commercial Aircraft Leasing market vendors should focus on grabbing business opportunities from the Product segment as it accounted for the largest market share in the base year.
RIA - Research AI Assistant
Ask RIA