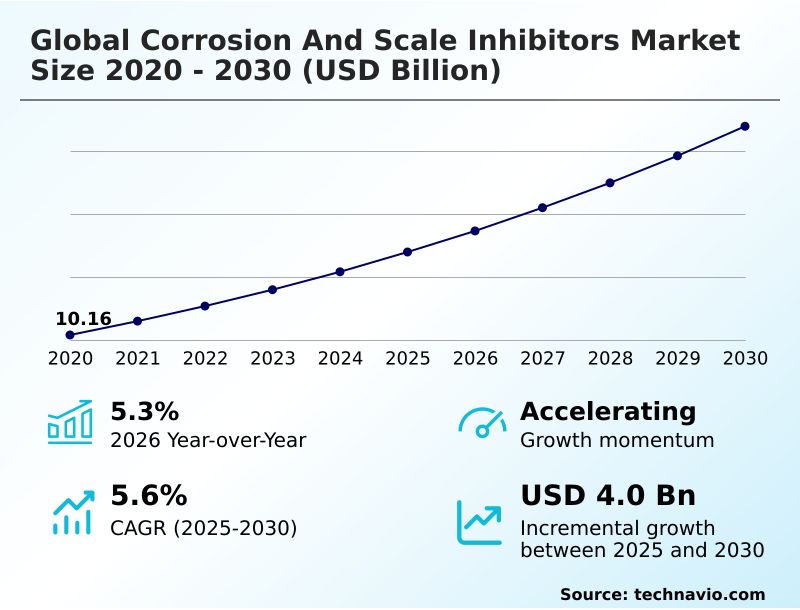
Corrosion And Scale Inhibitors Market Size 2026-2030
The corrosion and scale inhibitors market size is valued to increase by USD 4.00 billion, at a CAGR of 5.6% from 2025 to 2030. Strategic consolidation and technological advancements in oil and gas sector will drive the corrosion and scale inhibitors market.
Major Market Trends & Insights
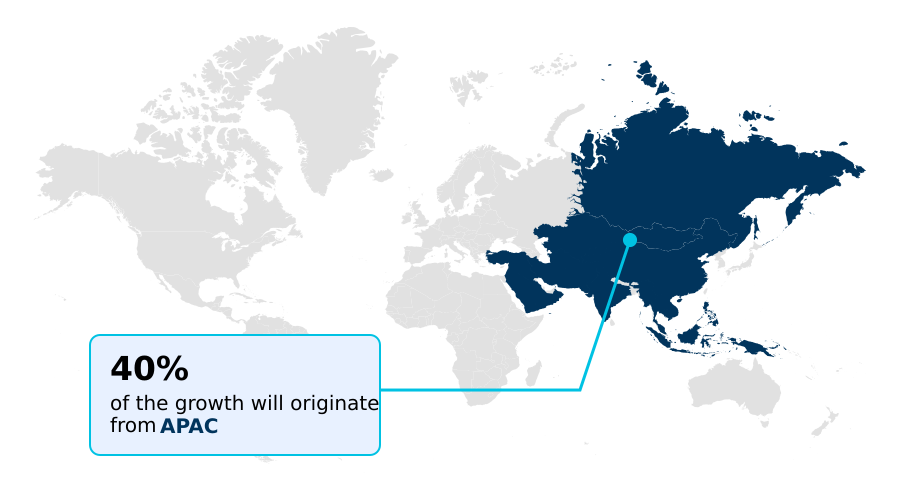
- APAC dominated the market and accounted for a 39.5% growth during the forecast period.
- By Product - Corrosion inhibitors segment was valued at USD 9.42 billion in 2024
- By Type - Organic compound segment accounted for the largest market revenue share in 2024
Market Size & Forecast
- Market Opportunities: USD 6.64 billion
- Market Future Opportunities: USD 4.00 billion
- CAGR from 2025 to 2030 : 5.6%
Market Summary
- The corrosion and scale inhibitors market is fundamentally driven by the industrial imperative to maintain asset integrity and operational efficiency. Across sectors from energy production to manufacturing, the economic impact of unchecked corrosion and scaling is substantial, creating a persistent demand for advanced chemical solutions.
- A key dynamic is the continuous push for formulations that offer superior protection in increasingly harsh environments, such as deep-water oil extraction or high-concentration water recycling systems.
- For instance, a facility implementing a zero liquid discharge (ZLD) strategy to meet environmental mandates must use high-performance scale inhibitors to prevent equipment failure, as mineral concentrations in the recycled water can increase tenfold. This scenario highlights the market's dual role in both enabling industrial output and facilitating compliance with sustainability goals.
- The trend toward greener, low-toxicity inhibitors further reshapes the landscape, challenging manufacturers to innovate with biodegradable materials that do not compromise on performance. Consequently, the market is characterized by a balance between technological advancement, regulatory pressure, and the core need for reliable infrastructure protection.
What will be the Size of the Corrosion And Scale Inhibitors Market during the forecast period?
Get Key Insights on Market Forecast (PDF) Get Free Sample
How is the Corrosion And Scale Inhibitors Market Segmented?
The corrosion and scale inhibitors industry research report provides comprehensive data (region-wise segment analysis), with forecasts and estimates in "USD million" for the period 2026-2030, as well as historical data from 2020-2024 for the following segments.
- Product
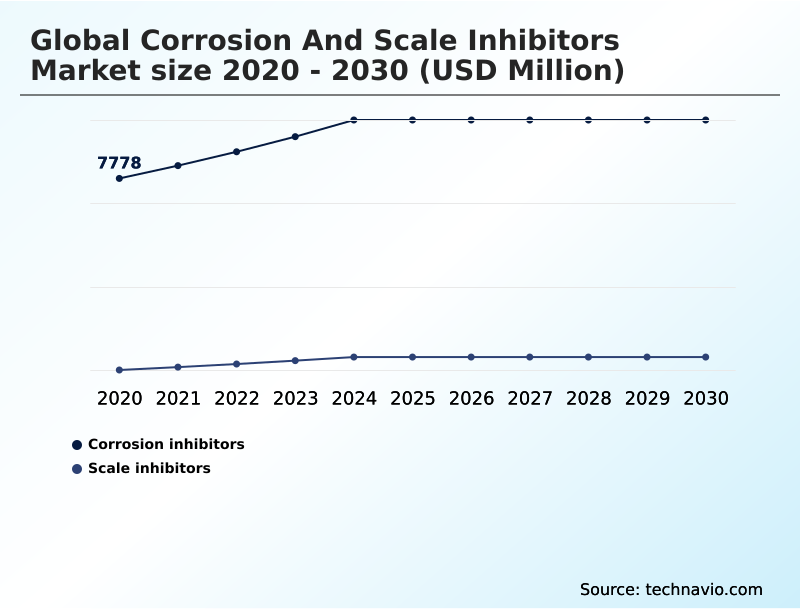
- Corrosion inhibitors
- Scale inhibitors
- Type
- Organic compound
- Inorganic compound
- End-user
- Industrial
- Commercial
- Residential
- Geography
- APAC
- China
- Japan
- India
- North America
- US
- Canada
- Mexico
- Europe
- Germany
- UK
- France
- Middle East and Africa
- Saudi Arabia
- UAE
- South Africa
- South America
- Brazil
- Argentina
- Rest of World (ROW)
- APAC
By Product Insights
The corrosion inhibitors segment is estimated to witness significant growth during the forecast period.
The corrosion inhibitors segment is evolving beyond traditional asset preservation, with a strong emphasis on advanced chemical solutions for complex industrial challenges. Formulations now incorporate synergistic hybrid effects and bio-based polymers to meet stringent environmental standards without compromising performance.
These solutions, including migrating corrosion inhibitors and specialized oil production chemicals, are critical in sectors like downstream refining and heavy industry asset protection.
In applications such as industrial water treatment, the use of advanced filming amine inhibitors and protective coatings is paramount.
The primary goal is extending equipment lifespan, with documented cases showing a reduction in maintenance-related downtime by up to 25% through optimized chemical programs that create a robust passivation layer and prevent sulfidation corrosion.
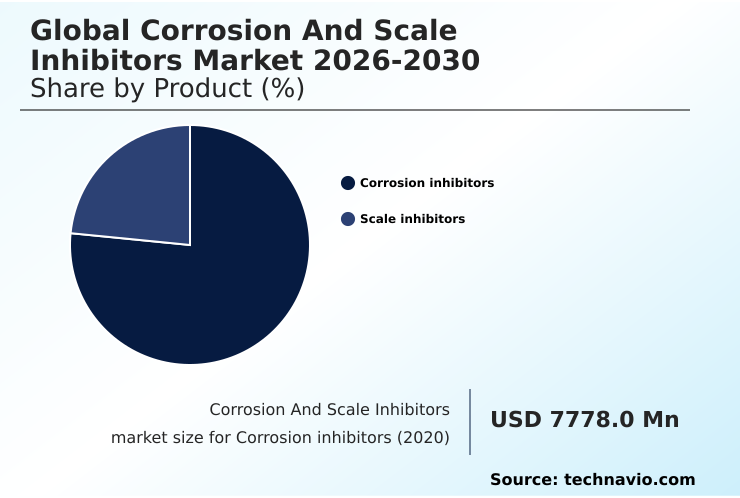
The Corrosion inhibitors segment was valued at USD 9.42 billion in 2024 and showed a gradual increase during the forecast period.
Regional Analysis
APAC is estimated to contribute 39.5% to the growth of the global market during the forecast period.Technavio’s analysts have elaborately explained the regional trends and drivers that shape the market during the forecast period.
See How Corrosion And Scale Inhibitors Market Demand is Rising in APAC Get Free Sample
The geographic landscape of the market is characterized by distinct regional dynamics.
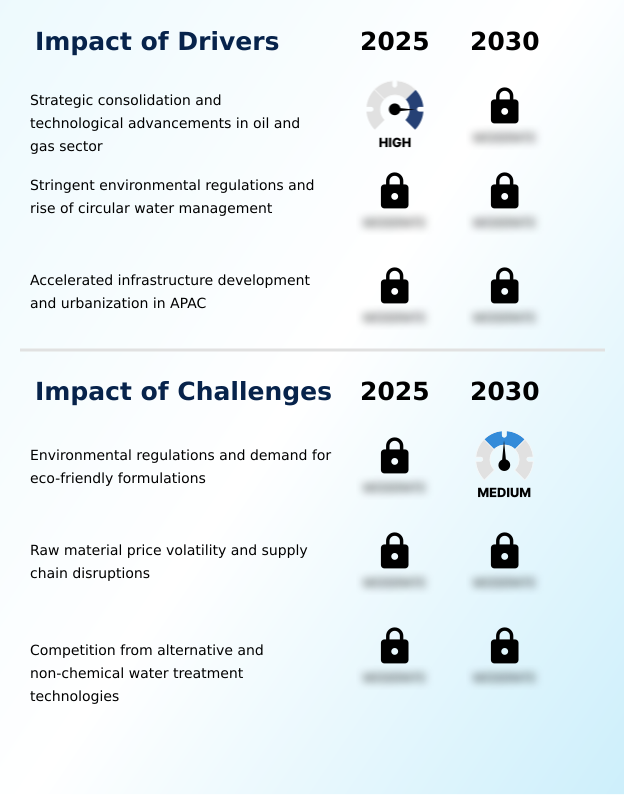
APAC is the primary growth engine, projected to account for nearly 40% of market expansion, driven by rapid industrialization and major infrastructure projects demanding robust solutions for concrete admixture corrosion inhibitor applications and midstream pipeline chemicals.
In contrast, mature markets in North America and Europe prioritize sustainability and regulatory compliance in sectors like municipal water treatment and power generation water chemistry.
Here, the focus is on advanced technologies for water reuse and recycling, where effective boiler water chemical treatment can enable facilities to reduce freshwater intake by over 90%.
This divergence creates a dual-focus market where growth in emerging economies is volume-driven, while innovation in developed regions is centered on high-performance, eco-friendly chemicals for geothermal scale control and hydrometallurgical process inhibitors.
Market Dynamics
Our researchers analyzed the data with 2025 as the base year, along with the key drivers, trends, and challenges. A holistic analysis of drivers will help companies refine their marketing strategies to gain a competitive advantage.
- Selecting the right chemical solution is a complex process tailored to specific operational challenges, extending far beyond a simple choice between organic versus inorganic corrosion inhibitors.
- For instance, managing corrosion inhibitors for high-temperature environments in downstream refining requires specialized formulations to prevent asset failure, while ensuring the efficacy of scale inhibitors for reverse osmosis membranes is critical for water security in arid regions.
- The industry push for sustainability drives demand for eco-friendly corrosion inhibitors for water treatment, yet preventing mineral scale in industrial boilers often relies on proven chemistries like phosphonates. The role of phosphonates in scale inhibition is well-understood, but new challenges arise in specialized applications.
- For example, amine based inhibitors for sour gas are essential for upstream safety, and managing corrosion in CO2 transport pipelines is a growing concern for carbon capture projects. The technical demands of corrosion control in nuclear power plants are exceptionally high, requiring zero-tolerance for error.
- Furthermore, VCI technology for electronics protection addresses a niche but vital need, while inhibitor selection for deepwater oil production must account for extreme pressures in pre-salt oil fields. Even seemingly straightforward issues like the impact of hard water on HVAC systems or preventing lead leaching from plumbing with orthophosphate use in municipal water systems require precise chemical management.
- New frontiers, such as scale management in geothermal energy production and developing chemical treatment for zero liquid discharge, continue to push innovation. The complexities of biocide application in cooling towers and challenges of high-salinity water treatment further highlight the need for tailored, high-performance solutions.
What are the key market drivers leading to the rise in the adoption of Corrosion And Scale Inhibitors Industry?
- Strategic consolidation and technological advancements within the oil and gas sector are key drivers propelling market growth.
- Intensifying industrial activity and the critical need for operational efficiency are major market drivers. The expansion of oil and gas exploration necessitates robust oilfield production chemicals and protective surface coatings to ensure pipeline integrity management in harsh environments.
- Simultaneously, global water scarcity is forcing industries to adopt zero liquid discharge systems. Implementing these systems can increase mineral concentrations by over 300%, creating a direct and urgent need for high-performance scale inhibitors and chemicals for produced water treatment.
- This dynamic is prevalent in sectors from heavy industry asset protection to desalination plant antiscalants, where maintaining heat transfer efficiency and preventing blockages are paramount for economic viability and asset longevity.
What are the market trends shaping the Corrosion And Scale Inhibitors Industry?
- The increasing adoption of environmentally friendly corrosion inhibitors is a significant market trend. This shift is driven by stricter regulations and a growing industry focus on sustainable solutions.
- A primary trend reshaping the market is the accelerated shift toward sustainable solutions. Industries are increasingly adopting low-toxicity formulations and oxygen scavengers to comply with stringent environmental regulations and meet corporate sustainability goals. The development of advanced cementing chemicals and acidizing chemicals that are biodegradable represents a significant area of innovation.
- This transition is not just about compliance but also about performance, as new eco-friendly products for downstream refining chemicals and pyrometallurgical process inhibitors are being engineered to offer superior protection. Formulations incorporating nanotechnology have improved protective film durability by over 50% in lab tests, offering longer-lasting protection for critical assets in upstream production chemicals and other sectors.
What challenges does the Corrosion And Scale Inhibitors Industry face during its growth?
- Stringent environmental regulations and the corresponding demand for eco-friendly formulations present a key challenge to industry growth.
- The market faces significant challenges from raw material price volatility and supply chain disruptions, impacting production costs for key inputs like phosphonates and polymers. This economic pressure is compounded by the high R&D investment required for regulatory compliance, as developing and validating new solutions for slurry transport inhibitors or carbon capture and storage can be resource-intensive.
- For example, creating a single new eco-compliant inhibitor can require an investment 20% higher than traditional formulations. Furthermore, the growing viability of non-chemical water treatment technologies presents a competitive hurdle, pushing chemical manufacturers to demonstrate a clear value proposition for their protective coatings and other treatment solutions.
Exclusive Technavio Analysis on Customer Landscape
The corrosion and scale inhibitors market forecasting report includes the adoption lifecycle of the market, covering from the innovator’s stage to the laggard’s stage. It focuses on adoption rates in different regions based on penetration. Furthermore, the corrosion and scale inhibitors market report also includes key purchase criteria and drivers of price sensitivity to help companies evaluate and develop their market growth analysis strategies.

Customer Landscape of Corrosion And Scale Inhibitors Industry
Competitive Landscape
Companies are implementing various strategies, such as strategic alliances, corrosion and scale inhibitors market forecast, partnerships, mergers and acquisitions, geographical expansion, and product/service launches, to enhance their presence in the industry.
Ashahi Chemical Pvt. Ltd. - Specialized chemical solutions enhance asset integrity and operational efficiency across demanding industrial environments through advanced formulations and targeted applications.
The industry research and growth report includes detailed analyses of the competitive landscape of the market and information about key companies, including:
- Ashahi Chemical Pvt. Ltd.
- BASF SE
- ChampionX Corp.
- Clariant International Ltd.
- Cortec Corp.
- Croda International Plc
- Dai ichi Karkaria Ltd.
- Daubert Chemical Co.
- Dow Chemical Co.
- DuPont de Nemours Inc.
- Ecolab Inc.
- Evonik Industries AG
- Henkel AG and Co. KGaA
- Huntsman International LLC
- Kemira Oyj
- Nouryon Chemicals Holding
- Schlumberger Ltd.
- Solvay SA
- The Lubrizol Corp.
Qualitative and quantitative analysis of companies has been conducted to help clients understand the wider business environment as well as the strengths and weaknesses of key industry players. Data is qualitatively analyzed to categorize companies as pure play, category-focused, industry-focused, and diversified; it is quantitatively analyzed to categorize companies as dominant, leading, strong, tentative, and weak.
Recent Development and News in Corrosion and scale inhibitors market
- In September 2024, Eni and Snam officially launched Phase 1 of the Ravenna CCS project, commencing CO2 injection into a depleted offshore gas reservoir.
- In October 2024, the US Environmental Protection Agency (EPA) finalized the Lead and Copper Rule Improvements (LCRI), mandating stricter action levels and the replacement of lead service lines.
- In November 2024, Ecolab Inc. acquired the paper and water chemicals business of Barclay Water Management Inc., a move aimed at enhancing its water safety and digital monitoring solutions for industrial clients.
- In May 2025, Cortec Corp. introduced EcoSonic VpCI-125 HP, a packaging solution that combines permanent electrostatic discharge protection with vapor phase corrosion inhibitors for sensitive electronics.
Dive into Technavio’s robust research methodology, blending expert interviews, extensive data synthesis, and validated models for unparalleled Corrosion And Scale Inhibitors Market insights. See full methodology.
| Market Scope | |
|---|---|
| Page number | 295 |
| Base year | 2025 |
| Historic period | 2020-2024 |
| Forecast period | 2026-2030 |
| Growth momentum & CAGR | Accelerate at a CAGR of 5.6% |
| Market growth 2026-2030 | USD 4001.6 million |
| Market structure | Fragmented |
| YoY growth 2025-2026(%) | 5.3% |
| Key countries | China, Japan, India, South Korea, Australia, Indonesia, US, Canada, Mexico, Germany, UK, France, Italy, Spain, The Netherlands, Saudi Arabia, UAE, South Africa, Israel, Turkey, Brazil, Argentina and Chile |
| Competitive landscape | Leading Companies, Market Positioning of Companies, Competitive Strategies, and Industry Risks |
Research Analyst Overview
- The corrosion and scale inhibitors market is increasingly defined by the strategic integration of advanced chemistries to manage complex operational risks and optimize capital expenditure. Boardroom decisions now focus on holistic asset integrity programs where biocides and disinfectants, pH adjusters and softeners, and anti-foaming agents are deployed in concert.
- The industry is moving beyond simple chemical supply toward providing solutions that ensure long-term performance, leveraging technologies like vapor phase corrosion inhibitors and filming amine inhibitors. Formulations based on phosphonate antiscalants and orthophosphate inhibitors are fundamental, but innovation in bio-based polymers and low-toxicity formulations is reshaping product portfolios.
- The application of these chemicals in drilling fluids, oil production chemicals, and fracturing chemicals is critical. The strategic application of advanced inhibitors, which create a protective passivation layer and leverage the threshold effect, has been shown to extend asset lifecycles by up to 30% in highly corrosive environments.
- This capability is vital for mitigating risks like sulfidation corrosion, naphthenic acid corrosion, and hydrogen embrittlement. Success depends on mastering both anodic inhibitors and cathodic protection schemes within diverse systems.
What are the Key Data Covered in this Corrosion And Scale Inhibitors Market Research and Growth Report?
-
What is the expected growth of the Corrosion And Scale Inhibitors Market between 2026 and 2030?
-
USD 4.00 billion, at a CAGR of 5.6%
-
-
What segmentation does the market report cover?
-
The report is segmented by Product (Corrosion inhibitors, and Scale inhibitors), Type (Organic compound, and Inorganic compound), End-user (Industrial, Commercial, and Residential) and Geography (APAC, North America, Europe, Middle East and Africa, South America)
-
-
Which regions are analyzed in the report?
-
APAC, North America, Europe, Middle East and Africa and South America
-
-
What are the key growth drivers and market challenges?
-
Strategic consolidation and technological advancements in oil and gas sector, Environmental regulations and demand for eco-friendly formulations
-
-
Who are the major players in the Corrosion And Scale Inhibitors Market?
-
Ashahi Chemical Pvt. Ltd., BASF SE, ChampionX Corp., Clariant International Ltd., Cortec Corp., Croda International Plc, Dai ichi Karkaria Ltd., Daubert Chemical Co., Dow Chemical Co., DuPont de Nemours Inc., Ecolab Inc., Evonik Industries AG, Henkel AG and Co. KGaA, Huntsman International LLC, Kemira Oyj, Nouryon Chemicals Holding, Schlumberger Ltd., Solvay SA and The Lubrizol Corp.
-
Market Research Insights
- Market dynamics are shaped by a focus on measurable outcomes through advanced chemical programs for asset integrity management. The strategic use of specialized chemicals for produced water treatment has been shown to reduce equipment failure rates by up to 40%, directly impacting operational continuity in upstream production.
- Similarly, in cooling tower water treatment, optimized inhibitor formulations can improve heat transfer efficiency by over 15%, lowering energy consumption. Beyond performance, sustainable water management is critical, with modern chemistries enabling facilities to meet stringent discharge regulations with over 95% compliance rates.
- This emphasis on performance-driven solutions for pipeline integrity management, closed-loop cooling systems, and industrial water treatment chemicals underscores the market's value proposition in delivering tangible economic and environmental benefits.
We can help! Our analysts can customize this corrosion and scale inhibitors market research report to meet your requirements.
 RIA -
RIA - 
