
Protective Coatings Market Size 2025-2029
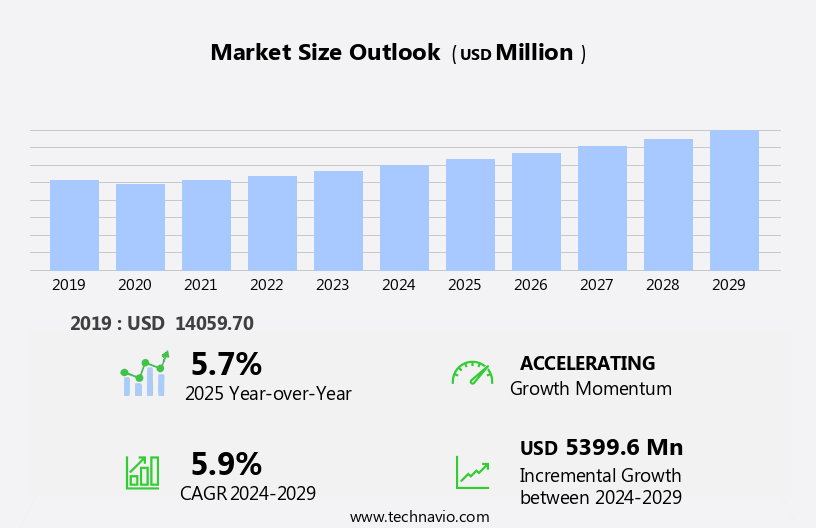
The protective coatings market size is forecast to increase by USD 5.4 billion, at a CAGR of 5.9% between 2024 and 2029.
- The market is experiencing significant growth, driven by the increasing demand for water-borne coatings due to their eco-friendliness and regulatory compliance. This trend is particularly noticeable in industries such as automotive, construction, and consumer goods, where there is a heightened focus on reducing environmental impact. Another key trend is the adoption of UV-curable coatings and nanocoatings, which offer superior performance and durability, making them increasingly popular in various applications. However, the market is not without challenges. Volatile raw material prices pose a significant threat to the profitability of coatings manufacturers, requiring them to carefully manage their supply chains and explore alternative sources.
- To remain competitive, companies must effectively navigate these market dynamics and continually innovate to meet evolving customer demands. Strategic partnerships, research collaborations, and investments in sustainable technologies are essential for long-term success in the market.
What will be the Size of the Protective Coatings Market during the forecast period?
Explore in-depth regional segment analysis with market size data - historical 2019-2023 and forecasts 2025-2029 - in the full report.
Request Free Sample
The market continues to evolve, driven by the diverse needs of various sectors. Coatings play a crucial role in maintaining equipment, infrastructure, and assets by providing protection against wear and tear, corrosion, fire, UV radiation, and biofouling. The market dynamics are shaped by numerous factors, including drying time, film thickness, and surface preparation. Epoxy coatings, known for their abrasion resistance and chemical resistance, are widely used in industrial settings. Intumescent coatings, which provide fire retardancy and fire resistance, are essential in the aerospace industry. Acrylic coatings offer weather resistance and UV resistance, making them popular choices for marine applications.
ISO and ASTM standards ensure quality control and consistency in coatings production and application. High-performance coatings, such as thermal insulation and thermal barrier coatings, offer energy efficiency and cost savings over their life cycle. Coatings also serve specific purposes, such as anti-slip coatings for safety, acoustic insulation for sound absorption, and anti-static coatings for electrical insulation. Coating application methods, including roller application, brush application, and spray application, influence the final product's properties and performance. Polyurethane coatings offer excellent adhesion and durability, making them suitable for asset protection. Powder coatings provide a smooth, uniform finish and are known for their chemical resistance and corrosion control.
The market's continuous dynamism reflects the ongoing unfolding of market activities and evolving patterns. The industry's focus on innovation and sustainability ensures that new coatings solutions continue to emerge, addressing the ever-evolving needs of various sectors.
How is this Protective Coatings Industry segmented?
The protective coatings industry research report provides comprehensive data (region-wise segment analysis), with forecasts and estimates in "USD million" for the period 2025-2029, as well as historical data from 2019-2023 for the following segments.
- Technology
- Solvent-borne
- Waterborne
- Powder coatings
- End-user
- Infrastructure and construction
- Oil and gas
- Automotive
- Aerospace
- Others
- Resin Type
- Epoxy
- Alkyd
- Polyurethane
- Others
- Geography
- North America
- US
- Europe
- France
- Germany
- Italy
- UK
- APAC
- Australia
- China
- India
- Japan
- South Korea
- Rest of World (ROW)
- North America
By Technology Insights
The solvent-borne segment is estimated to witness significant growth during the forecast period.
The market encompasses various product offerings, including those with biofouling prevention, weather resistance, and anti-graffiti properties. ASTM and ISO standards guide the development and application of these coatings. Epoxy coatings, known for their abrasion resistance and equipment protection, continue to be widely used. Intumescent and intumescent fire-resistant coatings provide crucial asset protection and fire retardancy. High-performance coatings, such as acrylic and polyurethane, offer enhanced chemical resistance and thermal insulation. Water-based coatings, including those with low VOC content, are gaining popularity due to their environmental benefits. Powder coatings and spray applications ensure efficient surface coverage and faster drying times. In the aerospace industry, protective coatings provide essential surface protection, including UV resistance and corrosion control.
Ceramic coatings offer reflecting properties, while anti-slip coatings ensure safety in various industries. Thermal barrier coatings and insulating coatings contribute to energy efficiency and temperature regulation. Surface preparation and application methods, such as brush, roller, and spray, impact the overall performance and cost of protective coatings. Coating weight, film thickness, and maintenance intervals are essential factors in the decision-making process for businesses. Market trends include the development of high-performance, UV-curable, and solvent-free coatings. The demand for anti-corrosion and fire-resistant coatings continues to grow in infrastructure protection. The market is expected to expand significantly due to its diverse applications and evolving technology.
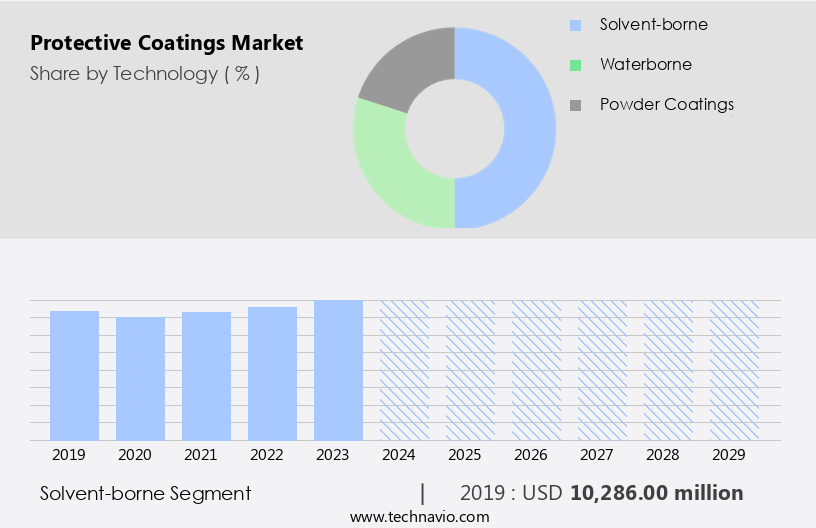
The Solvent-borne segment was valued at USD 10.29 billion in 2019 and showed a gradual increase during the forecast period.
Regional Analysis
APAC is estimated to contribute 45% to the growth of the global market during the forecast period. Technavio's analysts have elaborately explained the regional trends and drivers that shape the market during the forecast period.
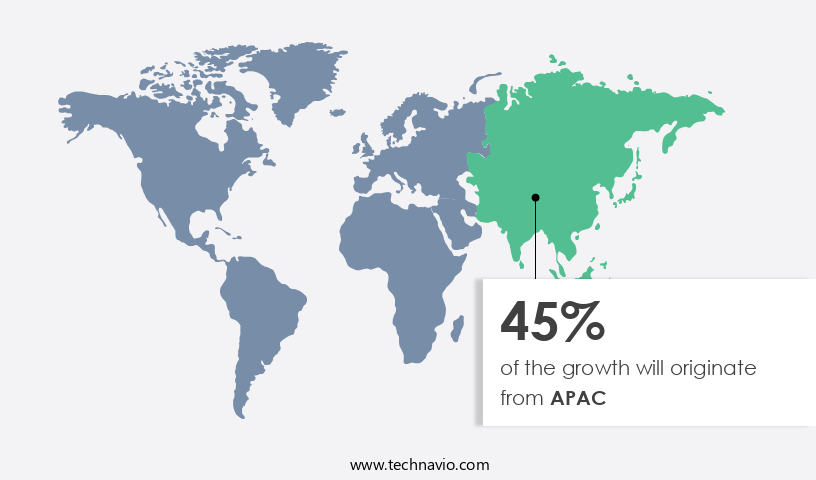
The market in the Asia Pacific region is experiencing significant growth, driven by the high demand in industries such as automotive, construction, and oil and gas. China, India, Japan, and South Korea are the leading countries contributing to this growth due to their rapid industrialization and expanding business sectors. The market is diverse, with numerous regional and local companies like AkzoNobel and PPG, producing a range of protective coatings. Epoxy, intumescent, acrylic, and polyurethane coatings are popular choices due to their properties such as abrasion resistance, weather resistance, and chemical resistance. ASTM and ISO standards ensure consistent quality, while ASTM standards specifically address biofouling prevention and ASTM D1654 for film thickness measurement.
In the automotive sector, anti-corrosion and anti-fouling coatings are essential for asset protection, while anti-graffiti coatings and moisture barriers are used for surface protection. High-performance coatings with UV resistance, thermal insulation, and acoustic insulation are gaining popularity in infrastructure protection. The market trends include the use of water-based and solvent-based coatings, powder coatings, and UV-curable coatings for their various advantages, such as low VOC content, faster drying times, and improved surface preparation. Coatings with fire retardancy and thermal barrier properties are increasingly being used for safety and energy efficiency purposes. Quality control measures, such as surface preparation and corrosion control, are crucial for the effective application and longevity of protective coatings.
Spray and brush applications are common methods for application, with maintenance intervals varying depending on the specific coating and application. In summary, the market in the Asia Pacific region is growing due to the high demand in various industries and the presence of numerous local and regional players. The market offers a wide range of coatings with various properties to meet diverse application needs.
Market Dynamics
Our researchers analyzed the data with 2024 as the base year, along with the key drivers, trends, and challenges. A holistic analysis of drivers will help companies refine their marketing strategies to gain a competitive advantage.
What are the key market drivers leading to the rise in the adoption of Protective Coatings Industry?
- The primary factor fueling market growth is the heightened demand for water-borne coatings due to their numerous advantages, such as reduced volatile organic compound emissions and easier application compared to traditional solvent-based coatings.
- Water-borne protective coatings, utilizing water as the primary solvent, have gained significant traction in various industries, including aerospace, oil and gas, marine, power generation, mining, and automotive, due to their superior properties. These coatings provide excellent resistance to heat and abrasion, superior adhesion, and lower toxicity and flammability compared to solvent-borne coatings. The environmental impact of water-borne coatings is less severe due to their reduced Volatile Organic Compounds (VOC) and Hazardous Air Pollutants (HAP) emissions. Water-borne coatings are cost-effective as they do not necessitate additives, thinners, or hardeners. Furthermore, the amount of water-borne coatings required to cover a substrate's surface area is relatively smaller than other coatings.
- High-performance coatings, such as fire retardancy, thermal insulation, anti-slip, ceramic, reflecting, and anti-fouling, are available in water-borne formulations. Quality control is essential in the application and manufacturing processes to ensure the coatings meet industry standards. Recent research indicates a growing preference for water-borne coatings due to their environmental advantages and performance capabilities.
What are the market trends shaping the Protective Coatings Industry?
- The focus on UV-curable coatings and nanocoatings is gaining significant attention in the market. These advanced coating technologies are expected to shape industry trends in the near future.
- The market encompasses a range of products, including powder coatings, insulating coatings, and marine coatings, among others. Market participants are investing significantly in research and development to introduce advanced protective coating technologies, such as nanocoatings and UV-curable coatings, to enhance their product offerings. Nanocoatings, in particular, have gained traction due to their cost-effectiveness and superior durability. For instance, Halo Nano Matrix is an example of a nano-protective coating. These coatings are widely utilized in the transport, industrial machinery, marine, and architectural sectors. Nanocoatings offer solutions for long-lasting shine and are easy and quick to apply. They effectively repel rain, dirt, and other environmental contaminants.
- With their excellent chemical resistance and corrosion resistance properties, these coatings play a crucial role in asset protection and infrastructure preservation. Additionally, thermal barrier coatings are gaining popularity for their insulating properties, which help reduce energy consumption in various industries. Protective coatings are applied using various methods, including brush application and spray application, to cater to diverse customer needs.
What challenges does the Protective Coatings Industry face during its growth?
- The volatile nature of raw material prices poses a significant challenge to the industry's growth trajectory.
- Protective coatings are essential for surface protection in various industries, including construction, automotive, and manufacturing. The market for protective coatings encompasses a range of products, including fire-resistant, anti-corrosion, UV-curable, solvent-based, and polyurethane coatings. These coatings serve diverse functions, such as providing acoustic insulation, enhancing gloss level, and offering anti-static properties. The production of protective coatings relies on petrochemical feedstocks, primarily consisting of binders and solvents derived from polyesters, alcohols, and epoxy resins. Crude oil and natural gas serve as the fundamental raw materials for producing these binders. The cost of feedstock is significantly influenced by factors such as the demand and supply of feedstock, manufacturing processes, and production regions.
- Volatility in crude oil prices, in turn, impacts the cost of feedstock and contributes to the variability in resin prices. The global crude oil industry experiences a persistent demand-supply imbalance, leading to considerable fluctuations in crude oil prices. These price fluctuations have a direct impact on the pricing of petrochemical feedstocks and, subsequently, on the cost of protective coatings. As a result, market dynamics in the protective coatings industry are influenced by the volatility in crude oil prices.
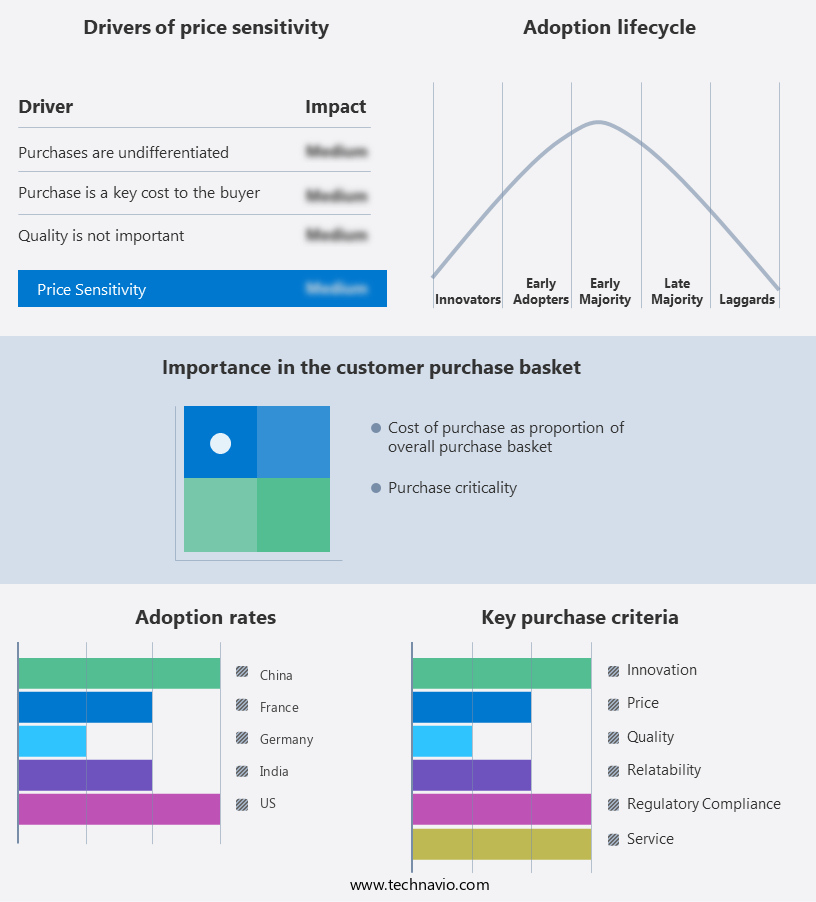
Exclusive Customer Landscape
The protective coatings market forecasting report includes the adoption lifecycle of the market, covering from the innovator's stage to the laggard's stage. It focuses on adoption rates in different regions based on penetration. Furthermore, the protective coatings market report also includes key purchase criteria and drivers of price sensitivity to help companies evaluate and develop their market growth analysis strategies.
Customer Landscape
Key Companies & Market Insights
Companies are implementing various strategies, such as strategic alliances, protective coatings market forecast, partnerships, mergers and acquisitions, geographical expansion, and product/service launches, to enhance their presence in the industry.
Akzo Nobel NV - This company specializes in the production of advanced protective coatings, including Marine, Automotive, and Specialty varieties, as well as Powder coating solutions.
The industry research and growth report includes detailed analyses of the competitive landscape of the market and information about key companies, including:
- Akzo Nobel NV
- Al Gurg Paints LLC
- Asian Paints Ltd.
- Axalta Coating Systems Ltd.
- Berger Paints India Ltd.
- Chitra Insultec Pvt. Ltd.
- Hempel AS
- Henkel AG and Co. KGaA
- Jotun AS
- Kansai Paint Co. Ltd.
- Nippon Paint Holdings Co. Ltd.
- NIPSEA Group
- Plasma paints
- PPG Industries Inc.
- RPM International Inc.
- Sika AG
- The Chemours Co.
- The Dow Chemical Co.
- The Sherwin Williams Co.
- Wacker Chemie AG
Qualitative and quantitative analysis of companies has been conducted to help clients understand the wider business environment as well as the strengths and weaknesses of key industry players. Data is qualitatively analyzed to categorize companies as pure play, category-focused, industry-focused, and diversified; it is quantitatively analyzed to categorize companies as dominant, leading, strong, tentative, and weak.
Recent Development and News in Protective Coatings Market
- In January 2024, PPG Industries, a leading coatings manufacturer, announced the launch of its new line of high-performance protective coatings, "PPG TESLINX," designed for the renewable energy sector. These coatings offer enhanced durability and resistance to extreme weather conditions, boosting the efficiency and longevity of solar panels and wind turbines (Source: PPG Industries Press Release).
- In March 2024, BASF and 3M, two major players in the protective coatings industry, entered into a strategic partnership to develop and commercialize advanced ceramic coatings for the automotive industry. This collaboration aims to reduce vehicle weight and improve fuel efficiency, making cars more eco-friendly and cost-effective (Source: BASF Press Release).
- In May 2024, Axalta Coating Systems, a global leader in liquid and powder coatings, completed the acquisition of the industrial coatings business of Sikkens, a Dutch paint company. This acquisition significantly expanded Axalta's presence in Europe and strengthened its position in the industrial coatings market (Source: Axalta Coating Systems Press Release).
- In February 2025, the European Union (EU) approved the use of AkzoNobel's new powder coating, "Interpon D2000," which contains up to 50% recycled content. This approval marks a significant step forward in the circular economy and the protective coatings industry's efforts to reduce waste and carbon emissions (Source: AkzoNobel Press Release).
Research Analyst Overview
- The market encompasses various technologies, including hydrophobic coatings, electrochemical coatings, plasma coatings, and self-healing coatings, among others. Sputtering deposition and airless spraying are popular application methods. Inspection services play a crucial role in ensuring the effectiveness of these coatings, utilizing non-destructive testing and remote sensing. Environmental compliance is a significant market driver, with a focus on green coatings and solvent recovery. Corrosion engineering and maintenance management are key areas of surface engineering, while industrial automation and coatings technology advancements propel the market.
- Surface science and materials science underpin coatings chemistry innovations, such as bio-based coatings and powder coating. Lifecycle analysis and coating application techniques, including HVLP spraying and electrostatic spraying, are essential for optimizing performance and reducing costs.
Dive into Technavio's robust research methodology, blending expert interviews, extensive data synthesis, and validated models for unparalleled Protective Coatings Market insights. See full methodology.
|
Market Scope |
|
|
Report Coverage |
Details |
|
Page number |
239 |
|
Base year |
2024 |
|
Historic period |
2019-2023 |
|
Forecast period |
2025-2029 |
|
Growth momentum & CAGR |
Accelerate at a CAGR of 5.9% |
|
Market growth 2025-2029 |
USD 5399.6 million |
|
Market structure |
Fragmented |
|
YoY growth 2024-2025(%) |
5.7 |
|
Key countries |
China, US, Japan, India, Germany, UK, South Korea, France, Australia, and Italy |
|
Competitive landscape |
Leading Companies, Market Positioning of Companies, Competitive Strategies, and Industry Risks |
What are the Key Data Covered in this Protective Coatings Market Research and Growth Report?
- CAGR of the Protective Coatings industry during the forecast period
- Detailed information on factors that will drive the growth and forecasting between 2025 and 2029
- Precise estimation of the size of the market and its contribution of the industry in focus to the parent market
- Accurate predictions about upcoming growth and trends and changes in consumer behaviour
- Growth of the market across APAC, Europe, North America, Middle East and Africa, and South America
- Thorough analysis of the market's competitive landscape and detailed information about companies
- Comprehensive analysis of factors that will challenge the protective coatings market growth of industry companies
We can help! Our analysts can customize this protective coatings market research report to meet your requirements.
 RIA -
RIA - 
