Gas Station Equipment Market Analysis Europe, APAC, North America, Middle East and Africa, South America - US, China, Germany, Japan, UK - Size and Forecast 2024-2028

Gas Station Equipment Market Analysis Europe, APAC, North America, Middle East and Africa, South America - US, China, Germany, Japan, UK - Size and Forecast 2024-2028

Published: Aug 2024 151 Pages SKU: IRTNTR45579

Market Overview at a Glance

$30.8 B
Market Opportunity
4.51%
CAGR
4.25
YoY growth 2023-2024(%)

Gas Station Equipment Market Size 2024-2028 

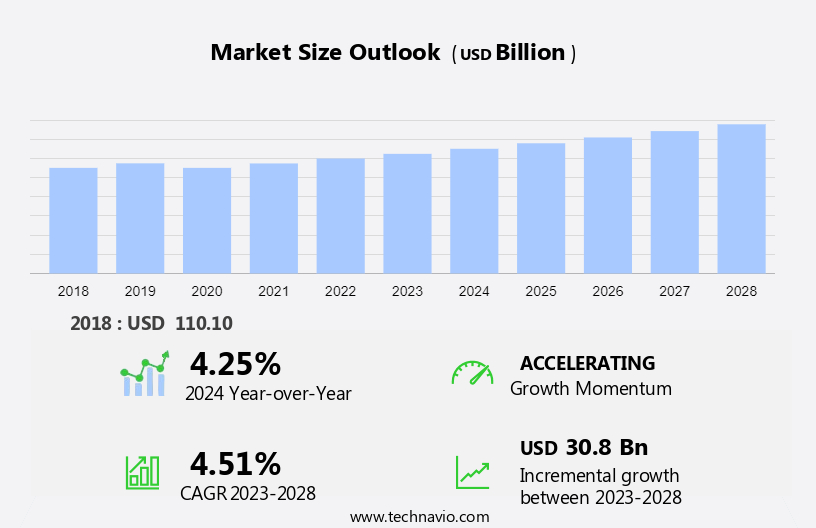
The gas station equipment market size is estimated to grow/ by USD 30.8 billion at a CAGR of 4.51% between 2023 and 2028. The market is experiencing significant growth, driven by the increasing number of gas stations globally and the adoption of technologically advanced fuel dispensers. These advanced dispensers offer features such as contactless payments, real-time monitoring, and remote diagnostics, enhancing the customer experience and improving operational efficiency. Additionally, the rising costs of raw materials for gas station equipment, including steel, plastic, and electronics, are fueling market growth. Despite these growth factors, challenges persist, including regulatory compliance, cybersecurity concerns, and the need for continuous innovation to meet evolving consumer demands. Overall, the market is poised for continued expansion, driven by the convergence of technology and energy demand.

What will be the Size of the Market During the Forecast Period?

Gas Station Equipment Market Size

For More Highlights About this Report, Request Free Sample

Market Dynamic and Customer Landscape

The market encompasses a wide range of tools and materials essential for operating a functional gas station. Key components include Fuel Storage Tanks, Fuel Dispensers, Pump, Hoses, Nozzles, and various Parts. Gas station owners invest in Gasoline, Diesel, and Biofuel tanks to cater to diverse customer needs. Pumps and dispensers are crucial for fuel dispensing, while cash registers and cleaning supplies manage transactions and station upkeep. Energy-efficient pumps and compressors ensure cost savings and eco-friendliness. Cash flow is a significant concern for service station owners, leading them to explore leasing and financing options from Banks. Our researchers analyzed the data with 2023 as the base year, along with the key drivers, trends, and challenges. A holistic analysis of drivers will help companies refine their marketing strategies to gain a competitive advantage. 

Key Market Driver

Increasing number of gas stations is notably driving market growth. The market is witnessing significant growth due to the increasing number of vehicles and the demand for alternate fuels. With rising disposable income in various regions, the production of cars, trucks, and other vehicles is on the rise, leading to an increase in the number of gas stations. Moreover, governments are promoting the use of alternate fuels like CNG, hydrogen, and others to reduce pollution. For instance, India's Petroleum and Natural Gas and Steel Ministry aims to open 1000 liquid natural gas stations by 2023.

Furthermore, in the US, the number of retail convenience stores, which account for nearly 80% of fuel sales, is increasing rapidly. Gas station equipment includes meters, gasoline dispensers, magnetic card readers, and interactive TV screens, among other technologies. These advanced technologies offer contactless payment options and enhanced customer experience. The market is expected to grow steadily due to the increasing demand for fuel and the adoption of advanced technologies in the sector. Thus, such factors are driving the growth of the market during the forecast period.

Significant Market Trends

Growth of technologically advanced fuel dispensers is the key trend in the market. Advanced gas station equipment, including fuel dispensers, are being introduced in the market with innovative features to enhance the customer experience. These new fuel dispensers come equipped with interactive TV screens, scanners, customer identification keypads, barcoding systems, and magnetic card terminals. Magnetic card terminals enable gas station staff to process credit and debit card transactions directly at the fuel dispenser, eliminating the need for separate machines.

Additionally, some fuel dispensers have the capability to identify and record customer details using unique identification numbers (UINs), allowing for easy tracking of transactions. Interactive video screens on fuel dispensers offer entertainment options for customers, adding to the overall convenience and appeal of modern gas station equipment. Manufacturers are also customizing fuel dispensers to cater to the specific needs of retailers. Thus, such trends will shape the growth of the market during the forecast period.

Major Market Challenge

Rising costs of raw materials of gas station equipment is the major challenge that affects the growth of the market. The market is characterized by a high level of competition among various players. Key challenges for manufacturers include penetrating emerging markets for gas detection equipment and contending with low-cost offerings from small and regional vendors. These competitors, while having limited product portfolios, pose significant competition in the market. The price pressure in the market is increasing, potentially impacting profitability for businesses.

Additionally, the proliferation of counterfeit products is a significant concern for both manufacturers and end-users. Despite these challenges, advancements in technology continue to shape the market, with innovations such as gasoline dispensers, interactive TV screens, and magnetic card readers enhancing the customer experience at gas stations. Hence, the above factors will impede the growth of the market during the forecast period

Key Market Customer Landscape

The market forecasting report includes the adoption lifecycle of the market, covering from the innovator’s stage to the laggard’s stage. It focuses on adoption rates in different regions based on penetration. Furthermore, the report also includes key purchase criteria and drivers of price sensitivity to help companies evaluate and develop their market growth analysis strategies.
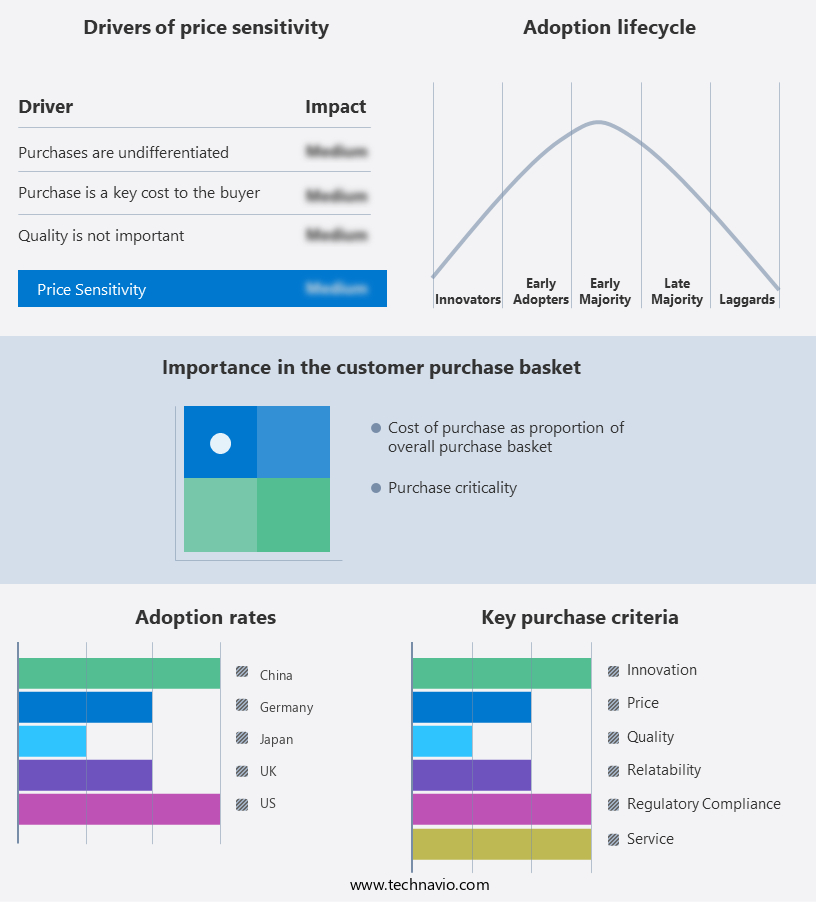
Gas Station Equipment Market Share by Geography

 Customer Landscape

Key Companies & Market Insights

Companies are implementing various strategies, such as strategic alliances, partnerships, mergers and acquisitions, geographical expansion, and product/service launches, to enhance their presence in the market.

Beijing Sanki Petroleum Technology Co. Ltd. - The company offers gas station equipment namely SK CNG Dispenser. 

The market research and growth report also includes detailed analyses of the competitive landscape of the market and information about key companies, including:

  • Beijing Sanki Petroleum Technology Co. Ltd.
  • Censtar Science and Technology Corp. Ltd.
  • Dover Corp.
  • Eaton Sales and Service LLC
  • Green Petrol Station Equipment Industries
  • Hines Corp.
  • HongYang Group Co. Ltd.
  • Houpu Clean Energy Co.
  • Jiangsu Furen Group
  • Korea EnE Co. Ltd.
  • Lumen Instruments
  • Mepsan
  • Peltek India
  • Piusi Spa
  • Scheidt and Bachmann GmbH
  • SPYRIDIS GROUP
  • Tatsuno Corp.
  • TOMINAGA Co. Ltd.
  • Vontier Corp.
  • Zhejiang Datian machine Co. Ltd.

Qualitative and quantitative analysis of companies has been conducted to help clients understand the wider business environment as well as the strengths and weaknesses of key market players. Data is qualitatively analyzed to categorize companies as pure play, category-focused, industry-focused, and diversified; it is quantitatively analyzed to categorize companies as dominant, leading, strong, tentative, and weak.

Market Segmentation

By Product 

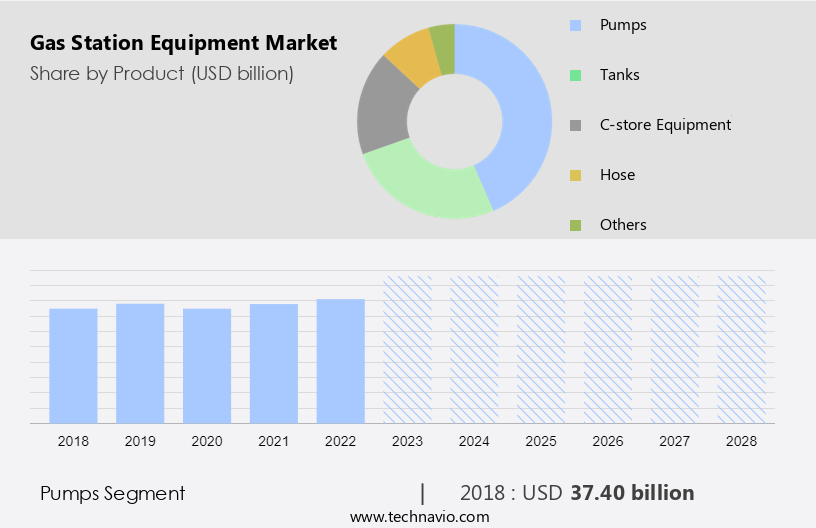
The Pumps segment is estimated to witness significant growth during the forecast period. The market comprises a range of essential tools and materials for the successful operation of service stations. A significant segment of this market is dedicated to fuel dispensing equipment, including tanks, pumps, fuel dispensers, nozzles, hoses, and related parts. Fuel storage tanks come in various sizes and materials, accommodating gasoline, diesel, biofuel, and alternative fuels. 

Gas Station Equipment Market Size

Get a glance at the market share of various regions Download the PDF Sample


The Pumps segment was the largest segment and was valued at USD 37.40 billion in 2018. Fuel dispensers are available in single or multi-product configurations, enabling the dispensing of multiple fuel types. Submersible pumps are installed in underground tanks, facilitating the transfer of fuel to dispensers. Positive displacement pumps ensure high-volume fuel transfer with their efficiency and durability. Fuel transfer pumps are utilized for moving fuel between tanks and dispensing units. In the modern era, smart pumps have emerged, integrating payment systems and real-time monitoring capabilities. Gas station owners invest in various additional equipment, such as cash registers, cleaning supplies, coolers, compressors, EMV upgrades, digital price signs, LED lighting, POS systems, convenience store equipment, carwashes, and underground storage tanks. Alternative fuel dispensers and gas island canopies cater to the growing demand for eco-friendly fuel options. Service station owners rely on banks, leasing, and business loans to finance their equipment purchases. Accounting executives and national chains play a crucial role in managing cash flow and ensuring the efficient operation of gas stations. The market continues to evolve, with advancements in technology leading to energy-efficient pumps, digital signage, and advanced payment systems.

By Region

Gas Station Equipment Market Share by Geography

For more insights on the market share of various regions Download PDF Sample now!

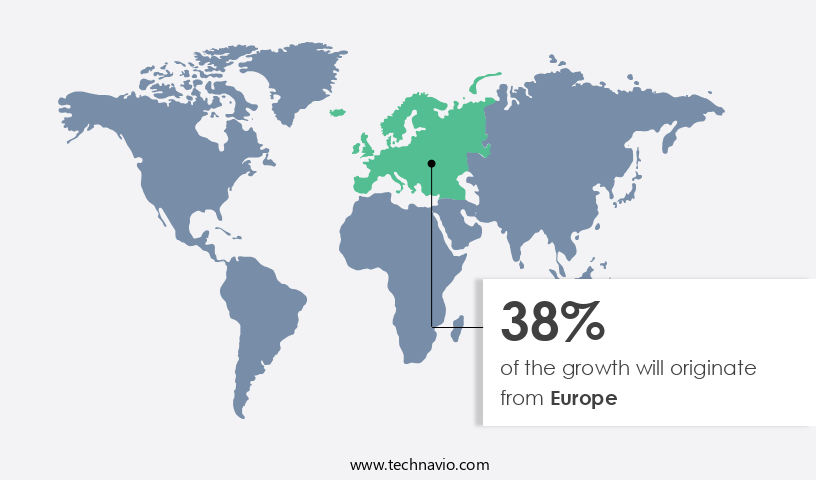
Europe is estimated to contribute 38% to the growth of the global market during the forecast period. Technavio’s analysts have elaborately explained the regional trends and drivers that shape the market during the forecast period.

The market encompasses a range of essential tools and materials for the efficient operation of gas stations. Key components include fuel storage tanks, fuel dispensing equipment such as pumps, dispensers, nozzles, and hoses, as well as parts for maintenance and repair. Gas station owners invest in various types of tanks for storing gasoline, diesel, and biofuel. Pumps and dispensers are crucial for fuel delivery to customers, while cash registers, cleaning supplies, and cooling systems cater to additional needs. Modern gas stations incorporate energy-efficient pumps, compressors, and digital price signs to enhance customer experience and boost cash flow. EMV upgrades ensure secure payment processing. Convenience stores offer additional revenue streams with equipment like POS systems, beer caves, and carwashes. Underground storage tanks and alternative fuel dispensers expand the fuel options for service stations. Business loans and accounting executives facilitate financial management for national chain owners. Tools and materials, including hoses, pumps, and nozzles, ensure optimal performance and safety.

Segment Overview

The market research report provides comprehensive data (region-wise segment analysis), with forecasts and estimates in "USD billion " for the period 2024-2028, as well as historical data from 2018-2022 for the following segments.

  • Product Outlook
    • Pumps
    • Tanks
    • C-store equipment
    • Hose
    • Others
  • Region Outlook 
    • APAC
      • China
      • India
    • North America
      • The U.S.
      • Canada
    • Europe
      • The U.K.
      • Germany
      • France
      • Rest of Europe
    • South America
      • Brazil
      • Argentina
      • Chile
    • Middle East & Africa
      • Saudi Arabia
      • South Africa
      • Rest of the Middle East & Africa

You may also interested in the below market reports

Market Analyst Overview

EMV upgrades and Digital price signs are modern technologies enhancing customer experience and convenience. Coolers provide refreshing beverages, while tools and materials ensure timely maintenance and repairs. A service station owner can enhance operations by upgrading gas pumps and integrating a modern POS system while managing above ground fuel tanks and considering a business loan for further investments. Overall, the market is a dynamic and competitive landscape catering to the diverse needs of gas station owners and their customers.

Market Scope

Report Coverage

Details

Page number

151

Base year

2023

Historic period

2018-2022

Forecast period

2024-2028

Growth momentum & CAGR

Accelerate at a CAGR of 4.51%

Market growth 2024-2028

USD 30.8 billion

Market structure

Fragmented

YoY growth 2023-2024(%)

4.25

Regional analysis

Europe, APAC, North America, Middle East and Africa, and South America

Performing market contribution

Europe at 38%

Key countries

US, China, Germany, Japan, and UK

Competitive landscape

Leading Companies, Market Positioning of Companies, Competitive Strategies, and Industry Risks

Key companies profiled

Beijing Sanki Petroleum Technology Co. Ltd., Censtar Science and Technology Corp. Ltd., Dover Corp., Eaton Sales and Service LLC, Green Petrol Station Equipment Industries, Hines Corp., HongYang Group Co. Ltd., Houpu Clean Energy Co., Jiangsu Furen Group, Korea EnE Co. Ltd., Lumen Instruments, Mepsan, Peltek India, Piusi Spa, Scheidt and Bachmann GmbH, SPYRIDIS GROUP, Tatsuno Corp., TOMINAGA Co. Ltd., Vontier Corp., and Zhejiang Datian machine Co. Ltd.

Market dynamics

Parent market analysis, Market Forecasting, Market growth inducers and obstacles, Fast-growing and slow-growing segment analysis, COVID-19 impact and recovery analysis and future consumer dynamics, Market condition analysis for market forecast period

Customization purview

If our report has not included the data that you are looking for, you can reach out to our analysts and get segments customized.

Download PDF Sample

What are the Key Data Covered in this Market Report?

  • CAGR of the market during the forecast period
  • Detailed information on factors that will drive the market growth and forecasting of the market between 2024 and 2028
  • Precise estimation of the size of the market size and its contribution to the parent market
  • Accurate predictions about upcoming market trends and analysis and changes in consumer behavior
  • Growth of the market industry across Europe, North America, APAC, South America, and Middle East and Africa
  • Thorough market growth analysis of the market’s competitive landscape and detailed information about companies
  • Comprehensive market analysis and report on the factors that will challenge the market research and growth of market companies

1 Executive Summary

  • 1.1 Market overview
    • Executive Summary - Chart on Market Overview
    • Executive Summary - Data Table on Market Overview
    • Executive Summary - Chart on Global Market Characteristics
    • Executive Summary - Chart on Market by Geography
    • Executive Summary - Chart on Market Segmentation by Product
    • Executive Summary - Chart on Incremental Growth
    • Executive Summary - Data Table on Incremental Growth
    • Executive Summary - Chart on Company Market Positioning

2 Market Landscape

  • 2.1 Market ecosystem
    • Parent Market
    • Data Table on - Parent Market
  • 2.2 Market characteristics
    • Market characteristics analysis
  • 2.3 Value chain analysis
    • Value Chain Analysis

3 Market Sizing

  • 3.1 Market definition
    • Offerings of companies included in the market definition
  • 3.2 Market segment analysis
    • Market segments
  • 3.3 Market size 2023
    • 3.4 Market outlook: Forecast for 2023-2028
      • Chart on Global - Market size and forecast 2023-2028 ($ billion)
      • Data Table on Global - Market size and forecast 2023-2028 ($ billion)
      • Chart on Global Market: Year-over-year growth 2023-2028 (%)
      • Data Table on Global Market: Year-over-year growth 2023-2028 (%)

    4 Historic Market Size

    • 4.1 Global Gas Station Equipment Market 2018 - 2022
      • Historic Market Size - Data Table on Global Gas Station Equipment Market 2018 - 2022 ($ billion)
    • 4.2 Product segment analysis 2018 - 2022
      • Historic Market Size - Product Segment 2018 - 2022 ($ billion)
    • 4.3 Geography segment analysis 2018 - 2022
      • Historic Market Size - Geography Segment 2018 - 2022 ($ billion)
    • 4.4 Country segment analysis 2018 - 2022
      • Historic Market Size - Country Segment 2018 - 2022 ($ billion)

    5 Five Forces Analysis

    • 5.1 Five forces summary
      • Five forces analysis - Comparison between 2023 and 2028
    • 5.2 Bargaining power of buyers
      • Bargaining power of buyers - Impact of key factors 2023 and 2028
    • 5.3 Bargaining power of suppliers
      • Bargaining power of suppliers - Impact of key factors in 2023 and 2028
    • 5.4 Threat of new entrants
      • Threat of new entrants - Impact of key factors in 2023 and 2028
    • 5.5 Threat of substitutes
      • Threat of substitutes - Impact of key factors in 2023 and 2028
    • 5.6 Threat of rivalry
      • Threat of rivalry - Impact of key factors in 2023 and 2028
    • 5.7 Market condition
      • Chart on Market condition - Five forces 2023 and 2028

    6 Market Segmentation by Product

    • 6.1 Market segments
      • Chart on Product - Market share 2023-2028 (%)
      • Data Table on Product - Market share 2023-2028 (%)
    • 6.2 Comparison by Product
      • Chart on Comparison by Product
      • Data Table on Comparison by Product
    • 6.3 Pumps - Market size and forecast 2023-2028
      • Chart on Pumps - Market size and forecast 2023-2028 ($ billion)
      • Data Table on Pumps - Market size and forecast 2023-2028 ($ billion)
      • Chart on Pumps - Year-over-year growth 2023-2028 (%)
      • Data Table on Pumps - Year-over-year growth 2023-2028 (%)
    • 6.4 Tanks - Market size and forecast 2023-2028
      • Chart on Tanks - Market size and forecast 2023-2028 ($ billion)
      • Data Table on Tanks - Market size and forecast 2023-2028 ($ billion)
      • Chart on Tanks - Year-over-year growth 2023-2028 (%)
      • Data Table on Tanks - Year-over-year growth 2023-2028 (%)
    • 6.5 C-store equipment - Market size and forecast 2023-2028
      • Chart on C-store equipment - Market size and forecast 2023-2028 ($ billion)
      • Data Table on C-store equipment - Market size and forecast 2023-2028 ($ billion)
      • Chart on C-store equipment - Year-over-year growth 2023-2028 (%)
      • Data Table on C-store equipment - Year-over-year growth 2023-2028 (%)
    • 6.6 Hose - Market size and forecast 2023-2028
      • Chart on Hose - Market size and forecast 2023-2028 ($ billion)
      • Data Table on Hose - Market size and forecast 2023-2028 ($ billion)
      • Chart on Hose - Year-over-year growth 2023-2028 (%)
      • Data Table on Hose - Year-over-year growth 2023-2028 (%)
    • 6.7 Others - Market size and forecast 2023-2028
      • Chart on Others - Market size and forecast 2023-2028 ($ billion)
      • Data Table on Others - Market size and forecast 2023-2028 ($ billion)
      • Chart on Others - Year-over-year growth 2023-2028 (%)
      • Data Table on Others - Year-over-year growth 2023-2028 (%)
    • 6.8 Market opportunity by Product
      • Market opportunity by Product ($ billion)
      • Data Table on Market opportunity by Product ($ billion)

    7 Customer Landscape

    • 7.1 Customer landscape overview
      • Analysis of price sensitivity, lifecycle, customer purchase basket, adoption rates, and purchase criteria

    8 Geographic Landscape

    • 8.1 Geographic segmentation
      • Chart on Market share by geography 2023-2028 (%)
      • Data Table on Market share by geography 2023-2028 (%)
    • 8.2 Geographic comparison
      • Chart on Geographic comparison
      • Data Table on Geographic comparison
    • 8.3 Europe - Market size and forecast 2023-2028
      • Chart on Europe - Market size and forecast 2023-2028 ($ billion)
      • Data Table on Europe - Market size and forecast 2023-2028 ($ billion)
      • Chart on Europe - Year-over-year growth 2023-2028 (%)
      • Data Table on Europe - Year-over-year growth 2023-2028 (%)
    • 8.4 APAC - Market size and forecast 2023-2028
      • Chart on APAC - Market size and forecast 2023-2028 ($ billion)
      • Data Table on APAC - Market size and forecast 2023-2028 ($ billion)
      • Chart on APAC - Year-over-year growth 2023-2028 (%)
      • Data Table on APAC - Year-over-year growth 2023-2028 (%)
    • 8.5 North America - Market size and forecast 2023-2028
      • Chart on North America - Market size and forecast 2023-2028 ($ billion)
      • Data Table on North America - Market size and forecast 2023-2028 ($ billion)
      • Chart on North America - Year-over-year growth 2023-2028 (%)
      • Data Table on North America - Year-over-year growth 2023-2028 (%)
    • 8.6 Middle East and Africa - Market size and forecast 2023-2028
      • Chart on Middle East and Africa - Market size and forecast 2023-2028 ($ billion)
      • Data Table on Middle East and Africa - Market size and forecast 2023-2028 ($ billion)
      • Chart on Middle East and Africa - Year-over-year growth 2023-2028 (%)
      • Data Table on Middle East and Africa - Year-over-year growth 2023-2028 (%)
    • 8.7 South America - Market size and forecast 2023-2028
      • Chart on South America - Market size and forecast 2023-2028 ($ billion)
      • Data Table on South America - Market size and forecast 2023-2028 ($ billion)
      • Chart on South America - Year-over-year growth 2023-2028 (%)
      • Data Table on South America - Year-over-year growth 2023-2028 (%)
    • 8.8 US - Market size and forecast 2023-2028
      • Chart on US - Market size and forecast 2023-2028 ($ billion)
      • Data Table on US - Market size and forecast 2023-2028 ($ billion)
      • Chart on US - Year-over-year growth 2023-2028 (%)
      • Data Table on US - Year-over-year growth 2023-2028 (%)
    • 8.9 China - Market size and forecast 2023-2028
      • Chart on China - Market size and forecast 2023-2028 ($ billion)
      • Data Table on China - Market size and forecast 2023-2028 ($ billion)
      • Chart on China - Year-over-year growth 2023-2028 (%)
      • Data Table on China - Year-over-year growth 2023-2028 (%)
    • 8.10 Germany - Market size and forecast 2023-2028
      • Chart on Germany - Market size and forecast 2023-2028 ($ billion)
      • Data Table on Germany - Market size and forecast 2023-2028 ($ billion)
      • Chart on Germany - Year-over-year growth 2023-2028 (%)
      • Data Table on Germany - Year-over-year growth 2023-2028 (%)
    • 8.11 Japan - Market size and forecast 2023-2028
      • Chart on Japan - Market size and forecast 2023-2028 ($ billion)
      • Data Table on Japan - Market size and forecast 2023-2028 ($ billion)
      • Chart on Japan - Year-over-year growth 2023-2028 (%)
      • Data Table on Japan - Year-over-year growth 2023-2028 (%)
    • 8.12 UK - Market size and forecast 2023-2028
      • Chart on UK - Market size and forecast 2023-2028 ($ billion)
      • Data Table on UK - Market size and forecast 2023-2028 ($ billion)
      • Chart on UK - Year-over-year growth 2023-2028 (%)
      • Data Table on UK - Year-over-year growth 2023-2028 (%)
    • 8.13 Market opportunity by geography
      • Market opportunity by geography ($ billion)
      • Data Tables on Market opportunity by geography ($ billion)

    9 Drivers, Challenges, and Opportunity/Restraints

    • 9.1 Market drivers
      • 9.2 Market challenges
        • 9.3 Impact of drivers and challenges
          • Impact of drivers and challenges in 2023 and 2028
        • 9.4 Market opportunities/restraints

          10 Competitive Landscape

          • 10.1 Overview
            • 10.2 Competitive Landscape
              • Overview on criticality of inputs and factors of differentiation
            • 10.3 Landscape disruption
              • Overview on factors of disruption
            • 10.4 Industry risks
              • Impact of key risks on business

            11 Competitive Analysis

            • 11.1 Companies profiled
              • Companies covered
            • 11.2 Market positioning of companies
              • Matrix on companies position and classification
            • 11.3 Beijing Sanki Petroleum Technology Co. Ltd.
              • Beijing Sanki Petroleum Technology Co. Ltd. - Overview
              • Beijing Sanki Petroleum Technology Co. Ltd. - Product / Service
              • Beijing Sanki Petroleum Technology Co. Ltd. - Key offerings
            • 11.4 Censtar Science and Technology Corp. Ltd.
              • Censtar Science and Technology Corp. Ltd. - Overview
              • Censtar Science and Technology Corp. Ltd. - Product / Service
              • Censtar Science and Technology Corp. Ltd. - Key offerings
            • 11.5 Dover Corp.
              • Dover Corp. - Overview
              • Dover Corp. - Business segments
              • Dover Corp. - Key news
              • Dover Corp. - Key offerings
              • Dover Corp. - Segment focus
            • 11.6 Hines Corp.
              • Hines Corp. - Overview
              • Hines Corp. - Product / Service
              • Hines Corp. - Key offerings
            • 11.7 Houpu Clean Energy Co.
              • Houpu Clean Energy Co. - Overview
              • Houpu Clean Energy Co. - Product / Service
              • Houpu Clean Energy Co. - Key offerings
            • 11.8 Scheidt and Bachmann GmbH
              • Scheidt and Bachmann GmbH - Overview
              • Scheidt and Bachmann GmbH - Product / Service
              • Scheidt and Bachmann GmbH - Key offerings
            • 11.9 SPYRIDIS GROUP
              • SPYRIDIS GROUP - Overview
              • SPYRIDIS GROUP - Product / Service
              • SPYRIDIS GROUP - Key offerings
            • 11.10 Tatsuno Corp.
              • Tatsuno Corp. - Overview
              • Tatsuno Corp. - Product / Service
              • Tatsuno Corp. - Key offerings
            • 11.11 Vontier Corp.
              • Vontier Corp. - Overview
              • Vontier Corp. - Product / Service
              • Vontier Corp. - Key news
              • Vontier Corp. - Key offerings
            • 11.12 Zhejiang Datian machine Co. Ltd.
              • Zhejiang Datian machine Co. Ltd. - Overview
              • Zhejiang Datian machine Co. Ltd. - Product / Service
              • Zhejiang Datian machine Co. Ltd. - Key offerings

            12 Appendix

            • 12.1 Scope of the report
              • 12.2 Inclusions and exclusions checklist
                • Inclusions checklist
                • Exclusions checklist
              • 12.3 Currency conversion rates for US$
                • Currency conversion rates for US$
              • 12.4 Research methodology
                • Research methodology
              • 12.5 Data procurement
                • Information sources
              • 12.6 Data validation
                • Data validation
              • 12.7 Validation techniques employed for market sizing
                • Validation techniques employed for market sizing
              • 12.8 Data synthesis
                • Data synthesis
              • 12.9 360 degree market analysis
                • 360 degree market analysis
              • 12.10 List of abbreviations
                • List of abbreviations

              Research Methodology

              Technavio presents a detailed picture of the market by way of study, synthesis, and summation of data from multiple sources. The analysts have presented the various facets of the market with a particular focus on identifying the key industry influencers. The data thus presented is comprehensive, reliable, and the result of extensive research, both primary and secondary.

              INFORMATION SOURCES

              Primary sources

              • Manufacturers and suppliers
              • Channel partners
              • Industry experts
              • Strategic decision makers

              Secondary sources

              • Industry journals and periodicals
              • Government data
              • Financial reports of key industry players
              • Historical data
              • Press releases

              DATA ANALYSIS

              Data Synthesis

              • Collation of data
              • Estimation of key figures
              • Analysis of derived insights

              Data Validation

              • Triangulation with data models
              • Reference against proprietary databases
              • Corroboration with industry experts

              REPORT WRITING

              Qualitative

              • Market drivers
              • Market challenges
              • Market trends
              • Five forces analysis

              Quantitative

              • Market size and forecast
              • Market segmentation
              • Geographical insights
              • Competitive landscape

              Interested in this report?

              Get your sample now to see our research methodology and insights!

              Download Now

              Frequently Asked Questions

              Gas Station Equipment market growth will increase by $ 30.8 bn during 2024-2028.

              The Gas Station Equipment market is expected to grow at a CAGR of 4.51% during 2024-2028.

              Gas Station Equipment market is segmented by Product( Pumps, Tanks, C-store equipment, Hose, Others)

              Beijing Sanki Petroleum Technology Co. Ltd., Censtar Science and Technology Corp. Ltd., Dover Corp., Eaton Sales and Service LLC, Green Petrol Station Equipment Industries, Hines Corp., HongYang Group Co. Ltd., Houpu Clean Energy Co., Jiangsu Furen Group, Korea EnE Co. Ltd., Lumen Instruments, Mepsan, Peltek India, Piusi Spa, Scheidt and Bachmann GmbH, SPYRIDIS GROUP, Tatsuno Corp., TOMINAGA Co. Ltd., Vontier Corp., Zhejiang Datian machine Co. Ltd. are a few of the key vendors in the Gas Station Equipment market.

              Europe will register the highest growth rate of 38% among the other regions. Therefore, the Gas Station Equipment market in Europe is expected to garner significant business opportunities for the vendors during the forecast period.

              US, China, Germany, Japan, UK

              • Increasing number of gas stationsIncreasing disposable income in various regions is encouraging the manufacturing of cars is the driving factor this market.
              • trucks is the driving factor this market.
              • and other vehicles globally. Additionally is the driving factor this market.
              • the demand for alternate fuels like CNG is the driving factor this market.
              • hydrogen is the driving factor this market.
              • and others has also increased. Hence is the driving factor this market.
              • the number of gas stations with alternate fuel dispensing machines is increasing globally. Governments also promote the use of alternate fuels to control pollution. For instance is the driving factor this market.
              • in 2020 is the driving factor this market.
              • India's Petroleum and Natural Gas and Steel Ministry announced a plan to open 1000 liquid natural gas stations across the country by 2023. In addition is the driving factor this market.
              • in the US is the driving factor this market.
              • the number of retail convenience stores is also increasing rapidly. Nearly 80% of these stores sell fuel. Thus is the driving factor this market.
              • the increasing number of convenience stores has positively impacted the sales of fuel dispensers. is the driving factor this market.

              The Gas Station Equipment market vendors should focus on grabbing business opportunities from the Pumps segment as it accounted for the largest market share in the base year.