
Fuel Cards Market Size 2024-2028
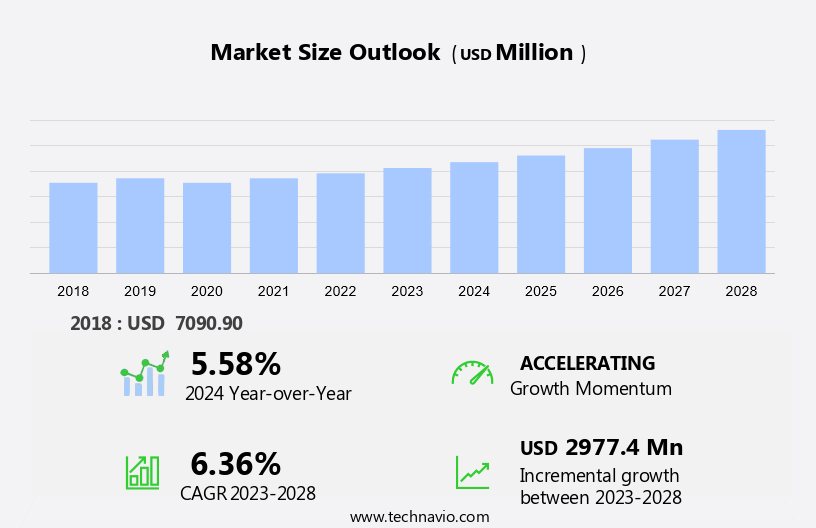
The fuel cards market size is forecast to increase by USD 2.98 billion at a CAGR of 6.36% between 2023 and 2028.
- The market is experiencing significant growth, driven by the rising penetration of digitalization in various sectors. This trend is transforming the way businesses manage their fuel expenses, offering real-time transaction monitoring, automated reporting, and improved fleet management. Strategic alliances and acquisitions are also shaping the market, with key players seeking to expand their reach and offer comprehensive solutions. However, challenges persist, including the lack of awareness and infrastructure in certain regions, which hampers market penetration. Despite these hurdles, the market is poised for continued expansion, fueled by technological advancements and the increasing demand for efficient fuel management solutions.
What will the size of the market be during the forecast period?
- The market is a significant segment in the transportation industry, enabling efficient fuel payments and expense management for both commercial fleets and individuals. Fuel cards facilitate digital transactions at certified gas stations, providing a mobile, frictionless experience for cardholders. Advanced payment methods like smart cards and standard cards offer added security features and streamlined vehicle service, parking, toll charge, and fuel rewards. Fuel retailers benefit from fuel card partnerships, expanding their customer base and enhancing the shopping experience through Platinum Status programs and Fuel Rewards. Card issuers leverage data capture and telematics integration to optimize fleet management and expense management.
- Environmental initiatives are also gaining importance, with many fuel card providers promoting eco-friendly practices and incentives for the use of alternative fuels. Fuel cards cater to various sectors, including commercial fleets and individuals, helping manage fuel-related expenses and additional expenses. Shell Oil Products and other major players in the oil industry issue fuel cards, offering financial services tailored to their customers' needs. The future of the market lies in continued innovation, focusing on advanced payment methods, data security, and environmental sustainability.
How is this market segmented and which is the largest segment?
The market research report provides comprehensive data (region-wise segment analysis), with forecasts and estimates in "USD million" for the period 2024-2028, as well as historical data from 2018-2022 for the following segments.
- Type
- Branded
- Universal
- Merchant
- Geography
- Europe
- Germany
- UK
- North America
- US
- APAC
- China
- India
- Middle East and Africa
- South America
- Europe
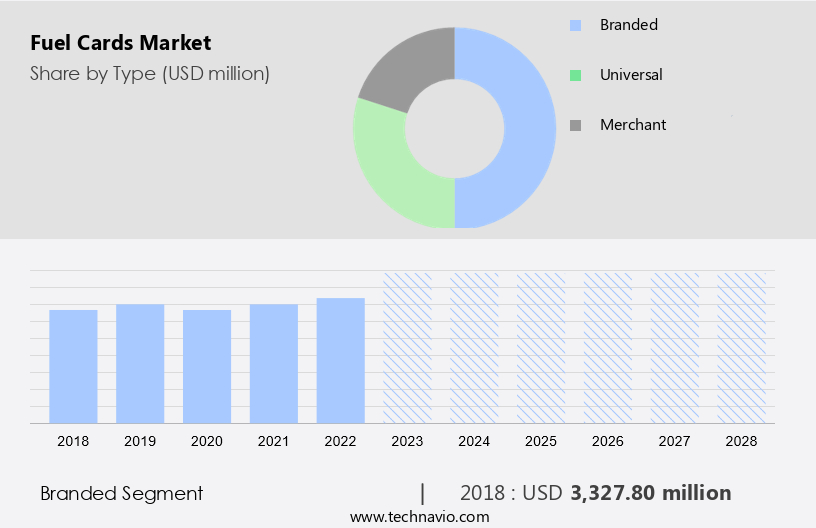
By Type Insights
- The branded segment is estimated to witness significant growth during the forecast period.
Branded fuel cards, issued by fuel station brands such as Exxon Mobil Corporation, BP plc, and Sunoco LP, are increasingly preferred by small businesses with brand loyalty or a strong presence in specific regions. These cards offer several benefits, including purchase bonuses, online access to reporting and transaction controls, and introductory annual percentage rates (APR) or low fees. These advantages contribute to the growth of the branded fuel cards segment. Digital transaction solutions have revolutionized fuel consumption management, enabling real-time car mileage tracking, route efficiency, and breakdown prevention for fleet operators and trucking companies. E-commerce activities, delivery services, and logistics have further fueled the demand for digital fuel cards.
Additionally, digital transformation in the fuel card market has led to the adoption of security measures, data analytics, and reporting to mitigate fraud and misuse. Eco-friendly initiatives, such as fuel incentives, fuel tax, and fuel subsidies, are also driving the market's growth. Digital fuel cards can be integrated with infotainment systems, enabling seamless transactions and vehicle location tracking. Prepaid cards offer cost savings and control over fuel consumption. Amazon, Mastercard, ToneTag, Fastag, and other digital payment providers are entering the fuel card market, offering advanced features like contactless payments, mobile wallet integration, and real-time transaction processing. Fleet drivers and truck maintenance and repair services can benefit from these offerings, as they can easily manage fuel expenses, vehicle parts, and tax information.
Get a glance at the market report of share of various segments Request Free Sample
The branded segment was valued at USD 3.33 billion in 2018 and showed a gradual increase during the forecast period.
Regional Analysis
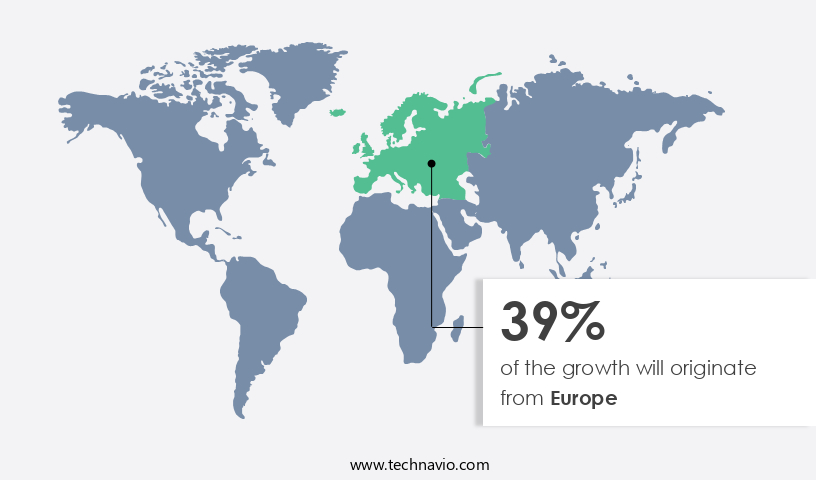
- Europe is estimated to contribute 39% to the growth of the global market during the forecast period.
Technavio's analysts have elaborately explained the regional trends and drivers that shape the market during the forecast period.
For more insights on the market share of various regions Request Free Sample
Fuel cards serve as an essential tool for businesses and individuals managing transportation expenses, particularly those related to fuel purchases for commercial fleets. These cards enable digital transactions at certified gas stations, providing a mobile, frictionless payment solution for fleet managers. Advanced payment features include smart cards and standard cards, which offer additional benefits such as vehicle service, parking, toll charges, fuel rewards, and platinum status. Shell Oil Products and other fuel retailers accept these cards, allowing cardholders to earn in-store rewards and financial services. Branded fuel cards offer specific advantages, while universal fuel cards provide more flexibility with a wider network of merchant acceptance.
Market Dynamics
Our researchers analyzed the data with 2023 as the base year, along with the key drivers, trends, and challenges. A holistic analysis of drivers will help companies refine their marketing strategies to gain a competitive advantage.
What are the key market drivers leading to the rise in adoption of Fuel Cards Market?
Rising penetration of digitalization in every sector is the key driver of the market.
- The market is experiencing significant growth due to the increasing preference for digital transaction solutions among multinational companies and large business organizations. Prepaid cards, mobile wallets, and contactless payments are gaining popularity, leading to increased demand for fuel cards. Additionally, the acceptance of virtual currency and government initiatives to promote a cashless society are driving market expansion. The proliferation of smartphone applications for digital transactions and the rise of contactless and automated payment methods, particularly in response to the ongoing pandemic, are further fueling market growth. Fuel cards offer cost savings through real-time car mileage tracking, fuel consumption monitoring, and fleet management.
- Eco-friendly initiatives, such as fuel incentives, fuel tax, and fuel subsidies, are also encouraging the adoption of fuel cards. Digital transformation in logistics, delivery services, and e-commerce activities is further boosting the market. Fuel cards offer advanced features, including data analytics for reporting, telematics for vehicle location and route efficiency, and breakdown prevention. They can be integrated with infotainment systems, allowing for seamless fuel transactions and vehicle maintenance management. Digital fuel cards also offer security measures, such as odometer readings and tax information, ensuring accurate and transparent transactions.
What are the market trends shaping the Fuel Cards Market?
Strategic alliance and acquisition is the upcoming trend in the market.
- Fuel cards have become increasingly popular digital transaction solutions for managing fuel consumption and associated expenses for fleet operators and vehicle owners. These cards offer cost savings, real-time car mileage tracking, and fraud prevention measures, making them a trusted choice for businesses with large fleets and high fuel usage. In the digital transformation era, fuel card providers are collaborating with technology companies and financial institutions to strengthen their offerings.
- Collaborations bring advanced technology, strong business infrastructure, and skilled talent to the fuel card market, enabling providers to offer more value-added services like data analytics, reporting, eco-friendly initiatives, and digital operations. Furthermore, fuel cards facilitate fuel incentives, tax information, security measures, and logistics optimization for fleet drivers, truck repairs, and maintenance, vehicle parts, fuel grades, and odometer readings. In the context of e-commerce activities, delivery services, and Amazon's growing influence, fuel cards play a crucial role in fuel tax and subsidies management, telematics, vehicle location, route efficiency, and breakdown prevention.
What challenges does Fuel Cards Market face during the growth?
Lack of awareness and infrastructure is a key challenge affecting the market growth.
- Fuel cards offer digital transaction solutions for managing fuel consumption and associated expenses for fleet drivers and vehicle owners. These cards provide cost savings through fuel incentives, tax information, and real-time car mileage reporting. However, challenges such as fraud and misuse can arise without proper security measures. Developing countries like India, Brazil, Chile, and South Africa have a low adoption rate of fuel cards due to a lack of awareness and established infrastructure. This situation negatively impacts market growth. In India, for example, electronic fuel cards are still in their infancy. Oil marketing companies must invest in awareness programs and technology to provide reliable customer service.
- Digital transformation in the logistics and delivery services sectors, driven by e-commerce activities, is increasing the demand for fuel cards. Digital operations, including telematics and vehicle location tracking, improve route efficiency and breakdown prevention. Prepaid cards offer cost savings and control for fleet operators and truck maintenance providers. Eco-friendly initiatives, such as fuel tax and subsidies, incentivize the use of fuel cards. Mastercard, Amazon, ToneTag, and Fastag are leading players in this market. Key features include fuel grades, odometer readings, and vehicle parts purchasing. Security measures, such as biometric authentication and real-time alerts, ensure trust and bargaining power for cardholders.
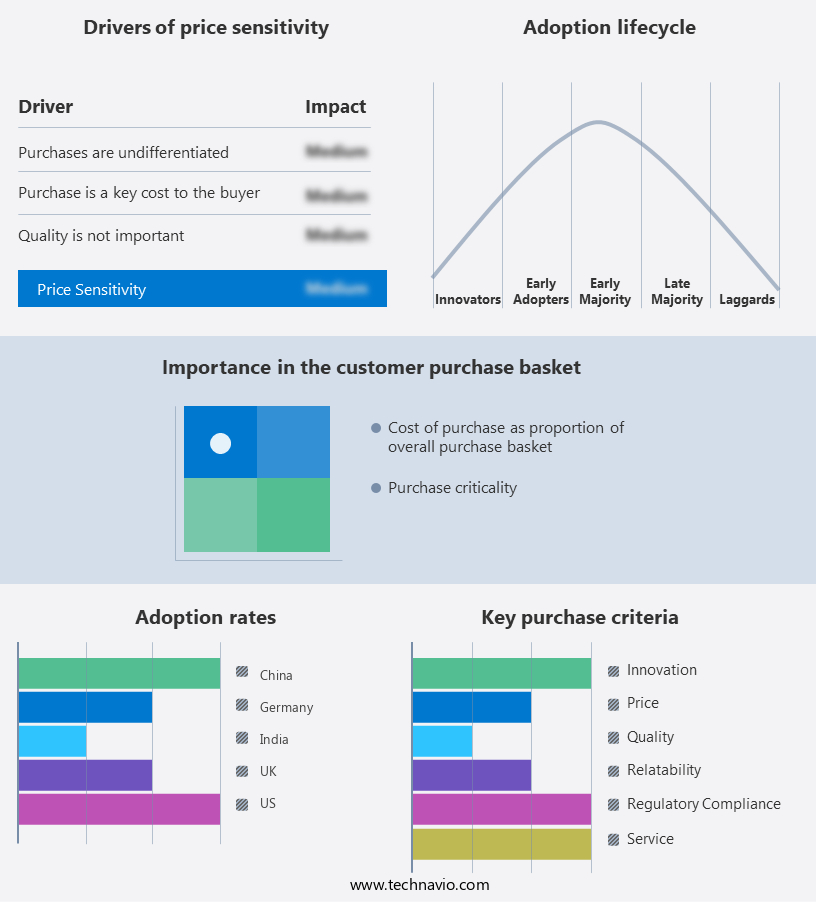
Exclusive Customer Landscape
The market forecasting report includes the adoption lifecycle of the market, covering from the innovator's stage to the laggard's stage. It focuses on adoption rates in different regions based on penetration. Furthermore, the market report also includes key purchase criteria and drivers of price sensitivity to help companies evaluate and develop their market growth analysis strategies.
Customer Landscape
Key Companies & Market Insights
Companies are implementing various strategies, such as strategic alliances, market forecast, partnerships, mergers and acquisitions, geographical expansion, and product/service launches, to enhance their presence in the market.
The market research and growth report includes detailed analyses of the competitive landscape of the market and information about key companies, including:
- Bharat Petroleum Corp. Ltd.
- BP Plc
- China National Petroleum Corp.
- DKV EURO SERVICE GmbH and Co. KG
- Edenred SE
- Exxon Mobil Corp.
- FirstRand Ltd.
- FleetCor Technologies Inc.
- Hindustan Petroleum Corp. Ltd.
- Indian Oil Corp. Ltd.
- OLA Energy Holdings Ltd.
- PETRONAS Chemicals Group Berhad
- Shell plc
- TotalEnergies SE
- Trafigura Group Pte. Ltd.
- U.S. Bancorp
- WEX Inc.
- Worldline SA
Qualitative and quantitative analysis of companies has been conducted to help clients understand the wider business environment as well as the strengths and weaknesses of key market players. Data is qualitatively analyzed to categorize companies as pure play, category-focused, industry-focused, and diversified; it is quantitatively analyzed to categorize companies as dominant, leading, strong, tentative, and weak.
Research Analyst Overview
Fuel cards have revolutionized the way businesses, commercial fleets, and individuals manage fuel payments and related expenses. These payment solutions enable digital transactions at certified gas stations, offering a mobile, frictionless experience. Advanced payment methods, such as smart cards and standard cards, are widely used, providing added security features and financial services. Fuel cards cater to various needs, including vehicle service, parking, toll charges, and fuel rewards. Platinum status and In-Store Rewards are popular incentives for cardholders, offering additional benefits at Shell Oil Products and other fuel retailers.
Additionally, fleet managers greatly benefit from fuel cards, as they facilitate expense management, data capture, telematics integration, and reporting facilities. Card issuers and fuel retailers collaborate to provide these services, ensuring a seamless experience for both parties. Universal fuel cards and merchant cards cater to businesses with diverse fueling needs, while branded fuel cards offer loyalty programs and environmental initiatives. Fleet companies and telematics interface further enhance the functionality of fuel cards, making them an essential tool for effective fuel management.
|
Market Scope |
|
|
Report Coverage |
Details |
|
Page number |
152 |
|
Base year |
2023 |
|
Historic period |
2018-2022 |
|
Forecast period |
2024-2028 |
|
Growth momentum & CAGR |
Accelerate at a CAGR of 6.36% |
|
Market growth 2024-2028 |
USD 2.98 billion |
|
Market structure |
Fragmented |
|
YoY growth 2023-2024(%) |
5.58 |
|
Key countries |
US, UK, Germany, China, and India |
|
Competitive landscape |
Leading Companies, Market Positioning of Companies, Competitive Strategies, and Industry Risks |
What are the Key Data Covered in this Market Research and Growth Report?
- CAGR of the market during the forecast period
- Detailed information on factors that will drive the market growth and forecasting between 2024 and 2028
- Precise estimation of the size of the market and its contribution of the market in focus to the parent market
- Accurate predictions about upcoming market growth and trends and changes in consumer behaviour
- Growth of the market across Europe, North America, APAC, Middle East and Africa, and South America
- Thorough analysis of the market's competitive landscape and detailed information about companies
- Comprehensive analysis of factors that will challenge the growth of market companies
We can help! Our analysts can customize this market research report to meet your requirements. Get in touch
 RIA -
RIA - 
