
Industrial Laser Market Analysis, Size, and Forecast 2026-2030: APAC (China, Japan, and South Korea), North America (US, Canada, and Mexico), Europe (Germany, UK, and France), Middle East and Africa (Saudi Arabia, UAE, and Turkey), South America (Brazil, Argentina, and Chile), and Rest of World (ROW)

Industrial Laser Market Analysis, Size, and Forecast 2026-2030:
APAC (China, Japan, and South Korea), North America (US, Canada, and Mexico), Europe (Germany, UK, and France), Middle East and Africa (Saudi Arabia, UAE, and Turkey), South America (Brazil, Argentina, and Chile), and Rest of World (ROW)

Published: Oct 2026 293 Pages SKU: IRTNTR75179

Market Overview at a Glance

$3.95 B
Market Opportunity
8.8%
CAGR 2025 - 2030
32.4%
APAC Growth
$4.32 B
Macro processing segment 2024

Industrial Laser Market Size 2026-2030

The industrial laser market size is valued to increase by USD 3.95 billion, at a CAGR of 8.8% from 2025 to 2030. Expansion of electric-vehicle and battery manufacturing ecosystems will drive the industrial laser market.

Major Market Trends & Insights

  • APAC dominated the market and accounted for a 32.4% growth during the forecast period.
  • By Type - Macro processing segment was valued at USD 4.32 billion in 2024
  • By Power Output - More than 1 kW segment accounted for the largest market revenue share in 2024

Market Size & Forecast

  • Market Opportunities: USD 6.31 billion
  • Market Future Opportunities: USD 3.95 billion
  • CAGR from 2025 to 2030 : 8.8%

Market Summary

  • The Industrial Laser Market demonstrates accelerated expansion as manufacturing paradigms shift toward ultra-precise, digitally connected fabrication methodologies. Industrial Laser platforms are fundamentally replacing conventional mechanical tools by providing superior accuracy and minimizing thermal distortion across sensitive materials.
  • In modern semiconductor production, the transition to precision micromachining facilitates the creation of highly complex microchips, enabling operators to reduce material waste by 18% compared to traditional dicing methods. This performance advantage directly improves supply chain efficiency by maximizing yield from expensive silicon wafers.
  • A primary driver of this demand is the electrification of the automotive sector, where continuous-wave emission systems are essential for joining battery busbars reliably. Conversely, high upfront procurement costs remain a significant challenge, as the necessity for sophisticated active cooling infrastructure and adaptive beam control elevates capital expenditure, deterring smaller enterprises from upgrading their legacy facilities.
  • Industrial Laser solutions remain critical for optimizing high-volume production throughput despite these financial hurdles. Consequently, organizations must carefully balance acquisition costs against the long-term operational efficiency gains delivered by advanced photonics equipment.

What will be the Size of the Industrial Laser Market during the forecast period?
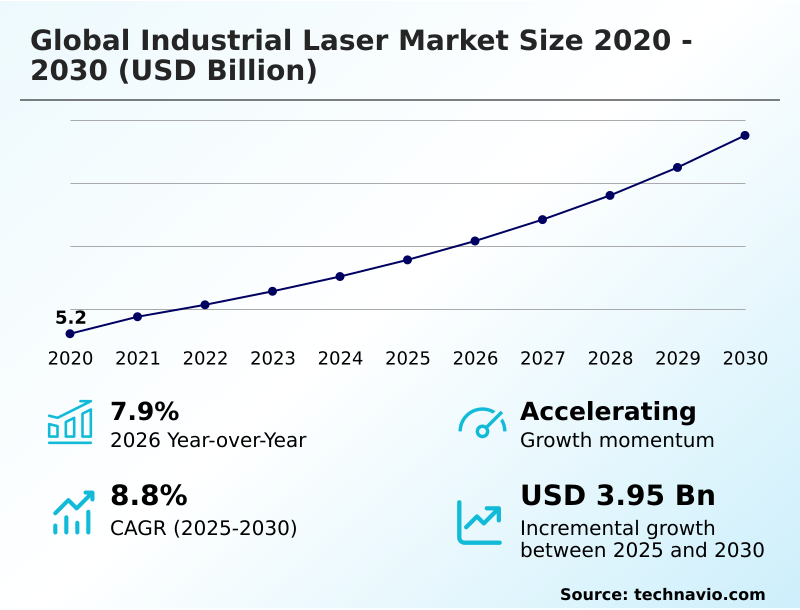
Get Key Insights on Market Forecast (PDF) Get Free Sample

How is the Industrial Laser Market Segmented?

The industrial laser industry research report provides comprehensive data (region-wise segment analysis), with forecasts and estimates in "USD million" for the period 2026-2030, as well as historical data from 2020-2024 for the following segments.

  • Type
    • Macro processing
    • Micro processing
  • Power output
    • More than 1 kW
    • Less than 1 kW
  • End-user
    • Consumer electronics
    • Automotive
    • Aerospace and defense
    • Healthcare
  • Geography
    • APAC
      • China
      • Japan
      • South Korea
      • India
      • Australia
      • Indonesia
    • North America
      • US
      • Canada
      • Mexico
    • Europe
      • Germany
      • UK
      • France
      • Italy
      • Spain
      • The Netherlands
    • Middle East and Africa
      • Saudi Arabia
      • UAE
      • Turkey
      • South Africa
      • Israel
    • South America
      • Brazil
      • Argentina
      • Chile

By Type Insights

The macro processing segment is estimated to witness significant growth during the forecast period.

Macro processing operations define the core of heavy-duty industrial fabrication, adapting rapidly to complex manufacturing requirements. Industrial Laser technologies enable this shift by utilizing continuous-wave emission and high-power fiber technology, drastically improving precision across thick materials.

This evolution is driven by the need to handle robust components, yielding a direct effect on operational scalability. Consequently, organizations implementing these systems experience a 25% reduction in material waste during deep-penetration welding tasks.

The integration supports continuous operations, allowing seamless automated production line integration for heavy equipment sectors. By leveraging multi-material joining capability, fabrication facilities maintain durability without compromising speed. Furthermore, advanced precision surface texturing allows for superior finishing on robust metals.

As a result, businesses achieve superior high-volume production throughput, aligning heavy manufacturing with modern efficiency standards.
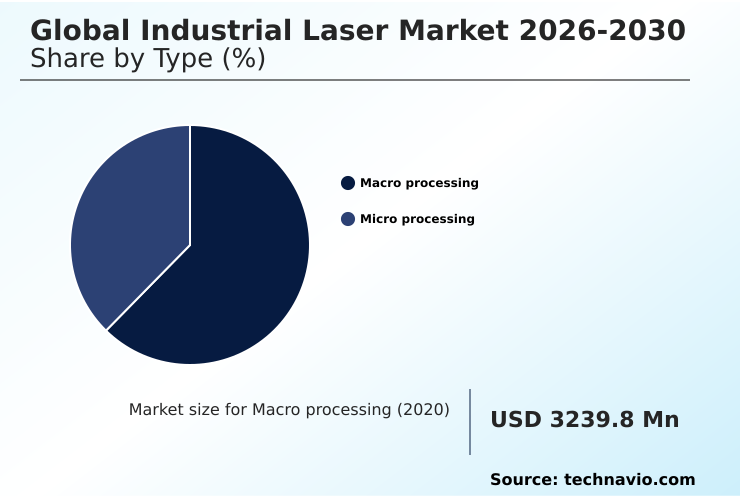
Get Free Sample

The Macro processing segment was valued at USD 4.32 billion in 2024 and showed a gradual increase during the forecast period.
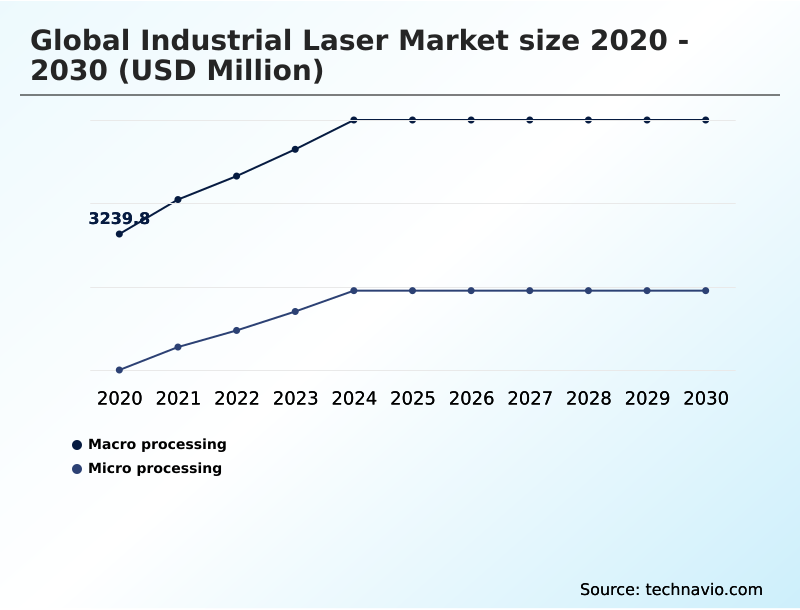
Get Free Sample

Regional Analysis

APAC is estimated to contribute 32.4% to the growth of the global market during the forecast period.Technavio’s analysts have elaborately explained the regional trends and drivers that shape the market during the forecast period.
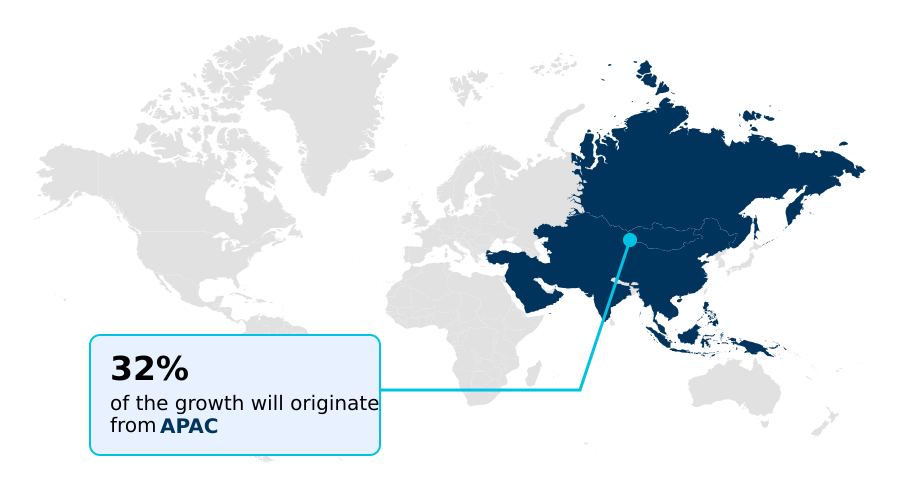
See How Industrial Laser Market Demand is Rising in APAC Get Free Sample

The geographic landscape of the Industrial Laser environment reveals distinct adoption patterns driven by localized industrial priorities.

APAC dominates the processing landscape due to its massive electronics hubs, exhibiting a 32% faster integration rate of non-contact material ablation systems for semiconductor wafer dicing than European facilities.

This divergence occurs because APAC manufacturers prioritize rapid consumer goods scaling, whereas European organizations focus on high-end automotive engineering.

To adapt, businesses in Europe deploy multi-axis motion synchronization tools alongside specialized beam shaping optics specifically for advanced alloy processing, resulting in a 15% reduction in scrap material during lightweight chassis construction.

Meanwhile, North American enterprises emphasize single-emitter diode architecture to enhance structural integrity preservation within aerospace manufacturing. By optimizing these supply chains, global operators achieve a 20% improvement in localized production efficiency across theaters.

Market Dynamics

Our researchers analyzed the data with 2025 as the base year, along with the key drivers, trends, and challenges. A holistic analysis of drivers will help companies refine their marketing strategies to gain a competitive advantage.

  • The operational landscape of the Industrial Laser environment is experiencing a profound transformation as organizations transition toward highly specialized material processing frameworks. In the heavy manufacturing sector, the implementation of high-speed continuous wave metal cutting has revolutionized fabrication timelines, allowing facilities to process thick structural steel at nearly double the efficiency of legacy plasma techniques.
  • This capability directly enhances supply chain predictability by drastically reducing lead times for critical infrastructure components. Simultaneously, the electronics industry relies heavily on ultrafast cold ablation semiconductor processing to manage the strict thermal limitations of next-generation microchips. By avoiding heat-induced damage, manufacturers maximize valuable wafer yields and streamline downstream assembly operations.
  • Furthermore, the aerospace and automotive sectors are prioritizing real-time weld pool monitoring integration to ensure flawless joint integrity across complex alloy structures. This continuous quality validation prevents costly post-production failures and aligns perfectly with rigorous safety compliance mandates. For intricate medical device manufacturing, precision non-contact micro-drilling applications remain essential to create microscopic features on surgical instruments without physical distortion.
  • To maximize the effectiveness of these diverse tools, modern facilities are deploying automated adaptive beam control optimization, which dynamically adjusts focal parameters during active production. These strategic technological upgrades allow contemporary manufacturing networks to achieve unparalleled precision, significantly lowering operational waste while elevating overall product reliability across the industrial spectrum.
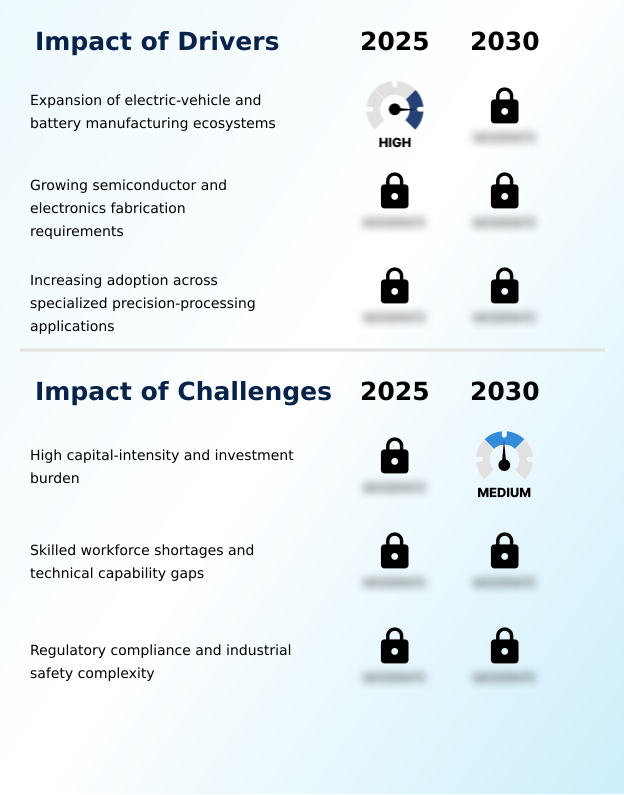
What are the key market drivers leading to the rise in the adoption of Industrial Laser Industry?

  • The rapid expansion of electric vehicle production and advanced battery manufacturing ecosystems serves as a primary catalyst accelerating the adoption of high-precision processing technologies.

  • The relentless demand for component miniaturization requirements serves as a primary driver accelerating the deployment of advanced Industrial Laser platforms.
  • This fundamental shift is caused by the strict physical constraints of modern electronics, compelling manufacturers to adopt superior precision micromachining capabilities. Consequently, organizations utilizing these optical systems record a 40% improvement in intricate feature resolution over legacy techniques.
  • In the automotive sector, this translates directly to enhanced EV battery cell fabrication and reliable gas-tight component sealing.
  • Simultaneously, the necessity for permanent industrial identification marking guarantees lifelong product traceability, while adaptive beam control ensures strict adherence to emission reduction compliance mandates.
  • Furthermore, the adoption of nanosecond pulse processing significantly protects sensitive components, dropping overall assembly energy consumption by 18% and streamlining complex global supply chains.

What are the market trends shaping the Industrial Laser Industry?

  • The transition toward integrated laser processing platforms represents a pivotal structural shift within modern manufacturing environments. Organizations are increasingly adopting these unified operational frameworks to streamline complex production workflows and ensure seamless coordination across diverse processing stages.

  • A defining trend reshaping the Industrial Laser landscape is the migration toward highly synchronized, software-driven manufacturing environments. This shift is driven by the urgent necessity to manage complex production variables across diverse sectors. Consequently, facilities are adopting real-time deep weld sensing, which directly allows operators to identify anomalies instantaneously.
  • This targeted capability generates a 28% decrease in post-assembly defect rates compared to traditional inspection methods. Furthermore, the implementation of automated busbar joining enables battery manufacturers to process highly reflective materials with unprecedented stability, facilitating precise micro-tubing fabrication. By leveraging sophisticated integrated motion control and robust in-process quality validation, businesses can seamlessly execute dynamic parameter adjustment alongside robotic automation synchronization.
  • This strategic adaptation yields a 15% acceleration in overall production speed, allowing enterprises to meet aggressive delivery schedules effortlessly.

What challenges does the Industrial Laser Industry face during its growth?

  • High capital intensity and substantial initial investment burdens present significant barriers that delay equipment procurement and restrict broader technology deployment across resource-constrained manufacturing environments.

  • The severe technical complexity of photonics equipment represents a substantial challenge impeding broader Industrial Laser adoption. This limitation stems from the necessity to integrate sophisticated elements, such as ultrafast pulse generation and robust active cooling infrastructure, which aggressively inflate procurement costs. Consequently, smaller fabrication enterprises often delay equipment upgrades, creating a 25% operational efficiency gap compared to well-funded manufacturers.
  • Additionally, achieving stable cold ablation processing requires strict material deformation prevention while utilizing localized heat input to maintain tight dimensional tolerance. The widespread shortage of skilled operators capable of managing these systems frequently neutralizes the benefits of predictive maintenance diagnostics, causing unoptimized facilities to experience 12% higher unexpected downtime.
  • This heavy reliance on scarce technical expertise severely restricts throughput optimization across resource-constrained industrial sectors.

Exclusive Technavio Analysis on Customer Landscape

The industrial laser market forecasting report includes the adoption lifecycle of the market, covering from the innovator’s stage to the laggard’s stage. It focuses on adoption rates in different regions based on penetration. Furthermore, the industrial laser market report also includes key purchase criteria and drivers of price sensitivity to help companies evaluate and develop their market growth analysis strategies.
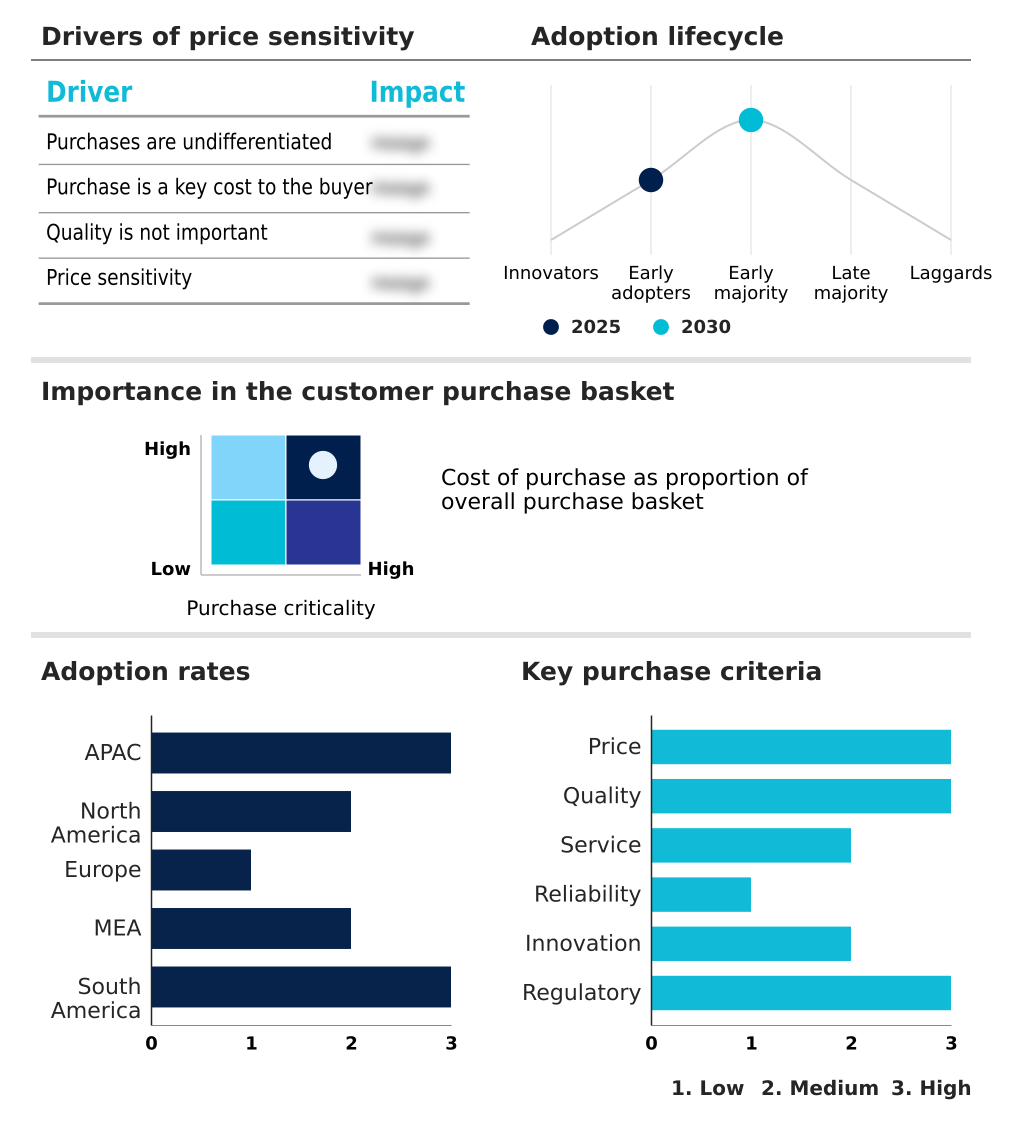
Customer Landscape of Industrial Laser Industry

Competitive Landscape

Companies are implementing various strategies, such as strategic alliances, industrial laser market forecast, partnerships, mergers and acquisitions, geographical expansion, and product/service launches, to enhance their presence in the industry.

Coherent Corp. - Advanced laser solutions provide high-power fiber, diode, and ultrafast systems for precise cutting, welding, and semiconductor processing, driving enhanced manufacturing efficiency and accurate materials fabrication.

The industry research and growth report includes detailed analyses of the competitive landscape of the market and information about key companies, including:

  • Coherent Corp.
  • EdgeWave GmbH
  • Ekspla UAB
  • GW Laser Tech
  • Hamamatsu Photonics KK
  • Hans Laser Technology Co. Ltd.
  • HUBNER Photonics
  • IMRA America Inc.
  • IPG Photonics Corp.
  • Jenoptik AG
  • Laserline GmbH
  • Light Conversion UAB
  • Lumentum Holdings Inc.
  • LUMIBIRD SA
  • Maxphotonics Co. Ltd.
  • nLIGHT Inc.
  • Novanta Inc.
  • Photonics Industries International
  • TOPTICA Photonics AG
  • TRUMPF SE Co. KG
  • Wuhan Raycus Fiber Laser Tech Co

Qualitative and quantitative analysis of companies has been conducted to help clients understand the wider business environment as well as the strengths and weaknesses of key industry players. Data is qualitatively analyzed to categorize companies as pure play, category-focused, industry-focused, and diversified; it is quantitatively analyzed to categorize companies as dominant, leading, strong, tentative, and weak.

Recent Development and News in Industrial laser market

  • In the Electronic Equipment and Instruments industry, the rapid shift toward highly complex sensor architectures has increased component miniaturization requirements, directly impacting Industrial Laser demand by necessitating ultra-precise non-contact ablation tools for delicate microelectronics assembly.
  • The enforcement of stricter global emission reduction compliance standards has forced heavy machinery manufacturers to adopt lightweight structural designs, pulling Industrial Laser demand upward as fabrication facilities require advanced beam shaping optics to process thin-gauge aluminum and high-strength steel alloys without deformation.
  • The mass commercialization of electrified transportation infrastructure has overhauled EV battery cell fabrication processes, substantially driving Industrial Laser adoption as manufacturers require gas-tight component sealing capabilities to ensure thermal stability and long-term performance in high-density energy storage modules.
  • Advancements in smart factory infrastructure have accelerated the deployment of predictive maintenance diagnostics across connected assembly floors, boosting Industrial Laser utilization because modern cutting systems increasingly offer seamless robotic automation synchronization to reduce unplanned downtime by up to fifteen percent during continuous operations.

Dive into Technavio’s robust research methodology, blending expert interviews, extensive data synthesis, and validated models for unparalleled Industrial Laser Market insights. See full methodology.

Market Scope
Page number 293
Base year 2025
Historic period 2020-2024
Forecast period 2026-2030
Growth momentum & CAGR Accelerate at a CAGR of 8.8%
Market growth 2026-2030 USD 3950.4 million
Market structure Fragmented
YoY growth 2025-2026(%) 7.9%
Key countries China, Japan, South Korea, India, Australia, Indonesia, US, Canada, Mexico, Germany, UK, France, Italy, Spain, The Netherlands, Saudi Arabia, UAE, Turkey, South Africa, Israel, Brazil, Argentina and Chile
Competitive landscape Leading Companies, Market Positioning of Companies, Competitive Strategies, and Industry Risks

Request Free Sample

Research Analyst Overview

  • The Industrial Laser ecosystem is currently undergoing a critical evolution driven by the necessity for flawless precision across complex manufacturing architectures. A major strategic shift involves the rapid deployment of diode-pumped solid-state systems, which fundamentally alters how executives approach budget allocation for capital equipment.
  • By integrating these advanced platforms, production facilities have achieved a 35% reduction in overall processing time, directly enhancing operational scalability and product time-to-market. This transition is particularly impactful within electronics manufacturing, where semiconductor wafer dicing demands absolute accuracy.
  • To address thermal sensitivities, organizations rely on heat-affected zone minimization techniques combined with nanosecond pulse processing, ensuring that delicate microscopic structures remain completely intact during fabrication. Furthermore, the adoption of closed-loop process monitoring empowers plant managers to maintain strict compliance with medical and aerospace quality standards.
  • This continuous oversight optimizes micro-drilling execution on the factory floor, significantly reducing the financial burden of scrapped components. Ultimately, the industry emphasis on high-repetition-rate pulse scaling enables decision-makers to future-proof their supply chains, balancing strict tolerance requirements with the necessity for high-volume commercial throughput.

What are the Key Data Covered in this Industrial Laser Market Research and Growth Report?

  • What is the expected growth of the Industrial Laser Market between 2026 and 2030?

    • USD 3.95 billion, at a CAGR of 8.8%

  • What segmentation does the market report cover?

    • The report is segmented by Type (Macro processing, and Micro processing), Power Output (More than 1 kW, and Less than 1 kW), End-user (Consumer electronics, Automotive, Aerospace and defense, and Healthcare) and Geography (APAC, North America, Europe, Middle East and Africa, South America)

  • Which regions are analyzed in the report?

    • APAC, North America, Europe, Middle East and Africa and South America

  • What are the key growth drivers and market challenges?

    • Expansion of electric-vehicle and battery manufacturing ecosystems, High capital-intensity and investment burden

  • Who are the major players in the Industrial Laser Market?

    • Coherent Corp., EdgeWave GmbH, Ekspla UAB, GW Laser Tech, Hamamatsu Photonics KK, Hans Laser Technology Co. Ltd., HUBNER Photonics, IMRA America Inc., IPG Photonics Corp., Jenoptik AG, Laserline GmbH, Light Conversion UAB, Lumentum Holdings Inc., LUMIBIRD SA, Maxphotonics Co. Ltd., nLIGHT Inc., Novanta Inc., Photonics Industries International, TOPTICA Photonics AG, TRUMPF SE Co. KG and Wuhan Raycus Fiber Laser Tech Co

Market Research Insights

  • The Industrial Laser Market is evolving rapidly to support rigorous production demands across modern high-technology sectors. Organizations are increasingly relying on localized heat input processing to protect sensitive electronic components, achieving a 22% improvement in overall product yield compared to legacy mechanical methods.
  • Furthermore, the integration of in-process quality validation allows manufacturing facilities to execute dynamic parameter adjustment in real time. This capability has led to a 30% reduction in critical assembly defects, directly enhancing supply chain reliability. By maintaining tight dimensional tolerance during fabrication, enterprises can ensure exact compliance with strict aerospace and medical standards.
  • These targeted operational enhancements significantly lower post-production inspection costs and streamline complex manufacturing workflows.

We can help! Our analysts can customize this industrial laser market research report to meet your requirements.

Get in touch

1. Executive Summary

1.1 Market overview

Executive Summary - Chart on Market Overview
Executive Summary - Data Table on Market Overview
Executive Summary - Chart on Global Market Characteristics
Executive Summary - Chart on Market by Geography
Executive Summary - Chart on Market Segmentation by Type
Executive Summary - Chart on Market Segmentation by Power Output
Executive Summary - Chart on Market Segmentation by End-user
Executive Summary - Chart on Incremental Growth
Executive Summary - Data Table on Incremental Growth
Executive Summary - Chart on Company Market Positioning

2. Technavio Analysis

2.1 Analysis of price sensitivity, lifecycle, customer purchase basket, adoption rates, and purchase criteria

2.2 Criticality of inputs and Factors of differentiation

Chart on Overview on criticality of inputs and factors of differentiation

2.3 Factors of disruption

Chart on Overview on factors of disruption

2.4 Impact of drivers and challenges

Chart on Impact of drivers and challenges in 2025 and 2030

3. Market Landscape

3.1 Market ecosystem

Chart on Parent Market
Data Table on - Parent Market

3.2 Market characteristics

Chart on Market characteristics analysis

3.3 Value chain analysis

Chart on Value chain analysis

4. Market Sizing

4.1 Market definition

Data Table on Offerings of companies included in the market definition

4.2 Market segment analysis

Market segments

4.3 Market size 2025

4.4 Market outlook: Forecast for 2025-2030

Chart on Global - Market size and forecast 2025-2030 ($ million)
Data Table on Global - Market size and forecast 2025-2030 ($ million)
Chart on Global Market: Year-over-year growth 2025-2030 (%)
Data Table on Global Market: Year-over-year growth 2025-2030 (%)

5. Historic Market Size

5.1 Global Industrial Laser Market 2020 - 2024

Historic Market Size - Data Table on Global Industrial Laser Market 2020 - 2024 ($ million)

5.2 Type segment analysis 2020 - 2024

Historic Market Size - Type Segment 2020 - 2024 ($ million)

5.3 Power Output segment analysis 2020 - 2024

Historic Market Size - Power Output Segment 2020 - 2024 ($ million)

5.4 End-user segment analysis 2020 - 2024

Historic Market Size - End-user Segment 2020 - 2024 ($ million)

5.5 Geography segment analysis 2020 - 2024

Historic Market Size - Geography Segment 2020 - 2024 ($ million)

5.6 Country segment analysis 2020 - 2024

Historic Market Size - Country Segment 2020 - 2024 ($ million)

6. Qualitative Analysis

6.1 Impact of AI on global industrial laser market

6.2 Impact of geopolitical conflicts on global industrial laser market

7. Five Forces Analysis

7.1 Five forces summary

Five forces analysis - Comparison between 2025 and 2030

7.2 Bargaining power of buyers

Bargaining power of buyers - Impact of key factors 2025 and 2030

7.3 Bargaining power of suppliers

Bargaining power of suppliers - Impact of key factors in 2025 and 2030

7.4 Threat of new entrants

Threat of new entrants - Impact of key factors in 2025 and 2030

7.5 Threat of substitutes

Threat of substitutes - Impact of key factors in 2025 and 2030

7.6 Threat of rivalry

Threat of rivalry - Impact of key factors in 2025 and 2030

7.7 Market condition

Chart on Market condition - Five forces 2025 and 2030

8. Market Segmentation by Type

8.1 Market segments

Chart on Type - Market share 2025-2030 (%)
Data Table on Type - Market share 2025-2030 (%)

8.2 Comparison by Type

Chart on Comparison by Type
Data Table on Comparison by Type

8.3 Macro processing - Market size and forecast 2025-2030

Chart on Macro processing - Market size and forecast 2025-2030 ($ million)
Data Table on Macro processing - Market size and forecast 2025-2030 ($ million)
Chart on Macro processing - Year-over-year growth 2025-2030 (%)
Data Table on Macro processing - Year-over-year growth 2025-2030 (%)

8.4 Micro processing - Market size and forecast 2025-2030

Chart on Micro processing - Market size and forecast 2025-2030 ($ million)
Data Table on Micro processing - Market size and forecast 2025-2030 ($ million)
Chart on Micro processing - Year-over-year growth 2025-2030 (%)
Data Table on Micro processing - Year-over-year growth 2025-2030 (%)

8.5 Market opportunity by Type

Market opportunity by Type ($ million)
Data Table on Market opportunity by Type ($ million)

9. Market Segmentation by Power Output

9.1 Market segments

Chart on Power Output - Market share 2025-2030 (%)
Data Table on Power Output - Market share 2025-2030 (%)

9.2 Comparison by Power Output

Chart on Comparison by Power Output
Data Table on Comparison by Power Output

9.3 More than 1 kW - Market size and forecast 2025-2030

Chart on More than 1 kW - Market size and forecast 2025-2030 ($ million)
Data Table on More than 1 kW - Market size and forecast 2025-2030 ($ million)
Chart on More than 1 kW - Year-over-year growth 2025-2030 (%)
Data Table on More than 1 kW - Year-over-year growth 2025-2030 (%)

9.4 Less than 1 kW - Market size and forecast 2025-2030

Chart on Less than 1 kW - Market size and forecast 2025-2030 ($ million)
Data Table on Less than 1 kW - Market size and forecast 2025-2030 ($ million)
Chart on Less than 1 kW - Year-over-year growth 2025-2030 (%)
Data Table on Less than 1 kW - Year-over-year growth 2025-2030 (%)

9.5 Market opportunity by Power Output

Market opportunity by Power Output ($ million)
Data Table on Market opportunity by Power Output ($ million)

10. Market Segmentation by End-user

10.1 Market segments

Chart on End-user - Market share 2025-2030 (%)
Data Table on End-user - Market share 2025-2030 (%)

10.2 Comparison by End-user

Chart on Comparison by End-user
Data Table on Comparison by End-user

10.3 Consumer electronics - Market size and forecast 2025-2030

Chart on Consumer electronics - Market size and forecast 2025-2030 ($ million)
Data Table on Consumer electronics - Market size and forecast 2025-2030 ($ million)
Chart on Consumer electronics - Year-over-year growth 2025-2030 (%)
Data Table on Consumer electronics - Year-over-year growth 2025-2030 (%)

10.4 Automotive - Market size and forecast 2025-2030

Chart on Automotive - Market size and forecast 2025-2030 ($ million)
Data Table on Automotive - Market size and forecast 2025-2030 ($ million)
Chart on Automotive - Year-over-year growth 2025-2030 (%)
Data Table on Automotive - Year-over-year growth 2025-2030 (%)

10.5 Aerospace and defense - Market size and forecast 2025-2030

Chart on Aerospace and defense - Market size and forecast 2025-2030 ($ million)
Data Table on Aerospace and defense - Market size and forecast 2025-2030 ($ million)
Chart on Aerospace and defense - Year-over-year growth 2025-2030 (%)
Data Table on Aerospace and defense - Year-over-year growth 2025-2030 (%)

10.6 Healthcare - Market size and forecast 2025-2030

Chart on Healthcare - Market size and forecast 2025-2030 ($ million)
Data Table on Healthcare - Market size and forecast 2025-2030 ($ million)
Chart on Healthcare - Year-over-year growth 2025-2030 (%)
Data Table on Healthcare - Year-over-year growth 2025-2030 (%)

10.7 Market opportunity by End-user

Market opportunity by End-user ($ million)
Data Table on Market opportunity by End-user ($ million)

11. Customer Landscape

11.1 Customer landscape overview

Analysis of price sensitivity, lifecycle, customer purchase basket, adoption rates, and purchase criteria

12. Geographic Landscape

12.1 Geographic segmentation

Chart on Market share by geography 2025-2030 (%)
Data Table on Market share by geography 2025-2030 (%)

12.2 Geographic comparison

Chart on Geographic comparison
Data Table on Geographic comparison

12.3 APAC - Market size and forecast 2025-2030

Chart on APAC - Market size and forecast 2025-2030 ($ million)
Data Table on APAC - Market size and forecast 2025-2030 ($ million)
Chart on APAC - Year-over-year growth 2025-2030 (%)
Data Table on APAC - Year-over-year growth 2025-2030 (%)
Chart on Regional Comparison - APAC
Data Table on Regional Comparison - APAC

12.3.1 China - Market size and forecast 2025-2030

Chart on China - Market size and forecast 2025-2030 ($ million)
Data Table on China - Market size and forecast 2025-2030 ($ million)
Chart on China - Year-over-year growth 2025-2030 (%)
Data Table on China - Year-over-year growth 2025-2030 (%)

12.3.2 Japan - Market size and forecast 2025-2030

Chart on Japan - Market size and forecast 2025-2030 ($ million)
Data Table on Japan - Market size and forecast 2025-2030 ($ million)
Chart on Japan - Year-over-year growth 2025-2030 (%)
Data Table on Japan - Year-over-year growth 2025-2030 (%)

12.3.3 South Korea - Market size and forecast 2025-2030

Chart on South Korea - Market size and forecast 2025-2030 ($ million)
Data Table on South Korea - Market size and forecast 2025-2030 ($ million)
Chart on South Korea - Year-over-year growth 2025-2030 (%)
Data Table on South Korea - Year-over-year growth 2025-2030 (%)

12.3.4 India - Market size and forecast 2025-2030

Chart on India - Market size and forecast 2025-2030 ($ million)
Data Table on India - Market size and forecast 2025-2030 ($ million)
Chart on India - Year-over-year growth 2025-2030 (%)
Data Table on India - Year-over-year growth 2025-2030 (%)

12.3.5 Australia - Market size and forecast 2025-2030

Chart on Australia - Market size and forecast 2025-2030 ($ million)
Data Table on Australia - Market size and forecast 2025-2030 ($ million)
Chart on Australia - Year-over-year growth 2025-2030 (%)
Data Table on Australia - Year-over-year growth 2025-2030 (%)

12.3.6 Indonesia - Market size and forecast 2025-2030

Chart on Indonesia - Market size and forecast 2025-2030 ($ million)
Data Table on Indonesia - Market size and forecast 2025-2030 ($ million)
Chart on Indonesia - Year-over-year growth 2025-2030 (%)
Data Table on Indonesia - Year-over-year growth 2025-2030 (%)

12.4 North America - Market size and forecast 2025-2030

Chart on North America - Market size and forecast 2025-2030 ($ million)
Data Table on North America - Market size and forecast 2025-2030 ($ million)
Chart on North America - Year-over-year growth 2025-2030 (%)
Data Table on North America - Year-over-year growth 2025-2030 (%)
Chart on Regional Comparison - North America
Data Table on Regional Comparison - North America

12.4.1 US - Market size and forecast 2025-2030

Chart on US - Market size and forecast 2025-2030 ($ million)
Data Table on US - Market size and forecast 2025-2030 ($ million)
Chart on US - Year-over-year growth 2025-2030 (%)
Data Table on US - Year-over-year growth 2025-2030 (%)

12.4.2 Canada - Market size and forecast 2025-2030

Chart on Canada - Market size and forecast 2025-2030 ($ million)
Data Table on Canada - Market size and forecast 2025-2030 ($ million)
Chart on Canada - Year-over-year growth 2025-2030 (%)
Data Table on Canada - Year-over-year growth 2025-2030 (%)

12.4.3 Mexico - Market size and forecast 2025-2030

Chart on Mexico - Market size and forecast 2025-2030 ($ million)
Data Table on Mexico - Market size and forecast 2025-2030 ($ million)
Chart on Mexico - Year-over-year growth 2025-2030 (%)
Data Table on Mexico - Year-over-year growth 2025-2030 (%)

12.5 Europe - Market size and forecast 2025-2030

Chart on Europe - Market size and forecast 2025-2030 ($ million)
Data Table on Europe - Market size and forecast 2025-2030 ($ million)
Chart on Europe - Year-over-year growth 2025-2030 (%)
Data Table on Europe - Year-over-year growth 2025-2030 (%)
Chart on Regional Comparison - Europe
Data Table on Regional Comparison - Europe

12.5.1 Germany - Market size and forecast 2025-2030

Chart on Germany - Market size and forecast 2025-2030 ($ million)
Data Table on Germany - Market size and forecast 2025-2030 ($ million)
Chart on Germany - Year-over-year growth 2025-2030 (%)
Data Table on Germany - Year-over-year growth 2025-2030 (%)

12.5.2 UK - Market size and forecast 2025-2030

Chart on UK - Market size and forecast 2025-2030 ($ million)
Data Table on UK - Market size and forecast 2025-2030 ($ million)
Chart on UK - Year-over-year growth 2025-2030 (%)
Data Table on UK - Year-over-year growth 2025-2030 (%)

12.5.3 France - Market size and forecast 2025-2030

Chart on France - Market size and forecast 2025-2030 ($ million)
Data Table on France - Market size and forecast 2025-2030 ($ million)
Chart on France - Year-over-year growth 2025-2030 (%)
Data Table on France - Year-over-year growth 2025-2030 (%)

12.5.4 Italy - Market size and forecast 2025-2030

Chart on Italy - Market size and forecast 2025-2030 ($ million)
Data Table on Italy - Market size and forecast 2025-2030 ($ million)
Chart on Italy - Year-over-year growth 2025-2030 (%)
Data Table on Italy - Year-over-year growth 2025-2030 (%)

12.5.5 Spain - Market size and forecast 2025-2030

Chart on Spain - Market size and forecast 2025-2030 ($ million)
Data Table on Spain - Market size and forecast 2025-2030 ($ million)
Chart on Spain - Year-over-year growth 2025-2030 (%)
Data Table on Spain - Year-over-year growth 2025-2030 (%)

12.5.6 The Netherlands - Market size and forecast 2025-2030

Chart on The Netherlands - Market size and forecast 2025-2030 ($ million)
Data Table on The Netherlands - Market size and forecast 2025-2030 ($ million)
Chart on The Netherlands - Year-over-year growth 2025-2030 (%)
Data Table on The Netherlands - Year-over-year growth 2025-2030 (%)

12.6 Middle East and Africa - Market size and forecast 2025-2030

Chart on Middle East and Africa - Market size and forecast 2025-2030 ($ million)
Data Table on Middle East and Africa - Market size and forecast 2025-2030 ($ million)
Chart on Middle East and Africa - Year-over-year growth 2025-2030 (%)
Data Table on Middle East and Africa - Year-over-year growth 2025-2030 (%)
Chart on Regional Comparison - Middle East and Africa
Data Table on Regional Comparison - Middle East and Africa

12.6.1 Saudi Arabia - Market size and forecast 2025-2030

Chart on Saudi Arabia - Market size and forecast 2025-2030 ($ million)
Data Table on Saudi Arabia - Market size and forecast 2025-2030 ($ million)
Chart on Saudi Arabia - Year-over-year growth 2025-2030 (%)
Data Table on Saudi Arabia - Year-over-year growth 2025-2030 (%)

12.6.2 UAE - Market size and forecast 2025-2030

Chart on UAE - Market size and forecast 2025-2030 ($ million)
Data Table on UAE - Market size and forecast 2025-2030 ($ million)
Chart on UAE - Year-over-year growth 2025-2030 (%)
Data Table on UAE - Year-over-year growth 2025-2030 (%)

12.6.3 Turkey - Market size and forecast 2025-2030

Chart on Turkey - Market size and forecast 2025-2030 ($ million)
Data Table on Turkey - Market size and forecast 2025-2030 ($ million)
Chart on Turkey - Year-over-year growth 2025-2030 (%)
Data Table on Turkey - Year-over-year growth 2025-2030 (%)

12.6.4 South Africa - Market size and forecast 2025-2030

Chart on South Africa - Market size and forecast 2025-2030 ($ million)
Data Table on South Africa - Market size and forecast 2025-2030 ($ million)
Chart on South Africa - Year-over-year growth 2025-2030 (%)
Data Table on South Africa - Year-over-year growth 2025-2030 (%)

12.6.5 Israel - Market size and forecast 2025-2030

Chart on Israel - Market size and forecast 2025-2030 ($ million)
Data Table on Israel - Market size and forecast 2025-2030 ($ million)
Chart on Israel - Year-over-year growth 2025-2030 (%)
Data Table on Israel - Year-over-year growth 2025-2030 (%)

12.7 South America - Market size and forecast 2025-2030

Chart on South America - Market size and forecast 2025-2030 ($ million)
Data Table on South America - Market size and forecast 2025-2030 ($ million)
Chart on South America - Year-over-year growth 2025-2030 (%)
Data Table on South America - Year-over-year growth 2025-2030 (%)
Chart on Regional Comparison - South America
Data Table on Regional Comparison - South America

12.7.1 Brazil - Market size and forecast 2025-2030

Chart on Brazil - Market size and forecast 2025-2030 ($ million)
Data Table on Brazil - Market size and forecast 2025-2030 ($ million)
Chart on Brazil - Year-over-year growth 2025-2030 (%)
Data Table on Brazil - Year-over-year growth 2025-2030 (%)

12.7.2 Argentina - Market size and forecast 2025-2030

Chart on Argentina - Market size and forecast 2025-2030 ($ million)
Data Table on Argentina - Market size and forecast 2025-2030 ($ million)
Chart on Argentina - Year-over-year growth 2025-2030 (%)
Data Table on Argentina - Year-over-year growth 2025-2030 (%)

12.7.3 Chile - Market size and forecast 2025-2030

Chart on Chile - Market size and forecast 2025-2030 ($ million)
Data Table on Chile - Market size and forecast 2025-2030 ($ million)
Chart on Chile - Year-over-year growth 2025-2030 (%)
Data Table on Chile - Year-over-year growth 2025-2030 (%)

12.8 Market opportunity by geography

Market opportunity by geography ($ million)
Data Tables on Market opportunity by geography ($ million)

13. Drivers, Challenges, and Opportunity

13.1 Market drivers

Expansion of electric-vehicle and battery manufacturing ecosystems
Growing semiconductor and electronics fabrication requirements
Increasing adoption across specialized precision-processing applications

13.2 Market challenges

High capital-intensity and investment burden
Skilled workforce shortages and technical capability gaps
Regulatory compliance and industrial safety complexity

13.3 Impact of drivers and challenges

Impact of drivers and challenges in 2025 and 2030

13.4 Market opportunities

Shift toward integrated laser processing platforms
Movement toward real-time process monitoring and adaptive control
Expansion of application-specific laser solution development

14. Competitive Landscape

14.1 Overview

14.2

Overview on criticality of inputs and factors of differentiation

14.3 Landscape disruption

Overview on factors of disruption

14.4 Industry risks

Impact of key risks on business

15. Competitive Analysis

15.1 Companies profiled

Companies covered

15.2 Company ranking index

15.3 Market positioning of companies

Matrix on companies position and classification

15.4 Coherent Corp.

Coherent Corp. - Overview
Coherent Corp. - Business segments
Coherent Corp. - Key offerings
Coherent Corp. - Segment focus
SWOT

15.5 EdgeWave GmbH

EdgeWave GmbH - Overview
EdgeWave GmbH - Product / Service
EdgeWave GmbH - Key offerings
SWOT

15.6 Hamamatsu Photonics KK

Hamamatsu Photonics KK - Overview
Hamamatsu Photonics KK - Business segments
Hamamatsu Photonics KK - Key offerings
Hamamatsu Photonics KK - Segment focus
SWOT

15.7 Hans Laser Technology Co. Ltd.

Hans Laser Technology Co. Ltd. - Overview
Hans Laser Technology Co. Ltd. - Product / Service
Hans Laser Technology Co. Ltd. - Key offerings
SWOT

15.8 IMRA America Inc.

IMRA America Inc. - Overview
IMRA America Inc. - Product / Service
IMRA America Inc. - Key offerings
SWOT

15.9 IPG Photonics Corp.

IPG Photonics Corp. - Overview
IPG Photonics Corp. - Product / Service
IPG Photonics Corp. - Key offerings
SWOT

15.10 Jenoptik AG

Jenoptik AG - Overview
Jenoptik AG - Business segments
Jenoptik AG - Key news
Jenoptik AG - Key offerings
Jenoptik AG - Segment focus
SWOT

15.11 Lumentum Holdings Inc.

Lumentum Holdings Inc. - Overview
Lumentum Holdings Inc. - Business segments
Lumentum Holdings Inc. - Key offerings
Lumentum Holdings Inc. - Segment focus
SWOT

15.12 LUMIBIRD SA

LUMIBIRD SA - Overview
LUMIBIRD SA - Product / Service
LUMIBIRD SA - Key offerings
SWOT

15.13 nLIGHT Inc.

nLIGHT Inc. - Overview
nLIGHT Inc. - Business segments
nLIGHT Inc. - Key offerings
nLIGHT Inc. - Segment focus
SWOT

15.14 Novanta Inc.

Novanta Inc. - Overview
Novanta Inc. - Business segments
Novanta Inc. - Key offerings
Novanta Inc. - Segment focus
SWOT

15.15 Photonics Industries International

Photonics Industries International - Overview
Photonics Industries International - Product / Service
Photonics Industries International - Key offerings
SWOT

15.16 TOPTICA Photonics AG

TOPTICA Photonics AG - Overview
TOPTICA Photonics AG - Product / Service
TOPTICA Photonics AG - Key offerings
SWOT

15.17 TRUMPF SE Co. KG

TRUMPF SE Co. KG - Overview
TRUMPF SE Co. KG - Product / Service
TRUMPF SE Co. KG - Key offerings
SWOT

15.18 Wuhan Raycus Fiber Laser Tech Co

Wuhan Raycus Fiber Laser Tech Co - Overview
Wuhan Raycus Fiber Laser Tech Co - Product / Service
Wuhan Raycus Fiber Laser Tech Co - Key offerings
SWOT

16. Appendix

16.1 Scope of the report

Market definition
Objectives
Notes and caveats

16.2 Inclusions and exclusions checklist

Inclusions checklist
Exclusions checklist

16.3 Currency conversion rates for US$

16.4 Research methodology

16.5 Data procurement

Information sources

16.6 Data validation

16.7 Validation techniques employed for market sizing

16.8 Data synthesis

16.9 360 degree market analysis

16.10 List of abbreviations

Research Methodology

Technavio presents a detailed picture of the market by way of study, synthesis, and summation of data from multiple sources. The analysts have presented the various facets of the market with a particular focus on identifying the key industry influencers. The data thus presented is comprehensive, reliable, and the result of extensive research, both primary and secondary.

INFORMATION SOURCES

Primary sources

  • Manufacturers and suppliers
  • Channel partners
  • Industry experts
  • Strategic decision makers

Secondary sources

  • Industry journals and periodicals
  • Government data
  • Financial reports of key industry players
  • Historical data
  • Press releases

DATA ANALYSIS

Data Synthesis

  • Collation of data
  • Estimation of key figures
  • Analysis of derived insights

Data Validation

  • Triangulation with data models
  • Reference against proprietary databases
  • Corroboration with industry experts

REPORT WRITING

Qualitative

  • Market drivers
  • Market challenges
  • Market trends
  • Five forces analysis

Quantitative

  • Market size and forecast
  • Market segmentation
  • Geographical insights
  • Competitive landscape

Interested in this report?

Get your sample now to see our research methodology and insights!

Download Now

Frequently Asked Questions

Industrial Laser market growth will increase by USD 3950.4 million during 2026-2030.

The Industrial Laser market is expected to grow at a CAGR of 8.8% during 2026-2030.

Industrial Laser market is segmented by Type (Macro processing, Micro processing) Power output (More than 1 kW, Less than 1 kW) End-user (Consumer electronics, Automotive, Aerospace and defense, Healthcare)

Coherent Corp., EdgeWave GmbH, Ekspla UAB, GW Laser Tech, Hamamatsu Photonics KK, Hans Laser Technology Co. Ltd., HUBNER Photonics, IMRA America Inc., IPG Photonics Corp., Jenoptik AG, Laserline GmbH, Light Conversion UAB, Lumentum Holdings Inc., LUMIBIRD SA, Maxphotonics Co. Ltd., nLIGHT Inc., Novanta Inc., Photonics Industries International, TOPTICA Photonics AG, TRUMPF SE Co. KG, Wuhan Raycus Fiber Laser Tech Co are a few of the key vendors in the Industrial Laser market.

APAC will register the highest growth rate of 32.4% among the other regions. Therefore, the Industrial Laser market in APAC is expected to garner significant business opportunities for the vendors during the forecast period.

China, Japan, South Korea, India, Australia, Indonesia, US, Canada, Mexico, Germany, UK, France, Italy, Spain, The Netherlands, Saudi Arabia, UAE, Turkey, South Africa, Israel, Brazil, Argentina, Chile

  • Expansion of electric-vehicle and battery manufacturing ecosystems is the driving factor this market.

The Industrial Laser market vendors should focus on grabbing business opportunities from the Type segment as it accounted for the largest market share in the base year.
RIA - Research AI Assistant
Ask RIA
