
Semiconductor Market Size 2026-2030
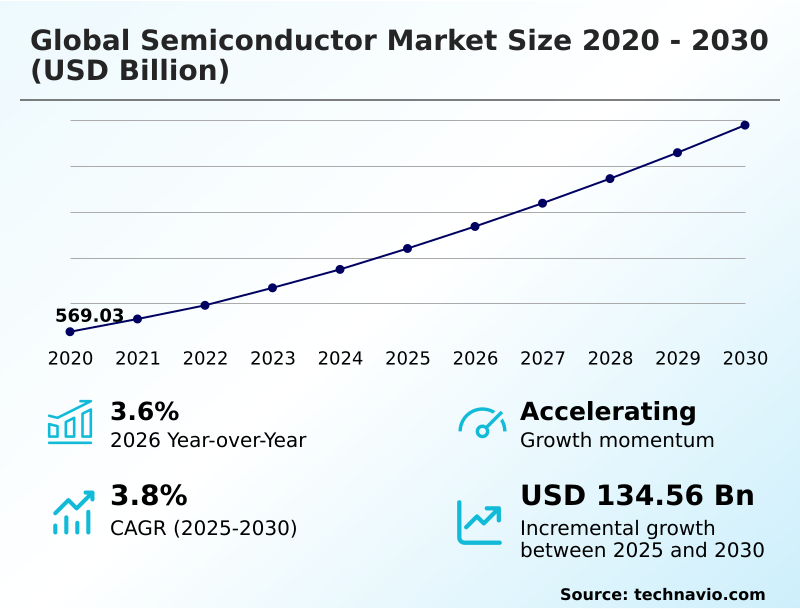
The semiconductor market size is valued to increase by USD 134.56 billion, at a CAGR of 3.8% from 2025 to 2030. Growing adoption of IoT devices will drive the semiconductor market.
Major Market Trends & Insights
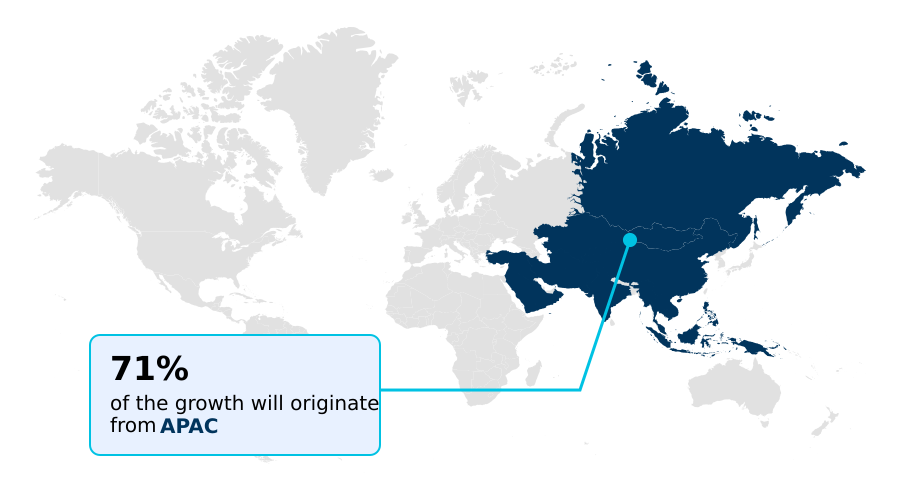
- APAC dominated the market and accounted for a 71.4% growth during the forecast period.
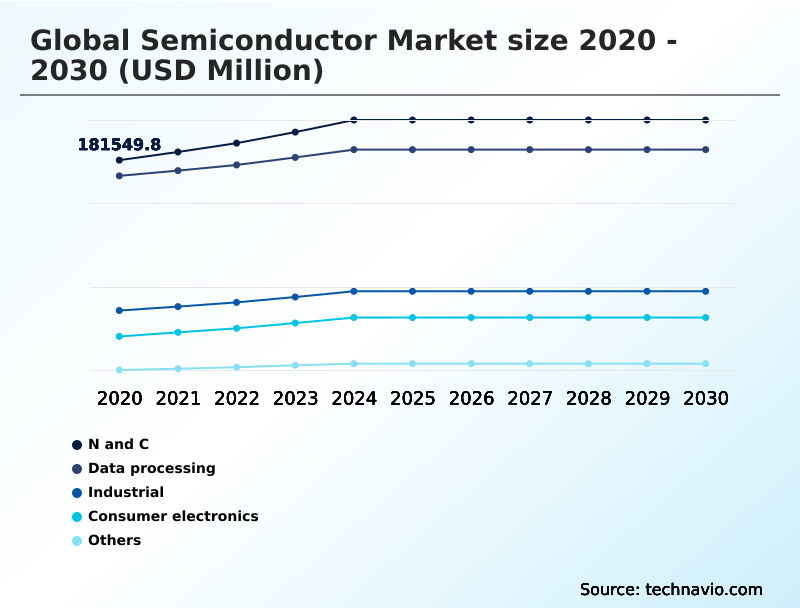
- By Application - N and C segment was valued at USD 206.17 billion in 2024
- By Product - ICs segment accounted for the largest market revenue share in 2024
Market Size & Forecast
- Market Opportunities: USD 225.36 billion
- Market Future Opportunities: USD 134.56 billion
- CAGR from 2025 to 2030 : 3.8%
Market Summary
- The semiconductor market serves as the bedrock of the modern digital economy, enabling advancements across nearly every industry. This market is defined by the design, fabrication, and packaging of essential components like microprocessors, memory chips, and sensors, which are integral to devices from smartphones to data centers.
- The industry's value chain is a complex global network involving fabless design firms, specialized foundries utilizing processes like EUV lithography, and OSAT companies that provide advanced packaging solutions. A key business scenario involves automotive manufacturers navigating this intricate supply web to secure a stable supply of automotive-grade chips and power semiconductors.
- These components are critical for advanced driver-assistance systems (ADAS) and electric vehicle powertrains, where a shortage can halt production, demonstrating the industry's profound economic impact.
- Continuous innovation in areas such as AI accelerators and energy-efficient designs is essential to meet the escalating performance demands of emerging technologies like 5G, the Internet of Things, and autonomous systems, ensuring the market's central role in future technological progress.
What will be the Size of the Semiconductor Market during the forecast period?
Get Key Insights on Market Forecast (PDF) Get Free Sample
How is the Semiconductor Market Segmented?
The semiconductor industry research report provides comprehensive data (region-wise segment analysis), with forecasts and estimates in "USD million" for the period 2026-2030, as well as historical data from 2020-2024 for the following segments.
- Application
- N and C
- Data processing
- Industrial
- Consumer electronics
- Others
- Product
- ICs
- Optoelectronics
- Discrete semiconductors
- Sensors
- Business segment
- Integrated device manufacturers
- Fabless companies
- Foundries
- OSAT
- Geography
- APAC
- China
- Japan
- India
- North America
- US
- Canada
- Mexico
- Europe
- Germany
- UK
- France
- South America
- Brazil
- Argentina
- Middle East and Africa
- Saudi Arabia
- UAE
- South Africa
- Rest of World (ROW)
- APAC
By Application Insights
The n and c segment is estimated to witness significant growth during the forecast period.
The networking and communications segment is foundational, driven by the rollout of 5G and the expansion of data infrastructure. This area demands high-performance components like RF integrated circuits and optoelectronics to handle escalating data volumes.
Innovation in system on chip (SoC) design is crucial for enabling faster, more efficient data transmission. The development of advanced packaging techniques further supports the miniaturization required for modern communication devices.
For instance, optimized baseband processors now achieve a 30% reduction in power consumption, enhancing the battery life of mobile devices.
As connectivity becomes more embedded in industrial and consumer applications, the need for robust microcontrollers (MCUs) and reliable analog ICs continues to grow, underpinning the entire digital ecosystem.
This reliance on sophisticated semiconductor for automotive ADAS and AI-specific chip architecture ensures sustained demand.
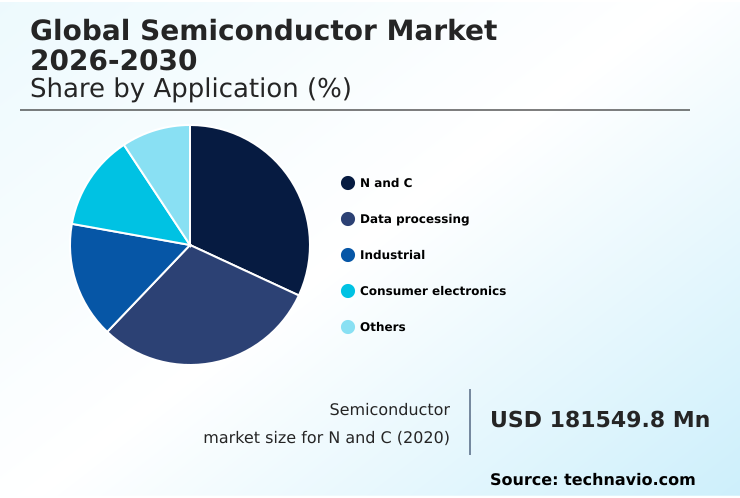
The N and C segment was valued at USD 206.17 billion in 2024 and showed a gradual increase during the forecast period.
Regional Analysis
APAC is estimated to contribute 71.4% to the growth of the global market during the forecast period.Technavio’s analysts have elaborately explained the regional trends and drivers that shape the market during the forecast period.
See How Semiconductor Market Demand is Rising in APAC Get Free Sample
The geographic landscape is defined by pronounced regional specializations. APAC dominates global manufacturing, accounting for over 71.4% of the market's incremental growth, driven by its extensive network of foundries and OSAT providers.
This concentration of wafer fabrication and advanced packaging services in APAC has enabled a 15% reduction in production cycle times for many fabless companies.
In contrast, North America leads in high-value chip design, R&D, and the production of semiconductor manufacturing equipment, contributing 16.41% to growth. Europe maintains a strong position in the automotive and industrial sectors, focusing on power semiconductors and MEMS sensors.
This global interdependence, with design in the West and high-volume manufacturing in the East, creates a complex but efficient supply chain, although it also introduces significant geopolitical and logistical challenges for entities reliant on discrete semiconductors.
Market Dynamics
Our researchers analyzed the data with 2025 as the base year, along with the key drivers, trends, and challenges. A holistic analysis of drivers will help companies refine their marketing strategies to gain a competitive advantage.
- Strategic decision-making in the semiconductor market is increasingly focused on the nuanced performance of specialized components. For instance, the selection of automotive electronics for electric vehicles now heavily weighs silicon carbide power module efficiency, as it directly impacts range and charging speed.
- Similarly, network equipment providers are prioritizing gallium nitride RF semiconductor performance to meet the stringent latency and bandwidth requirements of 5G infrastructure. In the high-performance computing sector, navigating EUV lithography manufacturing challenges is a critical operational concern for foundries, affecting both cost and the ability to produce next-generation processors.
- The FinFET architecture for mobile processors continues to evolve, balancing power consumption with processing power. For AI applications, the advantages of high-bandwidth memory for AI accelerators are clear; firms using these systems report that machine learning model training is over 50% faster compared to traditional memory configurations.
- This focus on specialized use cases, from advanced driver-assistance systems sensors to the specifics of wafer-level packaging yield, highlights a market shifting toward highly optimized, application-specific solutions where small technical advantages translate into significant competitive differentiation.
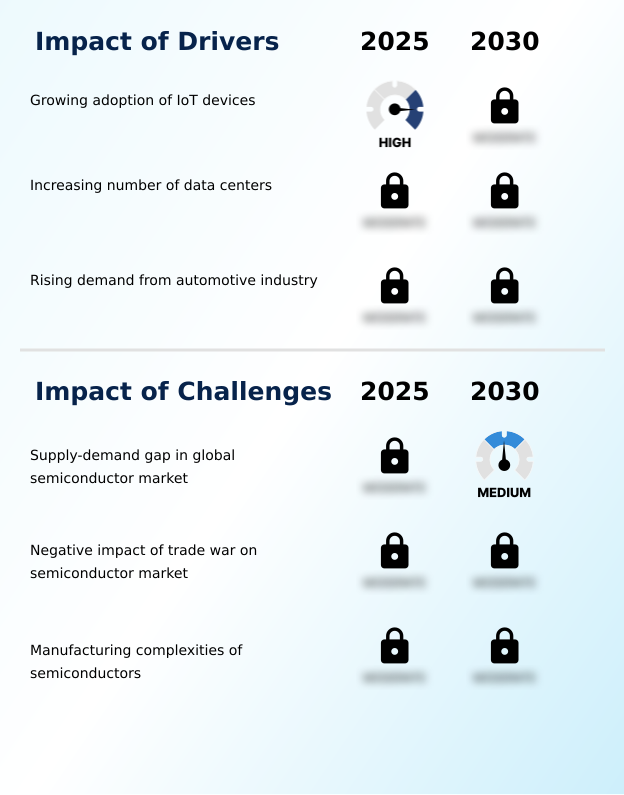
What are the key market drivers leading to the rise in the adoption of Semiconductor Industry?
- The growing adoption of IoT devices serves as a key market driver, significantly accelerating industry growth by increasing demand for connected and intelligent electronic systems.
- Market growth is propelled by escalating demand from next-generation applications and the increasing electronic content in traditional industries.
- The rapid expansion of IoT device semiconductor components is a primary driver, with some MCU suppliers reporting a 30% year-over-year increase in shipments for smart home and industrial automation applications.
- In the automotive sector, the semiconductor value per vehicle has more than doubled over the past five years, fueled by the adoption of ADAS and in-vehicle infotainment systems.
- This surge is creating immense demand for automotive-grade chips, analog ICs, and image sensors. Furthermore, the global build-out of 5G infrastructure continues to drive consumption of high-frequency RF integrated circuits and complex baseband processors, underpinning the connected future.
What are the market trends shaping the Semiconductor Industry?
- The increasing adoption of sustainable manufacturing is an upcoming market trend. This reflects the industry's growing focus on environmental responsibility and resource optimization.
- Key trends are reshaping the market's competitive landscape, with a strong emphasis on specialized hardware and sustainable operations. The development of AI-specific chip architecture is a dominant trend, with new AI accelerators delivering up to a 40% reduction in model training times, providing a significant advantage in data-driven industries.
- Concurrently, the industry is embracing sustainability, with advanced manufacturing practices leading to a 20% decrease in water usage per wafer at leading facilities. This focus on efficiency extends to components like power management ICs and power semiconductors, which are crucial for electric vehicles and renewable energy systems.
- The trend toward heterogeneous integration, combining multiple chiplets into one package, is also accelerating, driven by the need for more powerful and customized solutions in high-performance computing and edge computing hardware.
What challenges does the Semiconductor Industry face during its growth?
- The supply-demand gap in the global semiconductor market presents a key challenge, significantly affecting the stability and growth of the industry.
- The market faces persistent challenges related to manufacturing complexity and supply chain volatility. The intricate nature of semiconductor manufacturing processes, especially at advanced nodes below 7nm, results in yield rates that can be 15-20% lower than those of more mature technologies, impacting profitability.
- These manufacturing complexities are compounded by a reliance on highly specialized semiconductor manufacturing equipment and specific semiconductor raw materials, which are subject to geopolitical tensions and logistical disruptions. Consequently, the industry has experienced significant supply-demand imbalances, with lead times for certain mixed-signal ICs and discrete semiconductors extending beyond 52 weeks during peak shortages.
- These issues force fabless companies and IDMs to navigate a difficult landscape of capacity constraints and price fluctuations, complicating long-term planning.
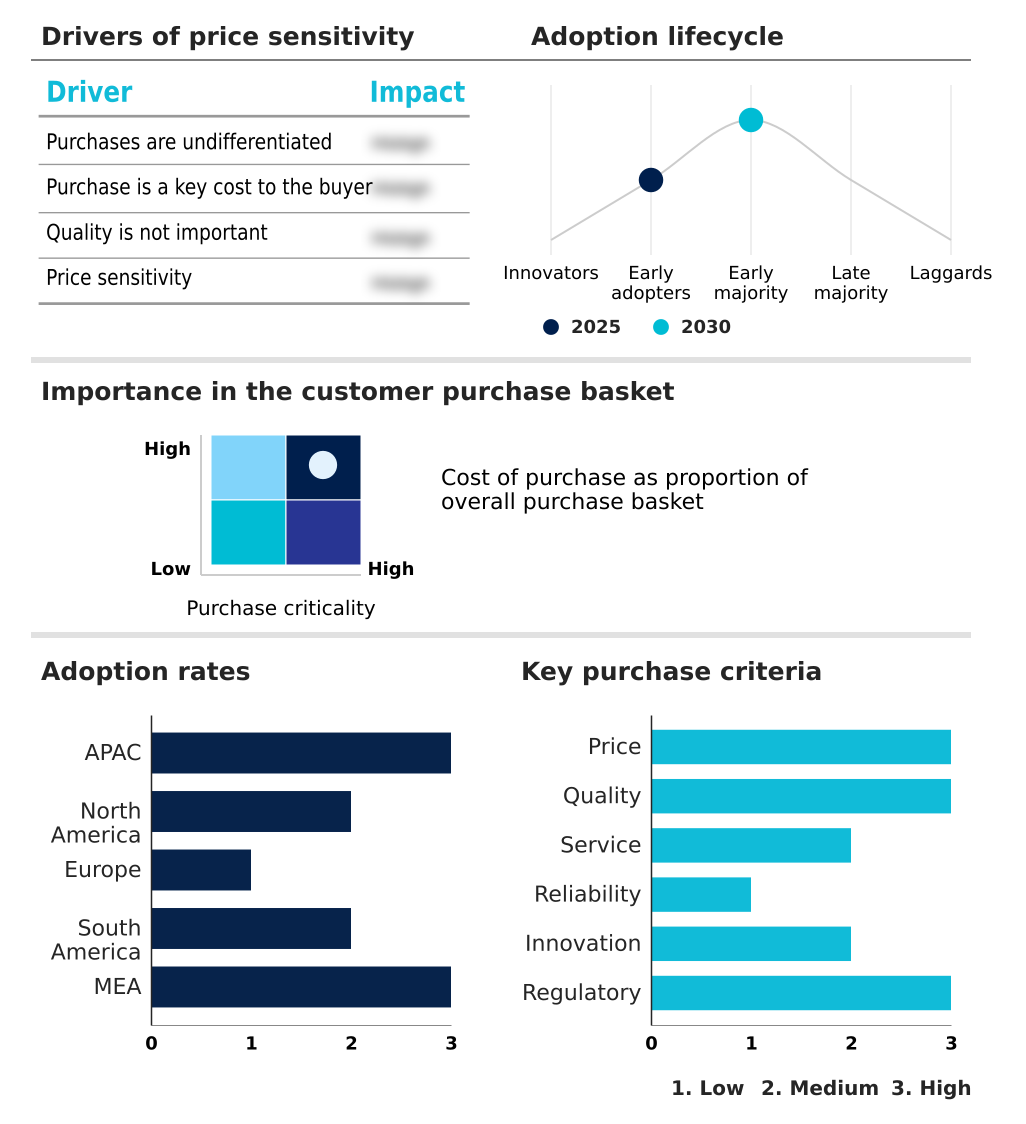
Exclusive Technavio Analysis on Customer Landscape
The semiconductor market forecasting report includes the adoption lifecycle of the market, covering from the innovator’s stage to the laggard’s stage. It focuses on adoption rates in different regions based on penetration. Furthermore, the semiconductor market report also includes key purchase criteria and drivers of price sensitivity to help companies evaluate and develop their market growth analysis strategies.
Customer Landscape of Semiconductor Industry
Competitive Landscape
Companies are implementing various strategies, such as strategic alliances, semiconductor market forecast, partnerships, mergers and acquisitions, geographical expansion, and product/service launches, to enhance their presence in the industry.
Advanced Micro Devices Inc. - Key offerings encompass high-performance computing and visualization semiconductors, including CPUs, GPUs, and adaptive SoCs for data center, client, gaming, and embedded markets.
The industry research and growth report includes detailed analyses of the competitive landscape of the market and information about key companies, including:
- Advanced Micro Devices Inc.
- Analog Devices Inc.
- Applied Materials Inc.
- ASML Holding NV
- Broadcom Inc.
- GlobalFoundaries Inc.
- Infineon Technologies AG
- Intel Corp.
- KLA Corp.
- Lam Research Corp.
- Marvell Technology Inc.
- MediaTek Inc.
- Microchip Technology Inc.
- Micron Technology Inc.
- NVIDIA Corp.
- NXP Semiconductors NV
- ON Semiconductor Corp.
- Qualcomm Inc.
- Renesas Electronics Corp.
- Samsung Electronics Co. Ltd.
- STMicroelectronics NV
- Taiwan Semiconductor Co. Ltd.
- Texas Instruments Inc.
Qualitative and quantitative analysis of companies has been conducted to help clients understand the wider business environment as well as the strengths and weaknesses of key industry players. Data is qualitatively analyzed to categorize companies as pure play, category-focused, industry-focused, and diversified; it is quantitatively analyzed to categorize companies as dominant, leading, strong, tentative, and weak.
Recent Development and News in Semiconductor market
- In August, 2025, Sony advanced its image sensor technology by introducing next generation optoelectronic components designed for high resolution mobile imaging and advanced machine vision applications.
- In September, 2025, Apple advanced its next generation consumer device ecosystem by integrating more powerful semiconductor-based processors across its product lineup, enhancing performance and energy efficiency in smartphones and personal computing devices.
- In October, 2025, Infineon Technologies advanced its silicon carbide based discrete semiconductor solutions designed for high efficiency power applications in electric mobility and renewable energy systems.
- In November, 2025, Bosch enhanced its next generation automotive sensor platform by introducing advanced semiconductor-based sensing technologies designed for autonomous driving and smart mobility applications.
Dive into Technavio’s robust research methodology, blending expert interviews, extensive data synthesis, and validated models for unparalleled Semiconductor Market insights. See full methodology.
| Market Scope | |
|---|---|
| Page number | 319 |
| Base year | 2025 |
| Historic period | 2020-2024 |
| Forecast period | 2026-2030 |
| Growth momentum & CAGR | Accelerate at a CAGR of 3.8% |
| Market growth 2026-2030 | USD 134558.3 million |
| Market structure | Fragmented |
| YoY growth 2025-2026(%) | 3.6% |
| Key countries | China, Japan, India, South Korea, Australia, Indonesia, US, Canada, Mexico, Germany, UK, France, Italy, Spain, The Netherlands, Brazil, Argentina, Chile, Saudi Arabia, UAE, South Africa, Israel and Turkey |
| Competitive landscape | Leading Companies, Market Positioning of Companies, Competitive Strategies, and Industry Risks |
Research Analyst Overview
- The semiconductor market remains the fundamental enabler of technological progress, with innovation in materials and architecture driving performance gains across all digital sectors. Core components such as DRAM, NAND flash, and graphics processing units (GPUs) are evolving to meet the demands of data-intensive workloads.
- The development of AI accelerators and other AI-specific chips represents a significant trend, compelling boardroom-level decisions regarding long-term R&D investment and strategic positioning in high-growth areas. The industry's manufacturing backbone relies on processes like wafer fabrication and photolithography, with a continuous push toward smaller, more complex nodes.
- Advanced materials are playing a crucial role; for example, the use of silicon carbide in power semiconductors has demonstrated an energy efficiency improvement of over 10% in certain industrial applications. This progress is supported by innovations in advanced packaging, including 3D integration and wafer-level packaging, which are essential for creating compact and powerful system on a chip (SoC) designs.
What are the Key Data Covered in this Semiconductor Market Research and Growth Report?
-
What is the expected growth of the Semiconductor Market between 2026 and 2030?
-
USD 134.56 billion, at a CAGR of 3.8%
-
-
What segmentation does the market report cover?
-
The report is segmented by Application (N and C, Data processing, Industrial, Consumer electronics, and Others), Product (ICs, Optoelectronics, Discrete semiconductors, and Sensors), Business Segment (Integrated device manufacturers, Fabless companies, Foundries, and OSAT) and Geography (APAC, North America, Europe, South America, Middle East and Africa)
-
-
Which regions are analyzed in the report?
-
APAC, North America, Europe, South America and Middle East and Africa
-
-
What are the key growth drivers and market challenges?
-
Growing adoption of IoT devices, Supply-demand gap in global semiconductor market
-
-
Who are the major players in the Semiconductor Market?
-
Advanced Micro Devices Inc., Analog Devices Inc., Applied Materials Inc., ASML Holding NV, Broadcom Inc., GlobalFoundaries Inc., Infineon Technologies AG, Intel Corp., KLA Corp., Lam Research Corp., Marvell Technology Inc., MediaTek Inc., Microchip Technology Inc., Micron Technology Inc., NVIDIA Corp., NXP Semiconductors NV, ON Semiconductor Corp., Qualcomm Inc., Renesas Electronics Corp., Samsung Electronics Co. Ltd., STMicroelectronics NV, Taiwan Semiconductor Co. Ltd. and Texas Instruments Inc.
-
Market Research Insights
- The market's dynamics are increasingly shaped by the convergence of high-performance computing and connectivity, creating significant demand for specialized components. For example, the development of sophisticated 5G chipset designs is enabling network speeds up to 10 times faster than previous generations, which has been a catalyst for industrial automation.
- Concurrently, semiconductors for automotive ADAS have become critical, with advanced sensor suites contributing to a 20% reduction in certain types of collisions. This demand for specialized processing extends to data center processing units, where new architectures have improved workload efficiency by over 30%.
- These shifts underscore a move toward application-specific hardware, influencing investment and R&D across the entire ecosystem, from raw material sourcing to fabless design strategies.
We can help! Our analysts can customize this semiconductor market research report to meet your requirements.
 RIA -
RIA - 
