Preclinical CRO Market Analysis, Size, and Forecast 2026-2030: North America (US, Canada, and Mexico), Europe (Germany, UK, and France), APAC (China, India, and Japan), South America (Brazil, Argentina, and Colombia), Middle East and Africa (Saudi Arabia, UAE, and Turkey), Asia, Rest of World (ROW)

Preclinical CRO Market Analysis, Size, and Forecast 2026-2030:
North America (US, Canada, and Mexico), Europe (Germany, UK, and France), APAC (China, India, and Japan), South America (Brazil, Argentina, and Colombia), Middle East and Africa (Saudi Arabia, UAE, and Turkey), Asia, Rest of World (ROW)

Published: Mar 2026 293 Pages SKU: IRTNTR75727

Market Overview at a Glance

$3.02 B
Market Opportunity
8.3%
CAGR 2025 - 2030
42.8%
North America Growth
$3.71 B
P and B companies segment 2024

Preclinical CRO Market Size 2026-2030

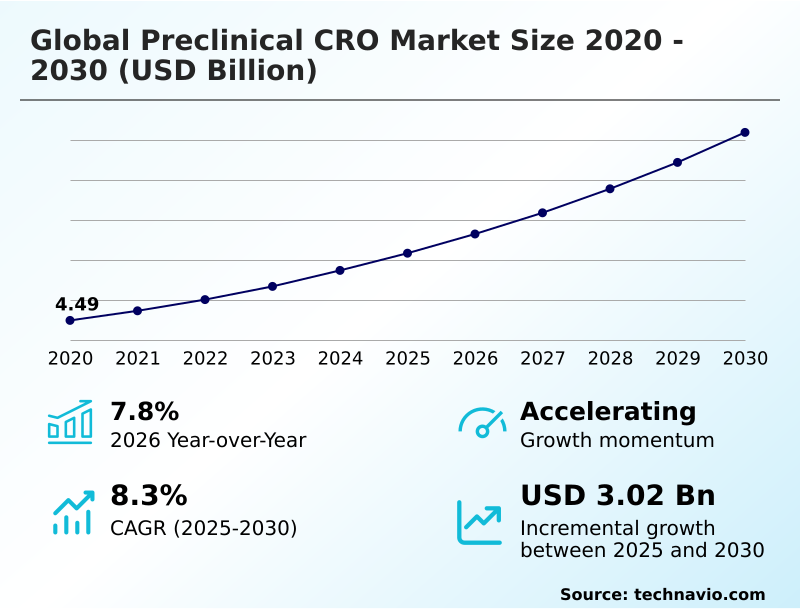
The preclinical cro market size is valued to increase by USD 3.02 billion, at a CAGR of 8.3% from 2025 to 2030. Regulatory modernization and industrialization of non-animal testing methodologies will drive the preclinical cro market.

Major Market Trends & Insights

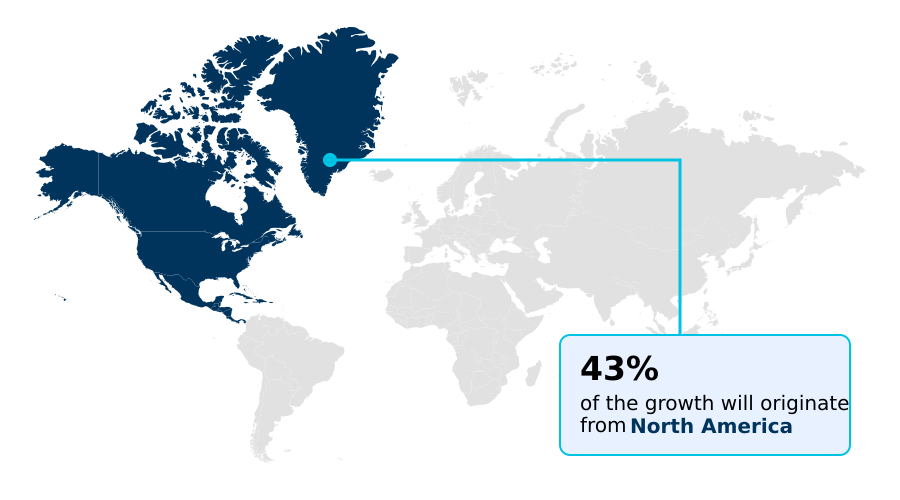
  • North America dominated the market and accounted for a 42.8% growth during the forecast period.
  • By End-user - P and B companies segment was valued at USD 3.71 billion in 2024
  • By Service - Toxicology testing segment accounted for the largest market revenue share in 2024

Market Size & Forecast

  • Market Opportunities: USD 4.70 billion
  • Market Future Opportunities: USD 3.02 billion
  • CAGR from 2025 to 2030 : 8.3%

Market Summary

  • The Preclinical CRO market is undergoing significant technical maturation, defined by a strategic shift from providing supplemental capacity to delivering high-fidelity scientific expertise. This evolution is driven by the increasing complexity of drug candidates, including cell and gene therapies, and the biopharmaceutical industry's imperative to mitigate early-stage clinical failures.
  • Key services like preclinical safety assessment, drug metabolism and pharmacokinetics (dmpk), and integrated drug discovery are now table stakes. A pivotal business scenario involves leveraging predictive toxicology platforms early in the discovery phase.
  • By using computational toxicology and in vitro toxicology assays, sponsors can de-risk compound libraries with greater precision, preventing the allocation of substantial R&D capital to candidates destined to fail in later IND-enabling studies.
  • This data-driven approach, which integrates everything from high-throughput screening (hts) to advanced patient-derived xenograft (pdx) models, transforms the Preclinical CRO from a service vendor into a strategic partner. These organizations provide the essential validation framework required to transition promising molecules from laboratory research to clinical investigation, ensuring adherence to stringent good laboratory practice (glp) standards.

What will be the Size of the Preclinical CRO Market during the forecast period?

Get Key Insights on Market Forecast (PDF) Request Free Sample

How is the Preclinical CRO Market Segmented?

The preclinical cro industry research report provides comprehensive data (region-wise segment analysis), with forecasts and estimates in "USD million" for the period 2026-2030, as well as historical data from 2020-2024 for the following segments.
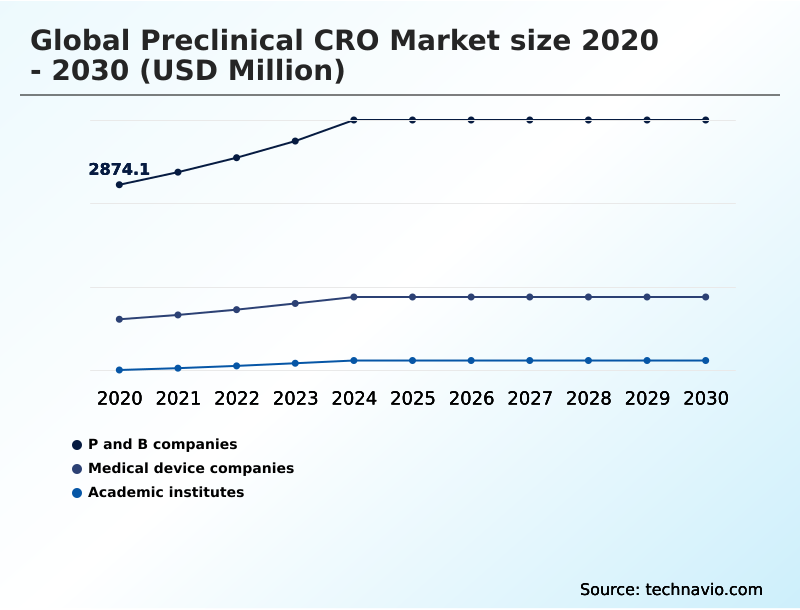
  • End-user
    • P and B companies
    • Medical device companies
    • Academic institutes
  • Service
    • Toxicology testing
    • Bioanalysis and DMPK studies
    • Compound management
    • Others
  • Application
    • Oncology
    • Neurology
    • Cardiology
    • Infectious diseases
    • Others
  • Geography
    • North America
      • US
      • Canada
      • Mexico
    • Europe
      • Germany
      • UK
      • France
    • Asia
    • Rest of World (ROW)

By End-user Insights

The p and b companies segment is estimated to witness significant growth during the forecast period.

The P and B companies segment represents the primary consumer of outsourced preclinical services, driven by the need to de-risk assets and accelerate development timelines for advanced therapy medicinal products (atmp).

These organizations increasingly partner with CROs for specialized expertise in drug metabolism and pharmacokinetics (dmpk), high-throughput screening (hts), and complex bioanalytical testing services. This strategic outsourcing allows internal teams to focus on core discovery and commercial strategy.

The reliance on external partners for absorption, distribution, metabolism, and excretion (adme) studies and the use of patient-derived xenograft (pdx) models is standard practice.

This collaborative model, which supports early-stage drug development support from large molecule bioanalysis to good laboratory practice (glp) compliance and regulatory submission support, underpins a significant portion of the market, with this segment constituting nearly 65% of activity.

Request Free Sample

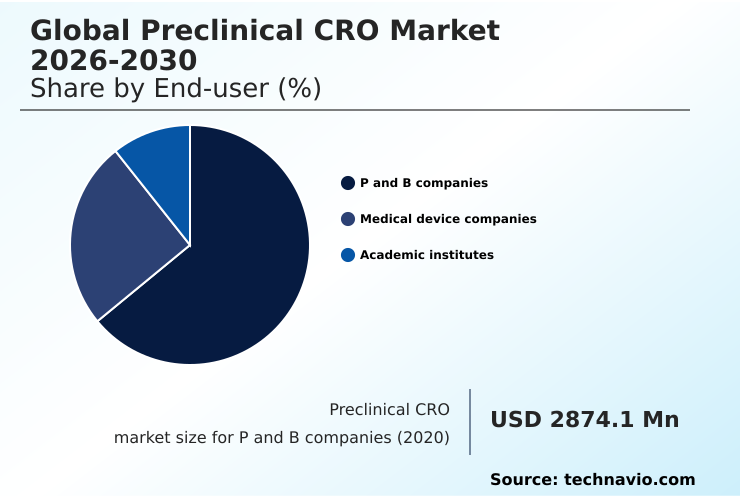
The P and B companies segment was valued at USD 3.71 billion in 2024 and showed a gradual increase during the forecast period.

Request Free Sample

Regional Analysis

North America is estimated to contribute 42.8% to the growth of the global market during the forecast period.Technavio’s analysts have elaborately explained the regional trends and drivers that shape the market during the forecast period.

See How Preclinical CRO Market Demand is Rising in North America Request Free Sample

The global geographic landscape is led by North America, which is projected to contribute over 42% of the market's incremental growth, fueled by a robust biotechnology ecosystem and high R&D spending.

This region shows strong demand for in vivo pharmacology and complex biologics testing, particularly for cell and gene therapy solutions and specialized oncology models.

Meanwhile, Asia is forecast to exhibit the highest regional growth rate at 8.7%, driven by expanding infrastructure and cost efficiencies in countries like China and India.

European markets remain critical for their expertise in immunogenicity testing and adherence to stringent regulatory standards.

Service providers are expanding their global footprint to offer harmonized preclinical cmc services and ex vivo analysis, leveraging preclinical imaging modalities to ensure data consistency across multi-regional trials, which is crucial for pharmacokinetic (pk) analysis and assessing pharmacodynamic (pd) biomarkers.

Market Dynamics

Our researchers analyzed the data with 2025 as the base year, along with the key drivers, trends, and challenges. A holistic analysis of drivers will help companies refine their marketing strategies to gain a competitive advantage.

  • Strategic decision-making in the biopharmaceutical sector is increasingly focused on optimizing the preclinical pathway. Selecting a preclinical CRO partner is no longer a simple procurement decision but a crucial strategic choice impacting long-term viability.
  • Companies evaluate partners based on their capabilities in specific areas, such as providing a preclinical CRO for cell and gene therapy or offering robust in vivo efficacy models for oncology. The demand for GLP toxicology testing for small molecules remains high, while non-GLP screening and discovery services offer flexibility for early-stage research.
  • A key consideration is the trade-off between traditional and new approach methodologies, where organ-on-a-chip vs animal models presents a compelling case for improved human relevance and cost savings. For instance, shifting from non-human primate model alternatives to patient-derived organoids in drug screening can reduce study costs by over 30% while mitigating ethical concerns.
  • This shift is particularly impactful for ADME profiling for biologic drug candidates and the safety assessment of novel biologics. Effective PK/PD modeling and simulation services and specialized bioanalytical services for large molecules are critical for achieving ind-enabling studies timeline reduction.
  • Firms must also address challenges in preclinical data reproducibility by investing in high-throughput toxicology screening methods and integrated preclinical to clinical services, ensuring a seamless transition for programs including preclinical research for orphan drugs.

What are the key market drivers leading to the rise in the adoption of Preclinical CRO Industry?

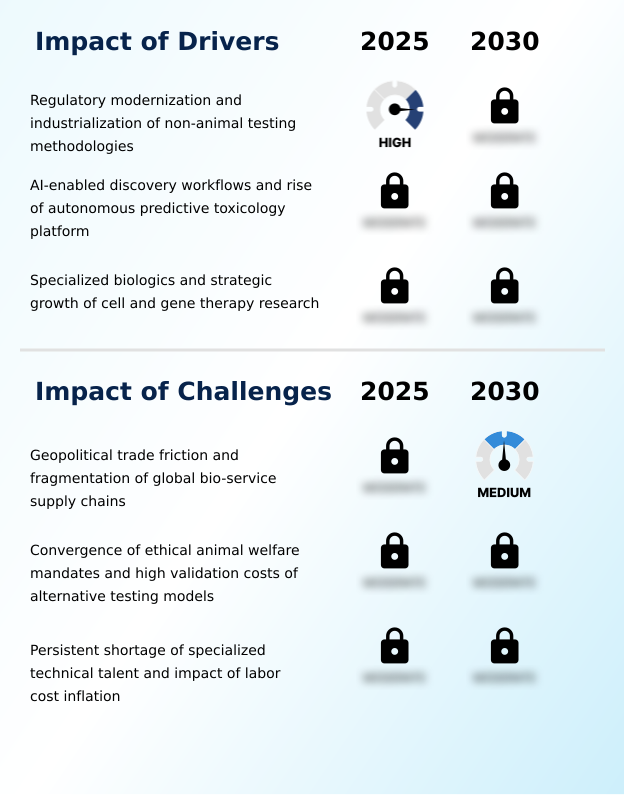
  • Regulatory modernization and the resulting industrialization of non-animal testing methodologies serve as a primary driver propelling market growth and technological innovation.

  • Regulatory modernization is a primary market driver, compelling the adoption of non-animal testing methodologies (nams). Legislative momentum is pushing drug developers to integrate sophisticated alternatives like organ-on-a-chip technology, human-relevant models, and bio-printed human tissues for preclinical safety assessment.
  • This transition toward human-centric microphysiological systems is supported by regulatory roadmaps for phasing out mandatory animal testing, which enhances the value of in vitro toxicology assays. Domestic investment in such non-invasive evaluation technologies is growing by nearly 8% annually.
  • This shift, which requires rigorous analytical method validation at GLP-certified laboratories, is instrumental in reducing the duration and ethical burden of investigational new drug (ind) enabling studies.
  • By focusing on target identification and validation with higher human relevance, these new approach methodologies serve as a cornerstone for technological leadership.

What are the market trends shaping the Preclinical CRO Industry?

  • The institutionalization of artificial intelligence and reinforcement learning is fundamentally reshaping early discovery workflows, compressing drug discovery timelines and enhancing predictive accuracy.

  • A fundamental market trend is the institutionalization of artificial intelligence (AI) to compress drug discovery timelines. The industry is moving toward closed-loop discovery systems where predictive toxicology platforms analyze massive datasets to forecast molecular success. This data-driven pharmacology, leveraging computational toxicology and high-fidelity computational simulations, enables the de novo molecule design of compounds with optimized profiles.
  • This shift has been shown to reduce the preclinical candidate development phase by more than 50% compared to traditional three-to-four-year cycles. Leading CROs are integrating generative AI for integrated drug discovery, transforming their role from service providers to strategic partners.
  • Through customized assay development and multi-omics data integration, these firms offer lead optimization services that maximize the return on R&D investment by enhancing the predictability of preclinical outcomes.

What challenges does the Preclinical CRO Industry face during its growth?

  • Geopolitical trade friction and the corresponding fragmentation of global bio-service supply chains represent a key challenge, introducing operational risks and cost inflation.

  • The market is navigating significant disruption from geopolitical trade tensions, which are fragmenting global supply chains for non-clinical development. This has created operational risks for firms reliant on overseas partners for services such as GLP-compliant toxicology studies and access to non-human primate (nhp) models.
  • The decoupling of research ecosystems has inflated cross-border collaboration costs by 15-20%, increasing competition for available laboratory capacity and contract vivarium services in Western markets. This environment complicates preclinical data management and forces sponsors to reconsider their functional service provider (fsp) models.
  • The administrative and capital-intensive task of reshoring activities like safety pharmacology and accessing rodent research models for translational research poses a primary hurdle, threatening to delay IND-enabling toxicology package timelines.

Exclusive Technavio Analysis on Customer Landscape

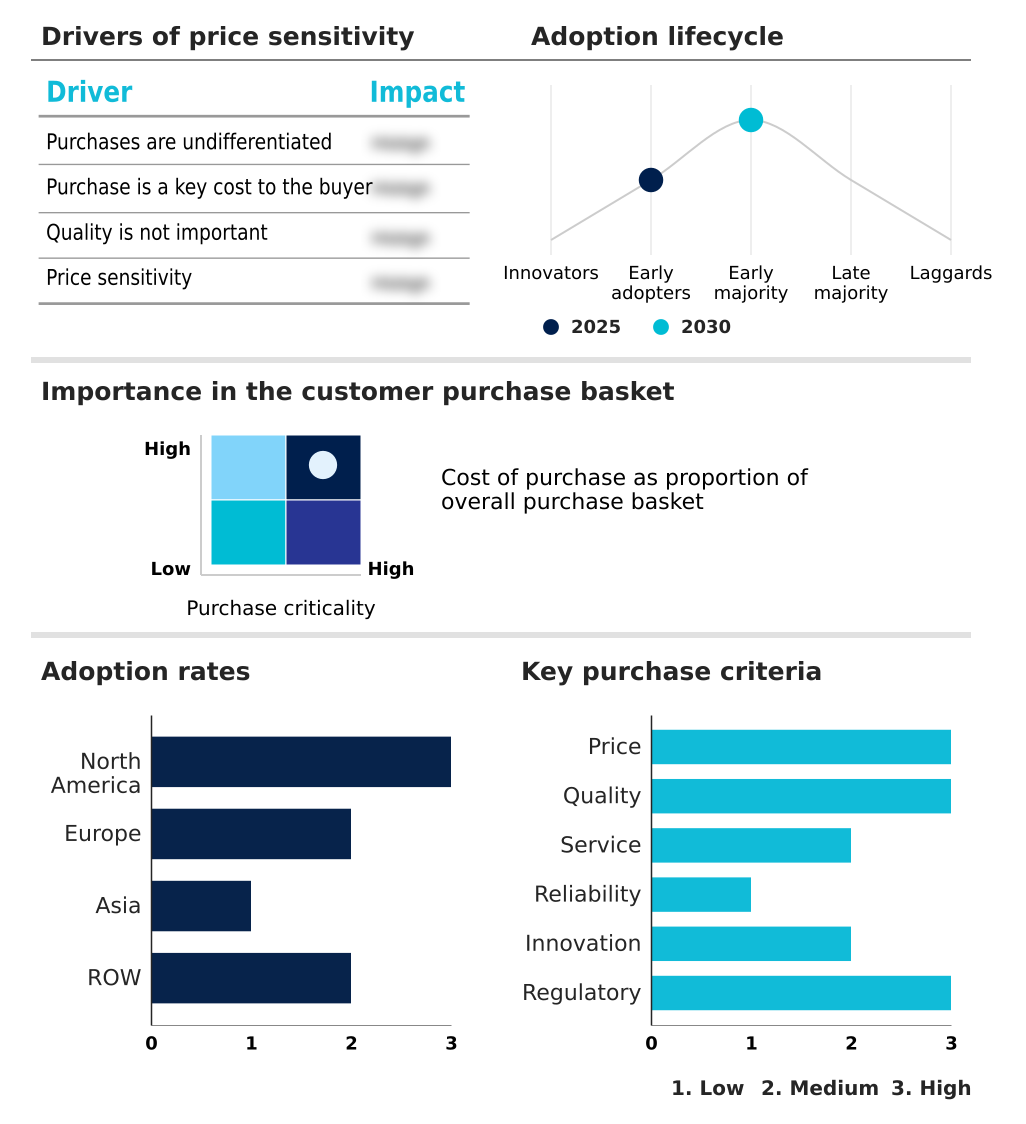
The preclinical cro market forecasting report includes the adoption lifecycle of the market, covering from the innovator’s stage to the laggard’s stage. It focuses on adoption rates in different regions based on penetration. Furthermore, the preclinical cro market report also includes key purchase criteria and drivers of price sensitivity to help companies evaluate and develop their market growth analysis strategies.

Customer Landscape of Preclinical CRO Industry

Competitive Landscape

Companies are implementing various strategies, such as strategic alliances, preclinical cro market forecast, partnerships, mergers and acquisitions, geographical expansion, and product/service launches, to enhance their presence in the industry.

Altasciences - Offerings are centered on delivering in vivo pharmacology, comprehensive toxicology studies, and advanced therapy development, with a specific focus on cell and gene therapy applications.

The industry research and growth report includes detailed analyses of the competitive landscape of the market and information about key companies, including:

  • Altasciences
  • AmplifyBio
  • BioEmission Technology Solutions
  • Charles River Laboratories
  • CYNBIOSE
  • Eurofins Scientific SE
  • Gempharmatech Co. Ltd.
  • Global Center for Medical Innovation
  • ICON plc
  • Imavita S.A.S.
  • IQVIA Holdings Inc.
  • JSR Corp.
  • Kunming Biomed International Ltd.
  • Laboratory Corp.
  • Medpace Holdings Inc.
  • Parexel International Corp.
  • Thermo Fisher Scientific Inc.
  • Veeda Clinical Research Ltd.
  • Vivotecnia
  • WuXi AppTec Co. Ltd.

Qualitative and quantitative analysis of companies has been conducted to help clients understand the wider business environment as well as the strengths and weaknesses of key industry players. Data is qualitatively analyzed to categorize companies as pure play, category-focused, industry-focused, and diversified; it is quantitatively analyzed to categorize companies as dominant, leading, strong, tentative, and weak.

Recent Development and News in Preclinical cro market

  • In April 2025, the US Food and Drug Administration released its finalized roadmap outlining the comprehensive phasing out of mandatory animal testing for monoclonal antibodies, signaling a major shift in nonclinical safety assessment protocols.
  • In January 2025, a leading contract research organization announced the launch of a new generative AI platform designed to accelerate de novo molecule design, reportedly reducing initial screening timelines by up to 40% for certain compound classes.
  • In November 2024, a specialized toxicology CRO announced the successful validation of its new organ-on-a-chip platform for cardiotoxicity screening, offering a qualified, human-relevant alternative to traditional animal models for regulatory submissions.
  • In September 2024, a major biopharma services company completed its acquisition of a niche provider of patient-derived xenograft (PDX) models, significantly expanding its specialized oncology research capabilities for immuno-oncology studies.

Dive into Technavio’s robust research methodology, blending expert interviews, extensive data synthesis, and validated models for unparalleled Preclinical CRO Market insights. See full methodology.

Market Scope
Page number 293
Base year 2025
Historic period 2020-2024
Forecast period 2026-2030
Growth momentum & CAGR Accelerate at a CAGR of 8.3%
Market growth 2026-2030 USD 3023.4 million
Market structure Fragmented
YoY growth 2025-2026(%) 7.8%
Key countries US, Canada, Mexico, Germany, UK, France, Italy, Spain, The Netherlands, China, India, Japan, South Korea, Indonesia, Thailand, Brazil, Saudi Arabia, UAE, Turkey, South Africa, Israel, Argentina and Colombia
Competitive landscape Leading Companies, Market Positioning of Companies, Competitive Strategies, and Industry Risks

Request Free Sample

Research Analyst Overview

  • The market is defined by a technology-driven evolution where high-fidelity computational simulations and closed-loop discovery systems are becoming standard. Boardroom-level strategy now directly connects R&D investment to the adoption of artificial intelligence in drug discovery for lead optimization services and de novo molecule design.
  • This integration facilitates a shift towards predictive, human-relevant models, utilizing technologies like organ-on-a-chip and bio-printed human tissues. The core service portfolio, encompassing preclinical safety assessment, drug metabolism and pharmacokinetics (dmpk), and investigational new drug (ind) enabling studies, is being revolutionized.
  • A focus on data from in vivo pharmacology, bioanalytical testing services, and high-throughput screening (hts) allows for a more robust non-clinical development process. Firms are leveraging translational research models, including patient-derived xenograft (pdx) and rodent research models, alongside advanced in vitro toxicology assays.
  • This data-centric approach has demonstrated the ability to shorten preclinical timelines to as little as thirteen months by optimizing studies like chronic toxicology testing, safety pharmacology, and immunogenicity testing, all conducted under stringent good laboratory practice (glp).

What are the Key Data Covered in this Preclinical CRO Market Research and Growth Report?

  • What is the expected growth of the Preclinical CRO Market between 2026 and 2030?

    • USD 3.02 billion, at a CAGR of 8.3%

  • What segmentation does the market report cover?

    • The report is segmented by End-user (P and B companies, Medical device companies, and Academic institutes), Service (Toxicology testing, Bioanalysis and DMPK studies, Compound management, and Others), Application (Oncology, Neurology, Cardiology, Infectious diseases, and Others) and Geography (North America, Europe, Asia, Rest of World (ROW))

  • Which regions are analyzed in the report?

    • North America, Europe, Asia and Rest of World (ROW)

  • What are the key growth drivers and market challenges?

    • Regulatory modernization and industrialization of non-animal testing methodologies, Geopolitical trade friction and fragmentation of global bio-service supply chains

  • Who are the major players in the Preclinical CRO Market?

    • Altasciences, AmplifyBio, BioEmission Technology Solutions, Charles River Laboratories, CYNBIOSE, Eurofins Scientific SE, Gempharmatech Co. Ltd., Global Center for Medical Innovation, ICON plc, Imavita S.A.S., IQVIA Holdings Inc., JSR Corp., Kunming Biomed International Ltd., Laboratory Corp., Medpace Holdings Inc., Parexel International Corp., Thermo Fisher Scientific Inc., Veeda Clinical Research Ltd., Vivotecnia and WuXi AppTec Co. Ltd.

Market Research Insights

  • Market dynamics are increasingly shaped by the dual pressures of innovation and efficiency. The adoption of predictive toxicology platforms and data-driven pharmacology enables a reduction in development timelines by over 50% compared to traditional methods. This acceleration is critical for sponsors seeking early-stage drug development support.
  • However, this progress is tempered by geopolitical headwinds that have inflated cross-border research collaboration costs by approximately 15-20%. As a result, firms are re-evaluating their reliance on certain functional service provider (fsp) models and seeking partners that offer robust scientific and regulatory consulting to navigate supply chain complexities.
  • The ability to provide customized assay development and integrated discovery and development services in a cost-effective, decentralized model is becoming a key differentiator for success.

We can help! Our analysts can customize this preclinical cro market research report to meet your requirements.

Get in touch

1. Executive Summary

1.1 Market overview

Executive Summary - Chart on Market Overview
Executive Summary - Data Table on Market Overview
Executive Summary - Chart on Global Market Characteristics
Executive Summary - Chart on Market by Geography
Executive Summary - Chart on Market Segmentation by End-user
Executive Summary - Chart on Market Segmentation by Service
Executive Summary - Chart on Market Segmentation by Application
Executive Summary - Chart on Incremental Growth
Executive Summary - Data Table on Incremental Growth
Executive Summary - Chart on Company Market Positioning

2. Technavio Analysis

2.1 Analysis of price sensitivity, lifecycle, customer purchase basket, adoption rates, and purchase criteria

2.2 Criticality of inputs and Factors of differentiation

Chart on Overview on criticality of inputs and factors of differentiation

2.3 Factors of disruption

Chart on Overview on factors of disruption

2.4 Impact of drivers and challenges

Chart on Impact of drivers and challenges in 2025 and 2030

3. Market Landscape

3.1 Market ecosystem

Chart on Parent Market
Data Table on - Parent Market

3.2 Market characteristics

Chart on Market characteristics analysis

3.3 Value chain analysis

Chart on Value chain analysis

4. Market Sizing

4.1 Market definition

Data Table on Offerings of companies included in the market definition

4.2 Market segment analysis

Market segments

4.3 Market size 2025

4.4 Market outlook: Forecast for 2025-2030

Chart on Global - Market size and forecast 2025-2030 ($ million)
Data Table on Global - Market size and forecast 2025-2030 ($ million)
Chart on Global Market: Year-over-year growth 2025-2030 (%)
Data Table on Global Market: Year-over-year growth 2025-2030 (%)

5. Historic Market Size

5.1 Global Preclinical CRO Market 2020 - 2024

Historic Market Size - Data Table on Global Preclinical CRO Market 2020 - 2024 ($ million)

5.2 End-user segment analysis 2020 - 2024

Historic Market Size - End-user Segment 2020 - 2024 ($ million)

5.3 Service segment analysis 2020 - 2024

Historic Market Size - Service Segment 2020 - 2024 ($ million)

5.4 Application segment analysis 2020 - 2024

Historic Market Size - Application Segment 2020 - 2024 ($ million)

5.5 Geography segment analysis 2020 - 2024

Historic Market Size - Geography Segment 2020 - 2024 ($ million)

5.6 Country segment analysis 2020 - 2024

Historic Market Size - Country Segment 2020 - 2024 ($ million)

6. Qualitative Analysis

6.1 Impact of AI in global preclinical CRO market

7. Five Forces Analysis

7.1 Five forces summary

Five forces analysis - Comparison between 2025 and 2030

7.2 Bargaining power of buyers

Bargaining power of buyers - Impact of key factors 2025 and 2030

7.3 Bargaining power of suppliers

Bargaining power of suppliers - Impact of key factors in 2025 and 2030

7.4 Threat of new entrants

Threat of new entrants - Impact of key factors in 2025 and 2030

7.5 Threat of substitutes

Threat of substitutes - Impact of key factors in 2025 and 2030

7.6 Threat of rivalry

Threat of rivalry - Impact of key factors in 2025 and 2030

7.7 Market condition

Chart on Market condition - Five forces 2025 and 2030

8. Market Segmentation by End-user

8.1 Market segments

Chart on End-user - Market share 2025-2030 (%)
Data Table on End-user - Market share 2025-2030 (%)

8.2 Comparison by End-user

Chart on Comparison by End-user
Data Table on Comparison by End-user

8.3 P and B companies - Market size and forecast 2025-2030

Chart on P and B companies - Market size and forecast 2025-2030 ($ million)
Data Table on P and B companies - Market size and forecast 2025-2030 ($ million)
Chart on P and B companies - Year-over-year growth 2025-2030 (%)
Data Table on P and B companies - Year-over-year growth 2025-2030 (%)

8.4 Medical device companies - Market size and forecast 2025-2030

Chart on Medical device companies - Market size and forecast 2025-2030 ($ million)
Data Table on Medical device companies - Market size and forecast 2025-2030 ($ million)
Chart on Medical device companies - Year-over-year growth 2025-2030 (%)
Data Table on Medical device companies - Year-over-year growth 2025-2030 (%)

8.5 Academic institutes - Market size and forecast 2025-2030

Chart on Academic institutes - Market size and forecast 2025-2030 ($ million)
Data Table on Academic institutes - Market size and forecast 2025-2030 ($ million)
Chart on Academic institutes - Year-over-year growth 2025-2030 (%)
Data Table on Academic institutes - Year-over-year growth 2025-2030 (%)

8.6 Market opportunity by End-user

Market opportunity by End-user ($ million)
Data Table on Market opportunity by End-user ($ million)

9. Market Segmentation by Service

9.1 Market segments

Chart on Service - Market share 2025-2030 (%)
Data Table on Service - Market share 2025-2030 (%)

9.2 Comparison by Service

Chart on Comparison by Service
Data Table on Comparison by Service

9.3 Toxicology testing - Market size and forecast 2025-2030

Chart on Toxicology testing - Market size and forecast 2025-2030 ($ million)
Data Table on Toxicology testing - Market size and forecast 2025-2030 ($ million)
Chart on Toxicology testing - Year-over-year growth 2025-2030 (%)
Data Table on Toxicology testing - Year-over-year growth 2025-2030 (%)

9.4 Bioanalysis and DMPK studies - Market size and forecast 2025-2030

Chart on Bioanalysis and DMPK studies - Market size and forecast 2025-2030 ($ million)
Data Table on Bioanalysis and DMPK studies - Market size and forecast 2025-2030 ($ million)
Chart on Bioanalysis and DMPK studies - Year-over-year growth 2025-2030 (%)
Data Table on Bioanalysis and DMPK studies - Year-over-year growth 2025-2030 (%)

9.5 Compound management - Market size and forecast 2025-2030

Chart on Compound management - Market size and forecast 2025-2030 ($ million)
Data Table on Compound management - Market size and forecast 2025-2030 ($ million)
Chart on Compound management - Year-over-year growth 2025-2030 (%)
Data Table on Compound management - Year-over-year growth 2025-2030 (%)

9.6 Others - Market size and forecast 2025-2030

Chart on Others - Market size and forecast 2025-2030 ($ million)
Data Table on Others - Market size and forecast 2025-2030 ($ million)
Chart on Others - Year-over-year growth 2025-2030 (%)
Data Table on Others - Year-over-year growth 2025-2030 (%)

9.7 Market opportunity by Service

Market opportunity by Service ($ million)
Data Table on Market opportunity by Service ($ million)

10. Market Segmentation by Application

10.1 Market segments

Chart on Application - Market share 2025-2030 (%)
Data Table on Application - Market share 2025-2030 (%)

10.2 Comparison by Application

Chart on Comparison by Application
Data Table on Comparison by Application

10.3 Oncology - Market size and forecast 2025-2030

Chart on Oncology - Market size and forecast 2025-2030 ($ million)
Data Table on Oncology - Market size and forecast 2025-2030 ($ million)
Chart on Oncology - Year-over-year growth 2025-2030 (%)
Data Table on Oncology - Year-over-year growth 2025-2030 (%)

10.4 Neurology - Market size and forecast 2025-2030

Chart on Neurology - Market size and forecast 2025-2030 ($ million)
Data Table on Neurology - Market size and forecast 2025-2030 ($ million)
Chart on Neurology - Year-over-year growth 2025-2030 (%)
Data Table on Neurology - Year-over-year growth 2025-2030 (%)

10.5 Cardiology - Market size and forecast 2025-2030

Chart on Cardiology - Market size and forecast 2025-2030 ($ million)
Data Table on Cardiology - Market size and forecast 2025-2030 ($ million)
Chart on Cardiology - Year-over-year growth 2025-2030 (%)
Data Table on Cardiology - Year-over-year growth 2025-2030 (%)

10.6 Infectious diseases - Market size and forecast 2025-2030

Chart on Infectious diseases - Market size and forecast 2025-2030 ($ million)
Data Table on Infectious diseases - Market size and forecast 2025-2030 ($ million)
Chart on Infectious diseases - Year-over-year growth 2025-2030 (%)
Data Table on Infectious diseases - Year-over-year growth 2025-2030 (%)

10.7 Others - Market size and forecast 2025-2030

Chart on Others - Market size and forecast 2025-2030 ($ million)
Data Table on Others - Market size and forecast 2025-2030 ($ million)
Chart on Others - Year-over-year growth 2025-2030 (%)
Data Table on Others - Year-over-year growth 2025-2030 (%)

10.8 Market opportunity by Application

Market opportunity by Application ($ million)
Data Table on Market opportunity by Application ($ million)

11. Customer Landscape

11.1 Customer landscape overview

Analysis of price sensitivity, lifecycle, customer purchase basket, adoption rates, and purchase criteria

12. Geographic Landscape

12.1 Geographic segmentation

Chart on Market share by geography 2025-2030 (%)
Data Table on Market share by geography 2025-2030 (%)

12.2 Geographic comparison

Chart on Geographic comparison
Data Table on Geographic comparison

12.3 North America - Market size and forecast 2025-2030

Chart on North America - Market size and forecast 2025-2030 ($ million)
Data Table on North America - Market size and forecast 2025-2030 ($ million)
Chart on North America - Year-over-year growth 2025-2030 (%)
Data Table on North America - Year-over-year growth 2025-2030 (%)
Chart on Regional Comparison - North America
Data Table on Regional Comparison - North America

12.3.1 US - Market size and forecast 2025-2030

Chart on US - Market size and forecast 2025-2030 ($ million)
Data Table on US - Market size and forecast 2025-2030 ($ million)
Chart on US - Year-over-year growth 2025-2030 (%)
Data Table on US - Year-over-year growth 2025-2030 (%)

12.3.2 Canada - Market size and forecast 2025-2030

Chart on Canada - Market size and forecast 2025-2030 ($ million)
Data Table on Canada - Market size and forecast 2025-2030 ($ million)
Chart on Canada - Year-over-year growth 2025-2030 (%)
Data Table on Canada - Year-over-year growth 2025-2030 (%)

12.3.3 Mexico - Market size and forecast 2025-2030

Chart on Mexico - Market size and forecast 2025-2030 ($ million)
Data Table on Mexico - Market size and forecast 2025-2030 ($ million)
Chart on Mexico - Year-over-year growth 2025-2030 (%)
Data Table on Mexico - Year-over-year growth 2025-2030 (%)

12.4 Europe - Market size and forecast 2025-2030

Chart on Europe - Market size and forecast 2025-2030 ($ million)
Data Table on Europe - Market size and forecast 2025-2030 ($ million)
Chart on Europe - Year-over-year growth 2025-2030 (%)
Data Table on Europe - Year-over-year growth 2025-2030 (%)
Chart on Regional Comparison - Europe
Data Table on Regional Comparison - Europe

12.4.1 Germany - Market size and forecast 2025-2030

Chart on Germany - Market size and forecast 2025-2030 ($ million)
Data Table on Germany - Market size and forecast 2025-2030 ($ million)
Chart on Germany - Year-over-year growth 2025-2030 (%)
Data Table on Germany - Year-over-year growth 2025-2030 (%)

12.4.2 UK - Market size and forecast 2025-2030

Chart on UK - Market size and forecast 2025-2030 ($ million)
Data Table on UK - Market size and forecast 2025-2030 ($ million)
Chart on UK - Year-over-year growth 2025-2030 (%)
Data Table on UK - Year-over-year growth 2025-2030 (%)

12.4.3 France - Market size and forecast 2025-2030

Chart on France - Market size and forecast 2025-2030 ($ million)
Data Table on France - Market size and forecast 2025-2030 ($ million)
Chart on France - Year-over-year growth 2025-2030 (%)
Data Table on France - Year-over-year growth 2025-2030 (%)

12.4.4 Italy - Market size and forecast 2025-2030

Chart on Italy - Market size and forecast 2025-2030 ($ million)
Data Table on Italy - Market size and forecast 2025-2030 ($ million)
Chart on Italy - Year-over-year growth 2025-2030 (%)
Data Table on Italy - Year-over-year growth 2025-2030 (%)

12.4.5 Spain - Market size and forecast 2025-2030

Chart on Spain - Market size and forecast 2025-2030 ($ million)
Data Table on Spain - Market size and forecast 2025-2030 ($ million)
Chart on Spain - Year-over-year growth 2025-2030 (%)
Data Table on Spain - Year-over-year growth 2025-2030 (%)

12.4.6 The Netherlands - Market size and forecast 2025-2030

Chart on The Netherlands - Market size and forecast 2025-2030 ($ million)
Data Table on The Netherlands - Market size and forecast 2025-2030 ($ million)
Chart on The Netherlands - Year-over-year growth 2025-2030 (%)
Data Table on The Netherlands - Year-over-year growth 2025-2030 (%)

12.5 Asia - Market size and forecast 2025-2030

Chart on Asia - Market size and forecast 2025-2030 ($ million)
Data Table on Asia - Market size and forecast 2025-2030 ($ million)
Chart on Asia - Year-over-year growth 2025-2030 (%)
Data Table on Asia - Year-over-year growth 2025-2030 (%)
Chart on Regional Comparison - Asia
Data Table on Regional Comparison - Asia

12.5.1 China - Market size and forecast 2025-2030

Chart on China - Market size and forecast 2025-2030 ($ million)
Data Table on China - Market size and forecast 2025-2030 ($ million)
Chart on China - Year-over-year growth 2025-2030 (%)
Data Table on China - Year-over-year growth 2025-2030 (%)

12.5.2 India - Market size and forecast 2025-2030

Chart on India - Market size and forecast 2025-2030 ($ million)
Data Table on India - Market size and forecast 2025-2030 ($ million)
Chart on India - Year-over-year growth 2025-2030 (%)
Data Table on India - Year-over-year growth 2025-2030 (%)

12.5.3 Japan - Market size and forecast 2025-2030

Chart on Japan - Market size and forecast 2025-2030 ($ million)
Data Table on Japan - Market size and forecast 2025-2030 ($ million)
Chart on Japan - Year-over-year growth 2025-2030 (%)
Data Table on Japan - Year-over-year growth 2025-2030 (%)

12.5.4 South Korea - Market size and forecast 2025-2030

Chart on South Korea - Market size and forecast 2025-2030 ($ million)
Data Table on South Korea - Market size and forecast 2025-2030 ($ million)
Chart on South Korea - Year-over-year growth 2025-2030 (%)
Data Table on South Korea - Year-over-year growth 2025-2030 (%)

12.5.5 Indonesia - Market size and forecast 2025-2030

Chart on Indonesia - Market size and forecast 2025-2030 ($ million)
Data Table on Indonesia - Market size and forecast 2025-2030 ($ million)
Chart on Indonesia - Year-over-year growth 2025-2030 (%)
Data Table on Indonesia - Year-over-year growth 2025-2030 (%)

12.5.6 Thailand - Market size and forecast 2025-2030

Chart on Thailand - Market size and forecast 2025-2030 ($ million)
Data Table on Thailand - Market size and forecast 2025-2030 ($ million)
Chart on Thailand - Year-over-year growth 2025-2030 (%)
Data Table on Thailand - Year-over-year growth 2025-2030 (%)

12.6 Rest of World (ROW) - Market size and forecast 2025-2030

Chart on Rest of World (ROW) - Market size and forecast 2025-2030 ($ million)
Data Table on Rest of World (ROW) - Market size and forecast 2025-2030 ($ million)
Chart on Rest of World (ROW) - Year-over-year growth 2025-2030 (%)
Data Table on Rest of World (ROW) - Year-over-year growth 2025-2030 (%)
Chart on Regional Comparison - Rest of World (ROW)
Data Table on Regional Comparison - Rest of World (ROW)

12.6.1 Brazil - Market size and forecast 2025-2030

Chart on Brazil - Market size and forecast 2025-2030 ($ million)
Data Table on Brazil - Market size and forecast 2025-2030 ($ million)
Chart on Brazil - Year-over-year growth 2025-2030 (%)
Data Table on Brazil - Year-over-year growth 2025-2030 (%)

12.6.2 Saudi Arabia - Market size and forecast 2025-2030

Chart on Saudi Arabia - Market size and forecast 2025-2030 ($ million)
Data Table on Saudi Arabia - Market size and forecast 2025-2030 ($ million)
Chart on Saudi Arabia - Year-over-year growth 2025-2030 (%)
Data Table on Saudi Arabia - Year-over-year growth 2025-2030 (%)

12.6.3 UAE - Market size and forecast 2025-2030

Chart on UAE - Market size and forecast 2025-2030 ($ million)
Data Table on UAE - Market size and forecast 2025-2030 ($ million)
Chart on UAE - Year-over-year growth 2025-2030 (%)
Data Table on UAE - Year-over-year growth 2025-2030 (%)

12.6.4 Turkey - Market size and forecast 2025-2030

Chart on Turkey - Market size and forecast 2025-2030 ($ million)
Data Table on Turkey - Market size and forecast 2025-2030 ($ million)
Chart on Turkey - Year-over-year growth 2025-2030 (%)
Data Table on Turkey - Year-over-year growth 2025-2030 (%)

12.6.5 South Africa - Market size and forecast 2025-2030

Chart on South Africa - Market size and forecast 2025-2030 ($ million)
Data Table on South Africa - Market size and forecast 2025-2030 ($ million)
Chart on South Africa - Year-over-year growth 2025-2030 (%)
Data Table on South Africa - Year-over-year growth 2025-2030 (%)

12.6.6 Israel - Market size and forecast 2025-2030

Chart on Israel - Market size and forecast 2025-2030 ($ million)
Data Table on Israel - Market size and forecast 2025-2030 ($ million)
Chart on Israel - Year-over-year growth 2025-2030 (%)
Data Table on Israel - Year-over-year growth 2025-2030 (%)

12.6.7 Argentina - Market size and forecast 2025-2030

Chart on Argentina - Market size and forecast 2025-2030 ($ million)
Data Table on Argentina - Market size and forecast 2025-2030 ($ million)
Chart on Argentina - Year-over-year growth 2025-2030 (%)
Data Table on Argentina - Year-over-year growth 2025-2030 (%)

12.6.8 Colombia - Market size and forecast 2025-2030

Chart on Colombia - Market size and forecast 2025-2030 ($ million)
Data Table on Colombia - Market size and forecast 2025-2030 ($ million)
Chart on Colombia - Year-over-year growth 2025-2030 (%)
Data Table on Colombia - Year-over-year growth 2025-2030 (%)

12.7 Market opportunity by geography

Market opportunity by geography ($ million)
Data Tables on Market opportunity by geography ($ million)

13. Drivers, Challenges, and Opportunity

13.1 Market drivers

Regulatory modernization and industrialization of non-animal testing methodologies
AI-enabled discovery workflows and rise of autonomous predictive toxicology platform
Specialized biologics and strategic growth of cell and gene therapy research

13.2 Market challenges

Geopolitical trade friction and fragmentation of global bio-service supply chains
Convergence of ethical animal welfare mandates and high validation costs of alternative testing models
Persistent shortage of specialized technical talent and impact of labor cost inflation

13.3 Impact of drivers and challenges

Impact of drivers and challenges in 2025 and 2030

13.4 Market opportunities

AI and reinforcement learning in early discovery workflows
Human-centric microphysiological systems and organ-on-a-chip technology
Strategic expansion of integrated multi-omics services and specialized oncology models

14. Competitive Landscape

14.1 Overview

14.2

Overview on criticality of inputs and factors of differentiation

14.3 Landscape disruption

Overview on factors of disruption

14.4 Industry risks

Impact of key risks on business

15. Competitive Analysis

15.1 Companies profiled

Companies covered

15.2 Company ranking index

15.3 Market positioning of companies

Matrix on companies position and classification

15.4 Altasciences

Altasciences - Overview
Altasciences - Product / Service
Altasciences - Key offerings
SWOT

15.5 AmplifyBio

AmplifyBio - Overview
AmplifyBio - Product / Service
AmplifyBio - Key offerings
SWOT

15.6 BioEmission Technology Solutions

BioEmission Technology Solutions - Overview
BioEmission Technology Solutions - Product / Service
BioEmission Technology Solutions - Key offerings
SWOT

15.7 Charles River Laboratories

Charles River Laboratories - Overview
Charles River Laboratories - Business segments
Charles River Laboratories - Key offerings
Charles River Laboratories - Segment focus
SWOT

15.8 CYNBIOSE

CYNBIOSE - Overview
CYNBIOSE - Product / Service
CYNBIOSE - Key offerings
SWOT

15.9 Eurofins Scientific SE

Eurofins Scientific SE - Overview
Eurofins Scientific SE - Business segments
Eurofins Scientific SE - Key offerings
Eurofins Scientific SE - Segment focus
SWOT

15.10 Gempharmatech Co. Ltd.

Gempharmatech Co. Ltd. - Overview
Gempharmatech Co. Ltd. - Product / Service
Gempharmatech Co. Ltd. - Key offerings
SWOT

15.11 Global Center for Medical Innovation

Global Center for Medical Innovation - Overview
Global Center for Medical Innovation - Product / Service
Global Center for Medical Innovation - Key offerings
SWOT

15.12 ICON plc

ICON plc - Overview
ICON plc - Product / Service
ICON plc - Key offerings
SWOT

15.13 Imavita S.A.S.

Imavita S.A.S. - Overview
Imavita S.A.S. - Product / Service
Imavita S.A.S. - Key offerings
SWOT

15.14 IQVIA Holdings Inc.

IQVIA Holdings Inc. - Overview
IQVIA Holdings Inc. - Business segments
IQVIA Holdings Inc. - Key offerings
IQVIA Holdings Inc. - Segment focus
SWOT

15.15 JSR Corp.

JSR Corp. - Overview
JSR Corp. - Business segments
JSR Corp. - Key offerings
JSR Corp. - Segment focus
SWOT

15.16 Kunming Biomed International Ltd.

Kunming Biomed International Ltd. - Overview
Kunming Biomed International Ltd. - Product / Service
Kunming Biomed International Ltd. - Key offerings
SWOT

15.17 Laboratory Corp.

Laboratory Corp. - Overview
Laboratory Corp. - Business segments
Laboratory Corp. - Key news
Laboratory Corp. - Key offerings
Laboratory Corp. - Segment focus
SWOT

15.18 Medpace Holdings Inc.

Medpace Holdings Inc. - Overview
Medpace Holdings Inc. - Product / Service
Medpace Holdings Inc. - Key offerings
SWOT

16. Appendix

16.1 Scope of the report

Market definition
Objectives
Notes and caveats

16.2 Inclusions and exclusions checklist

Inclusions checklist
Exclusions checklist

16.3 Currency conversion rates for US$

16.4 Research methodology

16.5 Data procurement

Information sources

16.6 Data validation

16.7 Validation techniques employed for market sizing

16.8 Data synthesis

16.9 360 degree market analysis

16.10 List of abbreviations

Research Methodology

Technavio presents a detailed picture of the market by way of study, synthesis, and summation of data from multiple sources. The analysts have presented the various facets of the market with a particular focus on identifying the key industry influencers. The data thus presented is comprehensive, reliable, and the result of extensive research, both primary and secondary.

INFORMATION SOURCES

Primary sources

  • Manufacturers and suppliers
  • Channel partners
  • Industry experts
  • Strategic decision makers

Secondary sources

  • Industry journals and periodicals
  • Government data
  • Financial reports of key industry players
  • Historical data
  • Press releases

DATA ANALYSIS

Data Synthesis

  • Collation of data
  • Estimation of key figures
  • Analysis of derived insights

Data Validation

  • Triangulation with data models
  • Reference against proprietary databases
  • Corroboration with industry experts

REPORT WRITING

Qualitative

  • Market drivers
  • Market challenges
  • Market trends
  • Five forces analysis

Quantitative

  • Market size and forecast
  • Market segmentation
  • Geographical insights
  • Competitive landscape

Interested in this report?

Get your sample now to see our research methodology and insights!

Download Now

Frequently Asked Questions

Preclinical CRO market growth will increase by USD 3023.4 million during 2026-2030.

The Preclinical CRO market is expected to grow at a CAGR of 8.3% during 2026-2030.

Preclinical CRO market is segmented by End-user (P and B companies, Medical device companies, Academic institutes) Service (Toxicology testing, Bioanalysis and DMPK studies, Compound management, Others) Application (Oncology, Neurology, Cardiology, Infectious diseases, Others)

Altasciences, AmplifyBio, BioEmission Technology Solutions, Charles River Laboratories, CYNBIOSE, Eurofins Scientific SE, Gempharmatech Co. Ltd., Global Center for Medical Innovation, ICON plc, Imavita S.A.S., IQVIA Holdings Inc., JSR Corp., Kunming Biomed International Ltd., Laboratory Corp., Medpace Holdings Inc., Parexel International Corp., Thermo Fisher Scientific Inc., Veeda Clinical Research Ltd., Vivotecnia, WuXi AppTec Co. Ltd. are a few of the key vendors in the Preclinical CRO market.

North America will register the highest growth rate of 42.8% among the other regions. Therefore, the Preclinical CRO market in North America is expected to garner significant business opportunities for the vendors during the forecast period.

US, Canada, Mexico, Germany, UK, France, Italy, Spain, The Netherlands, China, India, Japan, South Korea, Indonesia, Thailand, Brazil, Saudi Arabia, UAE, Turkey, South Africa, Israel, Argentina, Colombia

  • Regulatory modernization and industrialization of non-animal testing methodologies is the driving factor this market.

The Preclinical CRO market vendors should focus on grabbing business opportunities from the End-user segment as it accounted for the largest market share in the base year.
RIA - Research AI Assistant
Ask RIA