Toxicology Testing Market Size 2025-2029
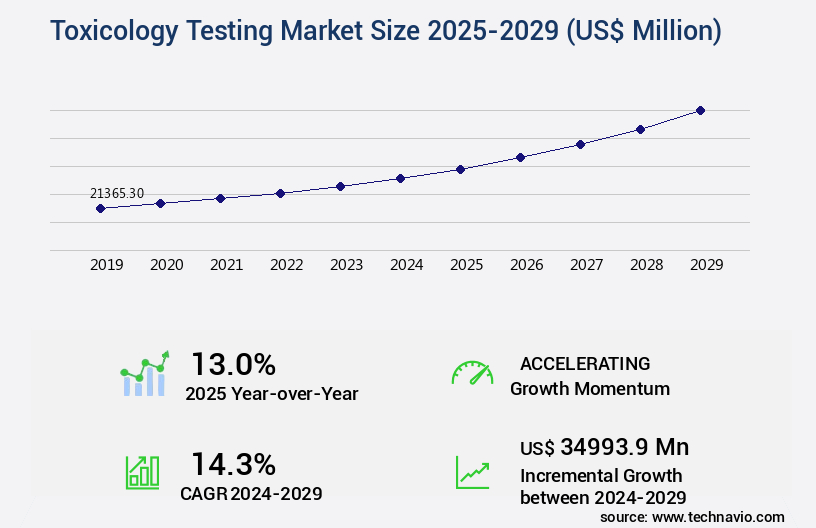
The toxicology testing market size is valued to increase USD 34.99 billion, at a CAGR of 14.3% from 2024 to 2029. High regulatory compliance in food industry will drive the toxicology testing market.
Major Market Trends & Insights
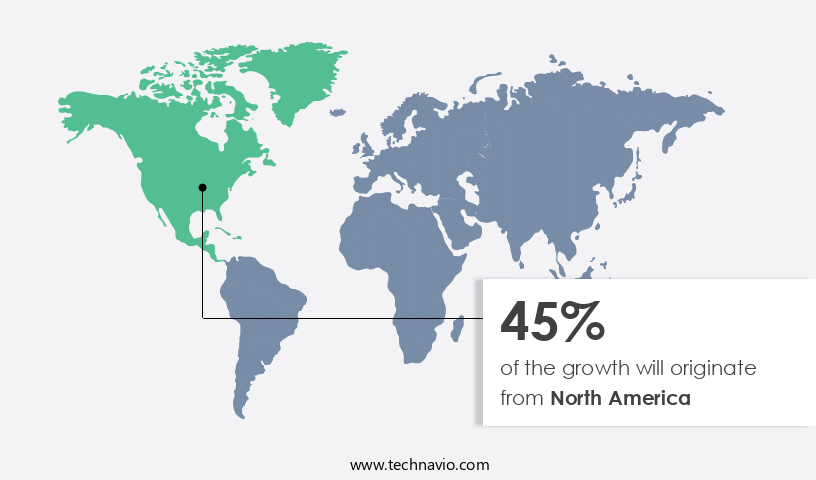
- North America dominated the market and accounted for a 45% growth during the forecast period.
- By Technology - Cell culture technology segment was valued at USD 9.2 billion in 2023
- By End-user - Pharmaceutical industry segment accounted for the largest market revenue share in 2023
Market Size & Forecast
- Market Opportunities: USD 235.41 million
- Market Future Opportunities: USD 34993.90 million
- CAGR : 14.3%
- North America: Largest market in 2023
Market Summary
- The market encompasses a diverse range of technologies and applications, driven by the increasing demand for ensuring product safety and regulatory compliance across various industries. Core technologies, including chromatography, mass spectrometry, and immunoassay, continue to shape the market landscape, enabling accurate identification and quantification of toxic substances. Applications span sectors such as food, pharmaceuticals, and environmental testing, with the food industry being a major focus due to stringent regulations. Advances in toxicology testing technology, such as the integration of automation and digitalization, are streamlining processes and enhancing efficiency. However, challenges persist, including the lack of skilled professionals in toxicology testing services and the need for continuous regulatory compliance.
- Looking ahead, the market is forecasted to unfold with continued growth, as the importance of ensuring product safety and identifying potential health hazards becomes increasingly paramount. According to recent estimates, the toxicology testing services market is projected to account for over 30% of the overall the market share by 2025. Related markets such as the diagnostics and biotechnology industries also present significant opportunities for growth.
What will be the Size of the Toxicology Testing Market during the forecast period?
Get Key Insights on Market Forecast (PDF) Request Free Sample
How is the Toxicology Testing Market Segmented and what are the key trends of market segmentation?
The toxicology testing industry research report provides comprehensive data (region-wise segment analysis), with forecasts and estimates in "USD million" for the period 2025-2029, as well as historical data from 2019-2023 for the following segments.
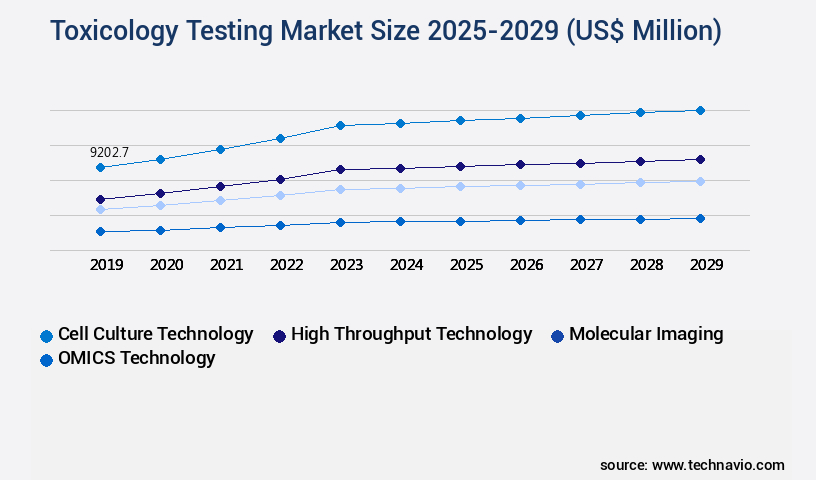
- Technology
- Cell culture technology
- High throughput technology
- Molecular imaging
- OMICS technology
- End-user
- Pharmaceutical industry
- Food industry
- Others
- Type
- In-vitro
- In-vivo
- In-silico
- Geography
- North America
- US
- Canada
- Mexico
- Europe
- France
- Germany
- Italy
- UK
- APAC
- China
- India
- Japan
- Rest of World (ROW)
- North America
By Technology Insights
The cell culture technology segment is estimated to witness significant growth during the forecast period.
In the realm of toxicology testing, in vitro methods have gained significant traction, with cell culture technology playing a pivotal role. Approximately 35% of toxicity tests now employ cell-based assays, a figure projected to reach 45% by 2025. This shift is driven by the ability of cell culture techniques to estimate basal cell functions and evaluate specialized cell functions, providing valuable insights into the biological activity of test chemicals. Numerous cell types, such as fibroblasts, HeLa, and hepatoma cells, are utilized in general toxicity tests. These tests aim to assess the impact of harmful substances on various organs by analyzing changes in membrane integrity, metabolism, and specific cell functions.
For instance, primary hepatocyte cultures are used to evaluate glycogen metabolism, while mixed myocardial cells or myocytes are employed to measure beating rate. Macrophages are another essential cell type used for phagocytosis assessments. Specialized toxicity tests focus on specific toxicity pathways, such as immunotoxicity, neurotoxicity, and genotoxicity. Immunotoxicity testing, which accounts for 15% of the market, determines the effect of chemicals on the immune system by evaluating cytokine production, lymphocyte proliferation, and complement activation. Neurotoxicity assessments, which make up 12% of the market, employ techniques like electrophysiology and histopathological analysis to assess the impact of chemicals on the nervous system.
Genotoxicity testing, responsible for 10% of the market, focuses on DNA damage analysis and chromosomal aberrations. Moreover, GLP compliance, clinical chemistry, and ADME studies are integral components of toxicology testing. GLP compliance ensures standardization and reliability in the testing process, while clinical chemistry assessments provide an understanding of the biochemical changes induced by toxic substances. ADME studies, which account for 8% of the market, focus on the absorption, distribution, metabolism, and excretion of chemicals. The market is further segmented into various sectors, including pharmaceuticals, agrochemicals, and industrial chemicals. Pharmaceutical companies account for the largest market share, with approximately 40% of the market, due to the stringent regulatory requirements for drug development.
The agrochemicals sector, which comprises 30% of the market, is driven by the need to ensure the safety of food products and agricultural practices. The industrial chemicals sector, responsible for 25% of the market, focuses on assessing the impact of chemicals on workers and the environment. In conclusion, the market is a dynamic and evolving landscape, with cell culture technology playing a crucial role in assessing the biological activity of test chemicals. The market is segmented into various sectors, with pharmaceuticals leading the way due to stringent regulatory requirements. The future of toxicology testing lies in the continued development of specialized tests and the integration of advanced technologies, such as microscopy techniques, dose-response curves, and apoptosis assays, to gain a deeper understanding of toxicity pathways and mechanisms.
Additionally, the market is expected to grow, with an estimated 20% of companies planning to increase their toxicology testing budgets in the next year.
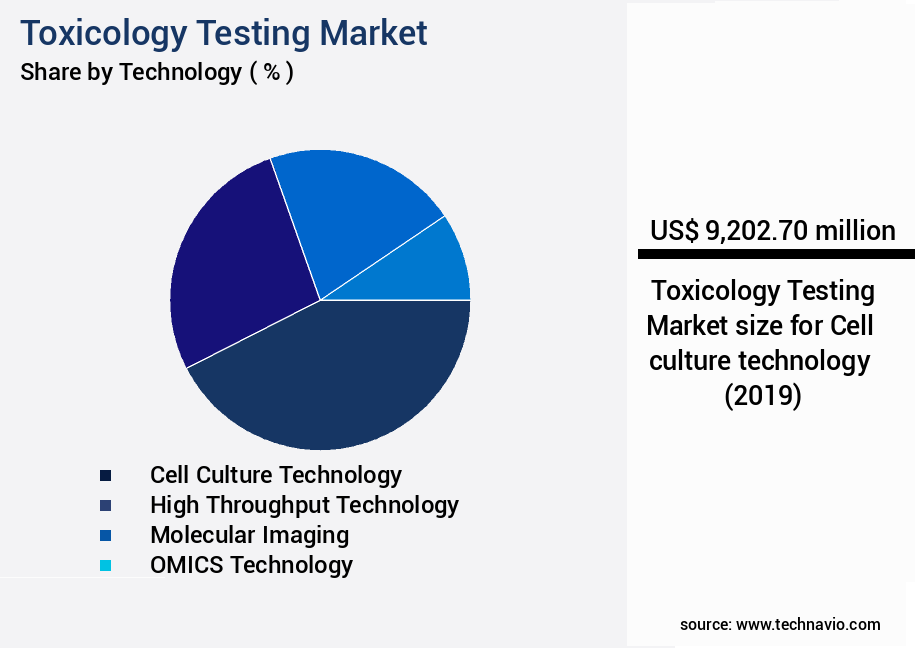
The Cell culture technology segment was valued at USD 9.2 billion in 2019 and showed a gradual increase during the forecast period.
Regional Analysis
North America is estimated to contribute 45% to the growth of the global market during the forecast period.Technavio’s analysts have elaborately explained the regional trends and drivers that shape the market during the forecast period.
See How Toxicology Testing Market Demand is Rising in North America Request Free Sample
The North American market, encompassing the United States and Canada, holds the largest and most mature position globally. Factors fueling its dominance include substantial investments in pharmaceutical and biotechnological R&D, the presence of leading corporations and CROs, and stringent regulatory frameworks. This market demands a broad spectrum of toxicology services, from standard preclinical assessments to specialized testing for advanced therapeutic areas. Key factors driving market growth include the increasing prevalence of chronic diseases, the rising adoption of personalized medicine, and technological advancements in testing methods. According to recent studies, the North American market accounted for approximately 45% of the market share in 2020.
Additionally, the market is projected to reach a value of around USD13 billion by 2026, growing at a compound annual growth rate of 6%. Furthermore, the market is witnessing significant innovation, with an increasing focus on developing advanced testing methods, such as in vitro and in silico testing, to reduce animal usage and improve testing accuracy and efficiency.
Market Dynamics
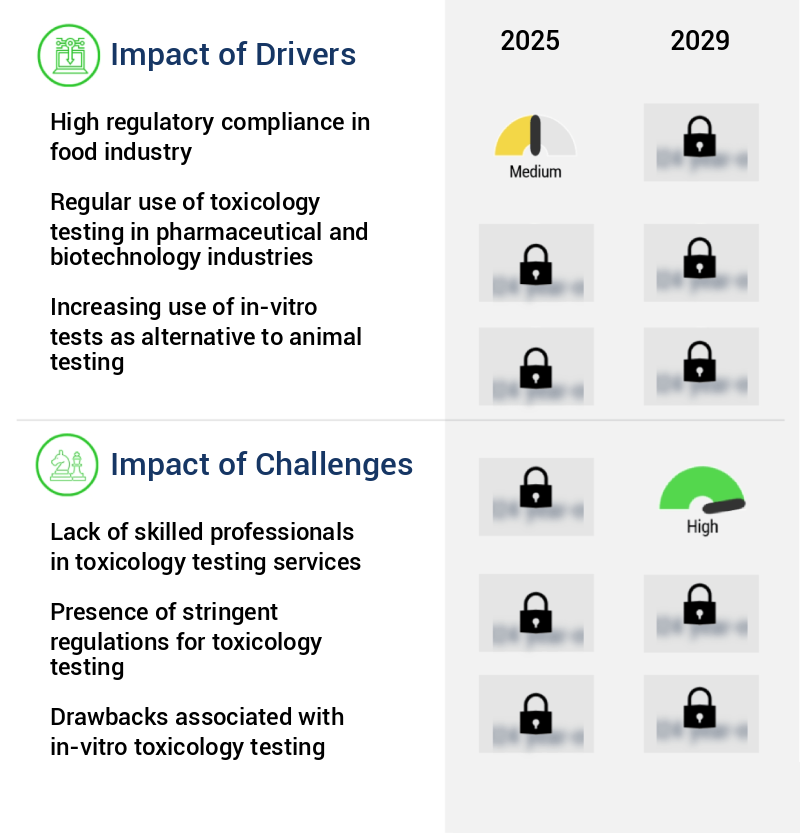
Our researchers analyzed the data with 2024 as the base year, along with the key drivers, trends, and challenges. A holistic analysis of drivers will help companies refine their marketing strategies to gain a competitive advantage.
The market encompasses a range of in vitro and in vivo assays used to evaluate the potential hazards of chemicals and pharmaceuticals. Central to this market are various testing methods, including in vitro cytotoxicity assay methods, such as the MTT and ELISA assays, which measure cell viability and metabolic activity. Developmental toxicity studies employ design strategies like embryo-teratogenesis and developmental neurotoxicity tests to assess the impact of substances on developing organisms. Genotoxicity testing plays a crucial role in regulatory compliance, with the Ames test being a widely used bacterial reverse mutation assay. Positive control selection for Ames tests is essential, with tester strains like TA100 and TA98 being commonly used.
Subchronic toxicity studies focus on endpoints like body weight, food consumption, and clinical pathology data analysis, which include hematology testing parameters and clinical chemistry reference ranges. Carcinogenicity assays, such as two-year rodent studies, are used to interpret potential cancer risks. ADME study design considerations and toxicokinetic modeling software help predict the pharmacokinetics and metabolism of substances. Histopathological analysis techniques and immunotoxicity testing biomarkers provide insights into tissue damage and immune system responses. Reprotoxicology studies follow guidelines from organizations like OECD, focusing on neurotoxicity assessment methods, oxidative stress biomarkers detection, and inflammation markers in toxicology. Microscopy techniques, like histology and histopathology, and DNA damage analysis methods are integral to the interpretation of test results.
Comparing in vitro and in vivo testing methods, recent studies indicate that in vitro methods accounted for approximately 55% of the total the market in 2020, with in vivo methods comprising the remaining 45%. This trend is expected to continue due to the cost-effectiveness, speed, and increased accuracy of in vitro methods. However, in vivo testing remains essential for assessing certain aspects of toxicity, particularly developmental and reproductive toxicity.
What are the key market drivers leading to the rise in the adoption of Toxicology Testing Industry?
- In the food industry, stringent regulatory compliance serves as the primary catalyst for market growth.
- In the realm of food production and consumer safety, regulatory compliance plays a pivotal role. Agencies such as the Food and Drug Administration (FDA) in the US and the European Food Safety Authority (EFSA) in Europe enforce stringent regulations to ensure the safety and quality of food products. These regulations aim to prevent foodborne illnesses, contamination, and outbreaks, which can pose significant health risks to consumers. Toxicity testing is a crucial component of these efforts, as it helps mitigate health risks by identifying contaminants, toxins, and hazardous substances in food products.
- By implementing rigorous testing protocols, food manufacturers and regulatory bodies can safeguard public health and maintain confidence in the food supply chain. The ongoing evolution of food safety regulations underscores the importance of continuous testing and adherence to stringent standards.
What are the market trends shaping the Toxicology Testing Industry?
- Advances in toxicology testing technology represent the current market trend. This sector continues to evolve, driven by technological innovations.
- The field of toxicology is continually advancing, with a focus on understanding the human biological system and diseases at a molecular level. In-vitro testing methods, which involve experimentation on non-living organisms or cell cultures, are increasingly replacing in-vivo methods. This shift is due to the limitations of in-vivo testing, which involves experimentation on whole living organisms, and the need to detect diseases and screen chemicals with minimal adverse effects. Technological advancements, including cell culture technologies, cellular imaging technologies, and toxicogenomics, are driving the evolution of in-vitro testing. For instance, cell culture technologies enable the growth of cells outside their natural environment, while cellular imaging technologies provide visual representations of cellular processes.
- Toxicogenomics, which involves the study of the genomic response to toxic substances, further enhances the accuracy and specificity of in-vitro testing. The adoption of these techniques is transforming the toxicology landscape, offering a more efficient, cost-effective, and ethical alternative to in-vivo testing.
What challenges does the Toxicology Testing Industry face during its growth?
- The toxicology testing industry faces significant growth impediments due to the scarcity of proficient specialists in this field.
- Toxicology testing, a critical process in various industries including biopharmaceuticals, universities, and forensic science, is experiencing a significant demand due to increasing regulatory requirements and research initiatives. However, this demand comes with challenges. The scarcity of skilled and trained toxicology professionals is a major concern. According to industry reports, the toxicology workforce shortage is projected to reach a deficit of over 2,000 professionals by 2025. This shortfall can lead to extended wait times for testing services, potentially discouraging organizations from pursuing necessary testing.
- The complex nature of toxicology testing necessitates a high level of expertise, with professionals requiring formal education, training, and operational experience to effectively analyze samples using sophisticated techniques and instruments. The ongoing skills gap underscores the need for strategic workforce planning and investment in training programs to meet the evolving demands of this vital field.
Exclusive Customer Landscape
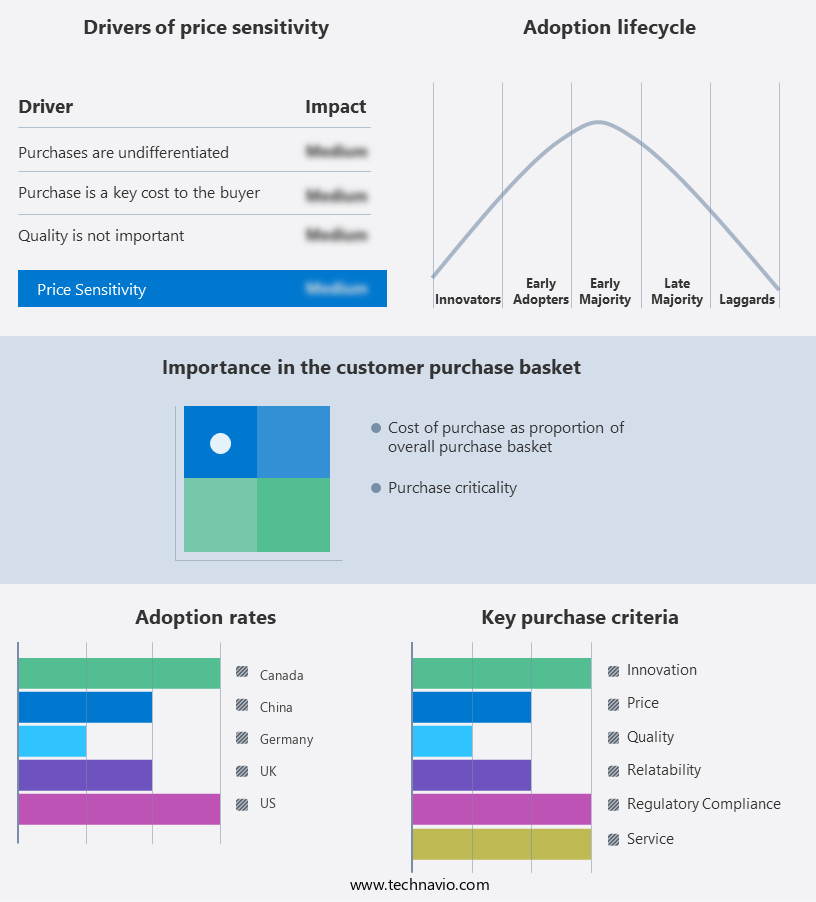
The toxicology testing market forecasting report includes the adoption lifecycle of the market, covering from the innovator’s stage to the laggard’s stage. It focuses on adoption rates in different regions based on penetration. Furthermore, the toxicology testing market report also includes key purchase criteria and drivers of price sensitivity to help companies evaluate and develop their market growth analysis strategies.
Customer Landscape of Toxicology Testing Industry
Competitive Landscape & Market Insights
Companies are implementing various strategies, such as strategic alliances, toxicology testing market forecast, partnerships, mergers and acquisitions, geographical expansion, and product/service launches, to enhance their presence in the industry.
Abbott Laboratories - The company provides toxicology testing solutions, including the iCup Drug Screen, an innovative on-site urine drug screening device. This device streamlines the collection process and tests for 17 drugs, enhancing efficiency and accuracy in drug screening procedures.
The industry research and growth report includes detailed analyses of the competitive landscape of the market and information about key companies, including:
- Abbott Laboratories
- Agilent Technologies Inc.
- Aragen Life Sciences Pvt. Ltd.
- BICO Group AB
- Bio Rad Laboratories Inc.
- BioIVT LLC
- Catalent Inc.
- Charles River Laboratories International Inc.
- CompuDrug Ltd.
- Danaher Corp.
- Eurofins Scientific SE
- Evotec SE
- Ingenza Ltd.
- Laboratory Corp. of America Holdings
- Merck KGaA
- Quest Diagnostics Inc.
- Randox Laboratories Ltd.
- Revvity Inc.
- SGS SA
- Thermo Fisher Scientific Inc.
Qualitative and quantitative analysis of companies has been conducted to help clients understand the wider business environment as well as the strengths and weaknesses of key industry players. Data is qualitatively analyzed to categorize companies as pure play, category-focused, industry-focused, and diversified; it is quantitatively analyzed to categorize companies as dominant, leading, strong, tentative, and weak.
Recent Development and News in Toxicology Testing Market
- In January 2024, Thermo Fisher Scientific, a leading life sciences solutions provider, announced the launch of its new Tox110A assay, expanding its portfolio of solutions for detecting drugs of abuse in various matrices. This innovative assay, which utilizes LC-MS/MS technology, can detect a broader range of drugs and metabolites than previous offerings (Thermo Fisher Scientific press release).
- In March 2024, LabCorp and Quest Diagnostics, two major clinical laboratory services providers, entered into a strategic collaboration to offer comprehensive toxicology testing services to healthcare providers and employers. This partnership aimed to streamline the testing process and improve turnaround times for clients (LabCorp press release).
- In May 2024, Mylan N.V., a global pharmaceutical company, completed the acquisition of Agilent Technologies' diagnostics business, including its toxicology testing division. This acquisition significantly expanded Mylan's diagnostic offerings and strengthened its presence in the market (Mylan N.V. SEC filing).
- In January 2025, the European Union's In Vitro Diagnostic Medical Devices Regulation (IVDR) came into effect, imposing stricter regulations on toxicology testing devices. This regulatory change led to increased investments in research and development to ensure compliance and maintain market competitiveness (European Commission press release).
Dive into Technavio’s robust research methodology, blending expert interviews, extensive data synthesis, and validated models for unparalleled Toxicology Testing Market insights. See full methodology.
|
Market Scope |
|
|
Report Coverage |
Details |
|
Page number |
222 |
|
Base year |
2024 |
|
Historic period |
2019-2023 |
|
Forecast period |
2025-2029 |
|
Growth momentum & CAGR |
Accelerate at a CAGR of 14.3% |
|
Market growth 2025-2029 |
USD 34993.9 million |
|
Market structure |
Fragmented |
|
YoY growth 2024-2025(%) |
13.0 |
|
Key countries |
US, Germany, China, UK, Canada, Japan, France, India, Italy, and Mexico |
|
Competitive landscape |
Leading Companies, Market Positioning of Companies, Competitive Strategies, and Industry Risks |
Research Analyst Overview
- The market encompasses a range of assays and techniques used to evaluate the potential adverse effects of chemicals and pharmaceuticals on living organisms. This dynamic industry continues to evolve, with key testing areas including necrosis assays, in vitro toxicology, and immunotoxicity testing. One significant aspect of toxicology testing is the determination of EC50 and LC50 values, which represent the concentration of a substance required to produce a specific effect on 50% of the test organisms and the concentration lethal to 50% of the test organisms, respectively. Additionally, genotoxicity testing, oxidative stress assessment, and apoptosis assays play crucial roles in understanding toxicity pathways and identifying potential DNA damage or cellular death.
- In vitro techniques have gained popularity due to their cost-effectiveness and ability to minimize animal usage. These methods include cytotoxicity assays, microscopy techniques, and dose-response curves, which help evaluate the impact of substances on cellular systems. Furthermore, immunotoxicity testing and neurotoxicity assessment are essential for understanding the effects of chemicals on the immune and nervous systems, respectively. GLP compliance, adherence to OECD guidelines, and biomarker discovery are essential aspects of ensuring accurate and reliable toxicology testing results. Clinical chemistry, hematology testing, and clinical pathology contribute to the assessment of systemic effects, while pharmacokinetic analysis and toxicokinetic modeling provide insights into the absorption, distribution, metabolism, and elimination of substances.
- Developmental toxicity, reprotoxicology studies, and in vivo studies are critical for evaluating the potential effects of chemicals on developing organisms and reproduction. Pathological examination and histopathological analysis are integral components of post-mortem assessments, offering valuable insights into the underlying mechanisms of toxicity. Market activities in toxicology testing remain robust, with ongoing advancements in techniques, technologies, and regulatory requirements. As the industry continues to unfold, it is essential to stay informed about the latest trends, innovations, and regulatory updates to maintain a competitive edge.
What are the Key Data Covered in this Toxicology Testing Market Research and Growth Report?
-
What is the expected growth of the Toxicology Testing Market between 2025 and 2029?
-
USD 34.99 billion, at a CAGR of 14.3%
-
-
What segmentation does the market report cover?
-
The report segmented by Technology (Cell culture technology, High throughput technology, Molecular imaging, and OMICS technology), End-user (Pharmaceutical industry, Food industry, and Others), Type (In-vitro, In-vivo, and In-silico), and Geography (North America, Europe, Asia, and Rest of World (ROW))
-
-
Which regions are analyzed in the report?
-
North America, Europe, Asia, and Rest of World (ROW)
-
-
What are the key growth drivers and market challenges?
-
High regulatory compliance in food industry, Lack of skilled professionals in toxicology testing services
-
-
Who are the major players in the Toxicology Testing Market?
-
Key Companies Abbott Laboratories, Agilent Technologies Inc., Aragen Life Sciences Pvt. Ltd., BICO Group AB, Bio Rad Laboratories Inc., BioIVT LLC, Catalent Inc., Charles River Laboratories International Inc., CompuDrug Ltd., Danaher Corp., Eurofins Scientific SE, Evotec SE, Ingenza Ltd., Laboratory Corp. of America Holdings, Merck KGaA, Quest Diagnostics Inc., Randox Laboratories Ltd., Revvity Inc., SGS SA, and Thermo Fisher Scientific Inc.
-
Market Research Insights
- The market encompasses a range of analytical techniques used to assess the potential harm of chemicals and substances on living organisms. Two significant aspects of this market are exposure assessment and data interpretation. Exposure assessment involves determining the amount and duration of chemical contact, while data interpretation entails analyzing results to identify potential health risks. For instance, cell viability assays and QPCR analysis are essential tools for assessing exposure and interpreting data in toxicology. Cell viability assays measure the percentage of living cells after exposure to a substance, providing insights into acute toxicity. In contrast, QPCR analysis quantifies gene expression levels, which can indicate chronic toxicity and long-term health effects.
- Repeat dose toxicity, oral toxicity, and dermal toxicity are critical areas of regulatory toxicology that require extensive testing and data interpretation. For example, oral toxicity studies may involve administering a substance daily for several weeks to evaluate potential health risks. Similarly, dermal toxicity assessments test the effects of chemical contact on the skin. In silico modeling, metabolite identification, and protein expression analysis are essential components of toxicology testing, contributing to the continuous evolution of the market. These advanced techniques enable researchers to predict potential toxicity and better understand the mechanisms behind adverse health effects.
- Regulatory submissions, report generation, and validation studies are integral parts of the toxicology testing process, ensuring the accuracy and reliability of test results. ELISA assays, Western blotting, comet assay, Ames test, and flow cytometry are among the various techniques used to generate data for these submissions. Safety pharmacology, inhalation toxicity, and subchronic toxicity testing are additional areas of the toxicology market that require comprehensive testing and data interpretation to evaluate the potential risks of various substances. Overall, the market is characterized by continuous innovation and a growing need for accurate and reliable testing methods to ensure the safety of chemicals and substances in various industries.
We can help! Our analysts can customize this toxicology testing market research report to meet your requirements.
 RIA -
RIA - 
