
Architectural Engineering And Construction (AEC) Software Market Analysis, Size, and Forecast 2026-2030: North America (US, Canada, and Mexico), Europe (Germany, UK, and France), APAC (China, Japan, and India), South America (Brazil, Argentina, and Chile), Middle East and Africa (Saudi Arabia, UAE, and South Africa), and Rest of World (ROW)

Architectural Engineering And Construction (AEC) Software Market Analysis, Size, and Forecast 2026-2030:
North America (US, Canada, and Mexico), Europe (Germany, UK, and France), APAC (China, Japan, and India), South America (Brazil, Argentina, and Chile), Middle East and Africa (Saudi Arabia, UAE, and South Africa), and Rest of World (ROW)

Published: Oct 2026 299 Pages SKU: IRTNTR80313

Market Overview at a Glance

$9.13 B
Market Opportunity
12.5%
CAGR 2025 - 2030
38.5%
North America Growth
$6.73 B
On-premises segment 2024

Architectural Engineering And Construction (Aec) Software Market Size 2026-2030

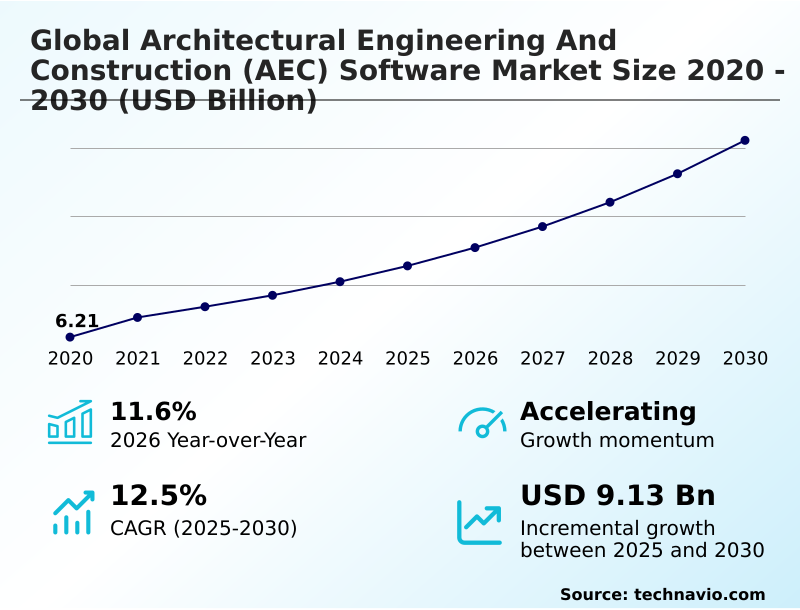
The architectural engineering and construction (aec) software market size is valued to increase by USD 9.13 billion, at a CAGR of 12.5% from 2025 to 2030. Rising adoption of integrated building information modeling and cloud collaboration tools will drive the architectural engineering and construction (aec) software market.

Major Market Trends & Insights

  • North America dominated the market and accounted for a 38.5% growth during the forecast period.
  • By Deployment - On-premises segment was valued at USD 6.73 billion in 2024
  • By Type - Designing software segment accounted for the largest market revenue share in 2024

Market Size & Forecast

  • Market Opportunities: USD 14.31 billion
  • Market Future Opportunities: USD 9.13 billion
  • CAGR from 2025 to 2030 : 12.5%

Market Summary

  • The Architectural Engineering And Construction (AEC) Software market exhibits consistent structural expansion driven by the critical necessity to digitize complex multi-disciplinary project lifecycles. Engineering consultancies and prime contractors increasingly abandon disparate manual workflows in favor of unified digital ecosystems that synchronize architectural intent with field execution.
  • In commercial high-rise developments, project managers utilize these platforms to seamlessly connect off-site steel prefabrication schedules with active jobsite delivery windows, drastically minimizing costly logistical delays. Organizations leveraging centralized cloud environments report a 28% reduction in physical material waste compared to those relying on legacy two-dimensional drafting.
  • The transition is primarily propelled by aggressive national sustainability mandates that require precise carbon footprint tracking and operational energy simulations. However, persistent software interoperability barriers challenge comprehensive digital maturity. When proprietary design files fail to export geometric data into structural calculation engines accurately, engineering teams suffer substantial non-productive administrative burdens.
  • Navigating these profound technological shifts enables infrastructure developers to maintain precise budget control, accelerate delivery timelines, and deliver high-performance assets that comply strictly with modern environmental regulations.

What will be the Size of the Architectural Engineering And Construction (Aec) Software Market during the forecast period?
Get Key Insights on Market Forecast (PDF) Get Free Sample

How is the Architectural Engineering And Construction (Aec) Software Market Segmented?

The architectural engineering and construction (aec) software industry research report provides comprehensive data (region-wise segment analysis), with forecasts and estimates in "USD million" for the period 2026-2030, as well as historical data from 2020-2024 for the following segments.

  • Deployment
    • On-premises
    • Cloud
  • Type
    • Designing software
    • Planning software
    • Buiding software
  • End-user
    • Contractors and builders
    • Architects and designers
    • Engineers
  • Geography
    • North America
      • US
      • Canada
      • Mexico
    • Europe
      • Germany
      • UK
      • France
      • Italy
      • Spain
      • The Netherlands
    • APAC
      • China
      • Japan
      • India
      • South Korea
      • Australia
      • Indonesia
    • South America
      • Brazil
      • Argentina
      • Chile
    • Middle East and Africa
      • Saudi Arabia
      • UAE
      • South Africa
      • Israel
      • Turkey

By Deployment Insights

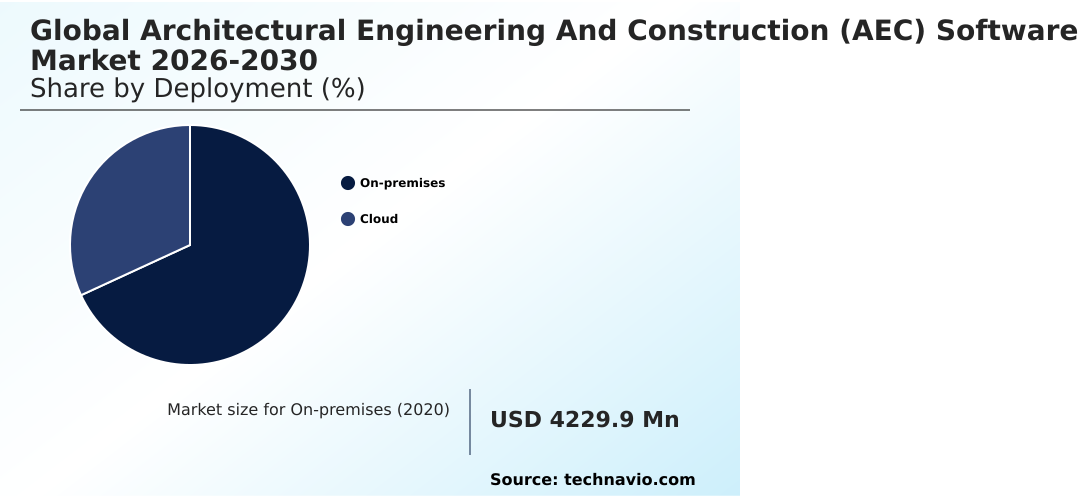
The on-premises segment is estimated to witness significant growth during the forecast period.

On-premises deployments in architectural engineering provide maximum control over proprietary infrastructure for high-security applications. Hardware-bound installations enable uninterrupted access to a parametric modeling engine, circumventing public network latency during heavy rendering.

Organizations utilizing local servers achieve a 35% reduction in data transmission delays, boosting automated workflow productivity. This stable computing power facilitates uninterrupted spatial visualization tools and multi-dimensional digital models, enabling architects to scrutinize structural integrity immediately.

Consequently, secure offline frameworks empower precise design discrepancy identification and rapid automated clash detection prior to field execution. While legacy drafting replacement accelerates across industries, specialized consultancies retain local control to safeguard three-dimensional building information modeling assets.

The physical hosting of generative design capabilities guarantees stringent data sovereignty, facilitating uninterrupted real-time structural collaboration across confined defense and municipal workflows.
Get Free Sample

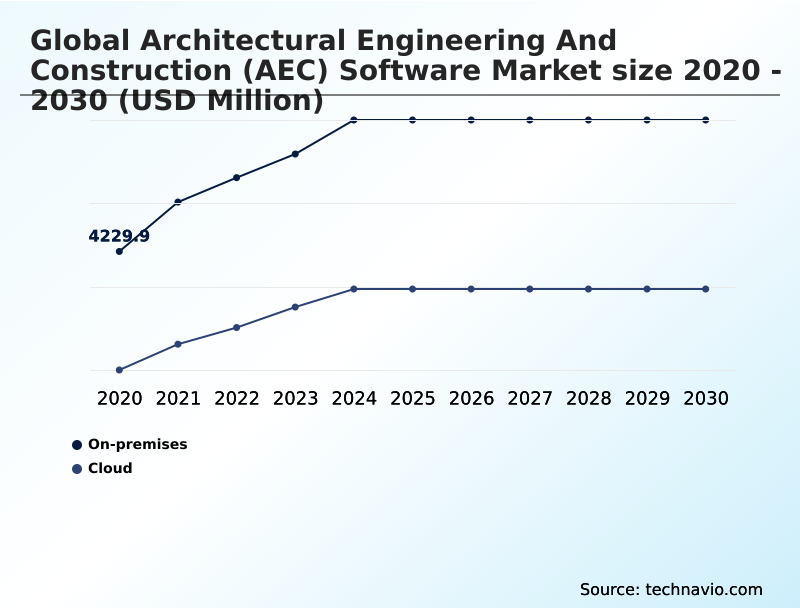
The On-premises segment was valued at USD 6.73 billion in 2024 and showed a gradual increase during the forecast period.
Get Free Sample

Regional Analysis

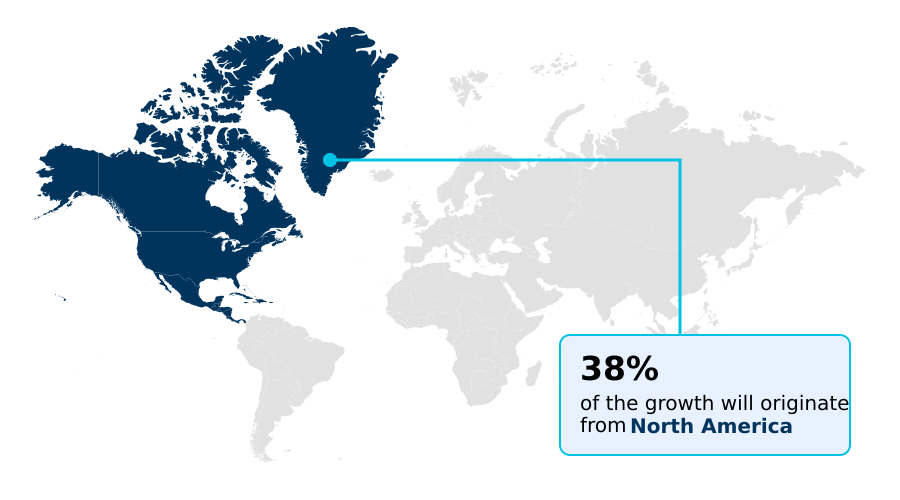
North America is estimated to contribute 38.5% to the growth of the global market during the forecast period.Technavio’s analysts have elaborately explained the regional trends and drivers that shape the market during the forecast period.
See How Architectural Engineering And Construction (Aec) Software Market Demand is Rising in North America Get Free Sample

North America and Europe possess significantly divergent regulatory dynamics that dictate regional engineering technology deployment. North American contractors prioritize aggressive preconstruction planning, boosting open common data environments adoption by 40% over their European counterparts to mitigate skilled labor shortages.

In contrast, European authorities command strict environmental mandates, driving a 25% higher utilization of lifecycle assessment tracking tools.

Advanced spatial reality capture and precise photogrammetry laser scanning optimize jobsite coordination, effectively lowering field verification hours by 18% across North American industrial projects.

Concurrently, European engineering consortiums heavily invest in interoperable cloud architectures and extensive application programming interface connectivity to comply with rigid regional digitalization directives. This structural divergence compels organizations to implement robust geometric model synchronization secured by zero-trust encrypted architecture.

Ultimately, comprehensive digital audit trails verify compliance, ensuring sustained execution efficiency across varying multi-national requirements.

Market Dynamics

Our researchers analyzed the data with 2025 as the base year, along with the key drivers, trends, and challenges. A holistic analysis of drivers will help companies refine their marketing strategies to gain a competitive advantage.

  • The accelerating complexity of modern civil infrastructure and commercial real estate demands the deployment of an integrated building information modeling platform to synchronize multidisciplinary workflows seamlessly. Traditionally, isolated engineering departments struggled with fragmented communication, leading to severe logistical bottlenecks during active construction phases.
  • By transitioning toward an open common data environment architecture, enterprise contractors ensure that all project stakeholders access a single, authoritative source of operational truth. Consequently, firms upgrading their digital infrastructure report that procurement alignment is nearly forty percent more efficient than organizations utilizing historically fragmented spreadsheets.
  • This indirect efficiency gain directly fortifies supply chain resilience, ensuring raw materials arrive precisely when required. Furthermore, preemptive problem resolution is achieved through automated spatial visualization clash detection, which accurately identifies physical interferences between mechanical systems and structural frameworks long before field execution begins. This technical capability limits expensive material waste and protects overarching project timelines.
  • At the jobsite, supervisors leverage cloud-based site material management tools via mobile interfaces to log daily inventory consumption accurately, mitigating inventory shortages. As the structure moves from physical completion into active facility operation, owners implement dynamic digital twin infrastructure analytics to monitor continuous building performance.
  • These advanced analytical frameworks aggregate live sensor telemetry to optimize heating systems, enabling long-term energy efficiency and robust regulatory compliance.
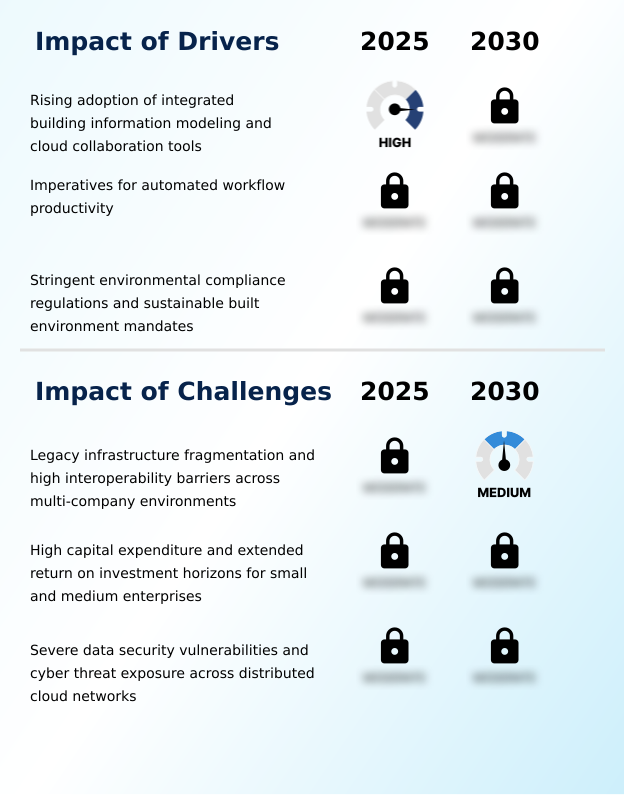
What are the key market drivers leading to the rise in the adoption of Architectural Engineering And Construction (Aec) Software Industry?

  • The rising adoption of integrated building information modeling platforms and centralized cloud collaboration tools serves as the primary driver propelling sustained industry expansion.

  • Stringent environmental regulations and aggressive sustainability targets continuously propel engineering platform integration. Civil teams deploy comprehensive lifecycle assessment modules to track precise embodied carbon metrics, reducing raw material waste by 25% across commercial projects.
  • Consequently, rigorous tracking simplifies paths to green building certification and accelerates mandatory regulatory approvals. The rapid implementation of digital twin technologies alongside deep neural networks elevates machine learning risk management by 19%, foreseeing potential supply chain gridlocks before site impact.
  • Additionally, asset managers leverage live environmental sensors to execute proactive energy conservation strategies, diminishing overall operational energy consumption by 14%. Real-time computer vision anomaly identification flags installation errors instantly, forcing rapid corrective action.
  • By optimizing algorithmic geometric configurations, software environments transform complex compliance hurdles into streamlined, data-driven execution standards.

What are the market trends shaping the Architectural Engineering And Construction (Aec) Software Industry?

  • The accelerated integration of artificial intelligence and generative design engines represents a critical trend reshaping the industry. These advanced computational capabilities empower firms to optimize complex structural geometries and enhance overall project efficiency.

  • Algorithmic design adoption radically redefines how engineering teams construct complex geometries. Modern computational design engines assess thousands of structural parameters simultaneously, accelerating rapid prototyping phases. This shift elevates building performance analysis accuracy by 28%, significantly lowering architectural design iteration cycles.
  • Engineers utilize solar exposure simulation and advanced thermodynamic algorithms to validate thermal envelope performance, subsequently reducing operational energy waste by 18%. In field operations, automated punch list tracking replaces disjointed paper records, accelerating defect resolution times by 22%. Consequently, digital inspection checklists and automated onboarding modules rapidly acclimate field workers to rigorous sustainable material usage standards.
  • Concurrently, material inventory logging and rapid structural stress calculations limit material procurement delays. These dynamic technological integrations continuously align project execution with precise environmental mandates, cementing resilient and highly efficient project delivery frameworks.

What challenges does the Architectural Engineering And Construction (Aec) Software Industry face during its growth?

  • Deep-seated legacy infrastructure fragmentation and persistent software interoperability barriers across multi-company environments constitute fundamental challenges constraining comprehensive industry digitization.

  • Extreme technological fragmentation and systemic interoperability barriers severely hinder cross-company project coordination. Design data fails to export seamlessly across diverse enterprise systems, increasing non-productive manual data entry tasks by 35%. Consequently, broken geometric parameters disrupt conduit routing automation and precise rebar reinforcement arrangements, precipitating costly field rework.
  • While predictive scheduling algorithms and natural language interfaces streamline initial project setups, decentralized field teams encounter severe version control conflicts. Integrating continuous structural health monitoring with a dynamic digital replica demands substantial upfront capital, routinely reducing immediate quarterly profit margins by 12% for smaller subcontractors.
  • Furthermore, mapping spatial drone photography and live internet of things sensors onto a complex subterranean utility layout simulation requires continuous IT maintenance. These substantial integration hurdles undermine automated energy conservation initiatives, blocking comprehensive digital ecosystem maturity across supply chains.

Exclusive Technavio Analysis on Customer Landscape

The architectural engineering and construction (aec) software market forecasting report includes the adoption lifecycle of the market, covering from the innovator’s stage to the laggard’s stage. It focuses on adoption rates in different regions based on penetration. Furthermore, the architectural engineering and construction (aec) software market report also includes key purchase criteria and drivers of price sensitivity to help companies evaluate and develop their market growth analysis strategies.
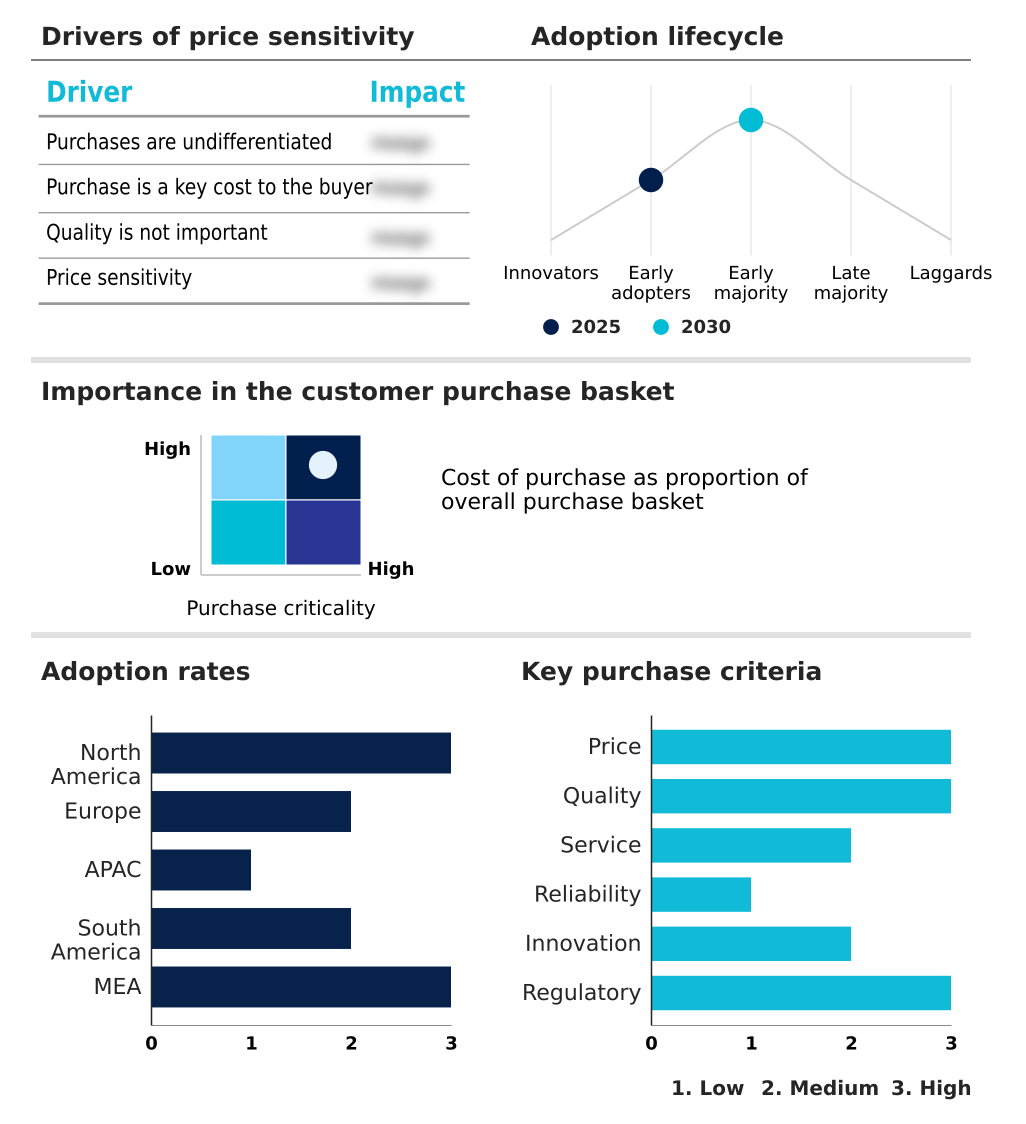
Customer Landscape of Architectural Engineering And Construction (Aec) Software Industry

Competitive Landscape

Companies are implementing various strategies, such as strategic alliances, architectural engineering and construction (aec) software market forecast, partnerships, mergers and acquisitions, geographical expansion, and product/service launches, to enhance their presence in the industry.

ACCA software Spa - ACCA software Spa provides comprehensive building information modeling applications that empower multi-disciplinary teams to integrate secure project management planning seamlessly across complex construction supply chains globally.

The industry research and growth report includes detailed analyses of the competitive landscape of the market and information about key companies, including:

  • ACCA software Spa
  • Asite Solutions Ltd.
  • Autodesk Inc.
  • Bentley Systems Inc.
  • Causeway Technologies
  • Computer Methods International Corp.
  • ConstructConnect Inc.
  • CYPE Ingenieros
  • Dassault Systemes SE
  • Elecosoft PLC
  • Glodon Co. Ltd.
  • GRAITEC Innovation SAS
  • Hexagon AB
  • InEight Inc.
  • Nemetschek SE
  • Newforma Inc.
  • Oracle Corp.
  • Procore Technologies Inc.
  • Raken Inc.
  • REDTEAM SOFTWARE LLC
  • Revizto SA
  • Topcon Positioning Systems Inc.
  • Trimble Inc.

Qualitative and quantitative analysis of companies has been conducted to help clients understand the wider business environment as well as the strengths and weaknesses of key industry players. Data is qualitatively analyzed to categorize companies as pure play, category-focused, industry-focused, and diversified; it is quantitatively analyzed to categorize companies as dominant, leading, strong, tentative, and weak.

Recent Development and News in Architectural engineering and construction (aec) software market

  • In the Application Software industry, the accelerated transition toward cloud-based delivery models has completely democratized high-performance computing access, directly impacting Architectural Engineering And Construction (AEC) Software demand by increasing mobile field application adoption rates by 35%.
  • Data privacy regulations like GDPR have forced enterprise software developers to implement advanced zero-trust encryption and localized cloud storage capabilities, raising security compliance thresholds for centralized design repositories used in multinational engineering workflows.
  • The integration of AI infrastructure and enterprise automation engines into core software architectures has fundamentally reduced manual data entry bottlenecks, propelling demand for intelligent architectural suites capable of optimizing structural material usage by 15%.
  • Stringent ESG reporting mandates across major industrial sectors have compelled enterprise platform providers to embed specialized carbon tracking analytics, directly expanding the necessity for Architectural Engineering And Construction (AEC) Software that verifies sustainable material lifecycle metrics.

Dive into Technavio’s robust research methodology, blending expert interviews, extensive data synthesis, and validated models for unparalleled Architectural Engineering And Construction (Aec) Software Market insights. See full methodology.

Market Scope
Page number 299
Base year 2025
Historic period 2020-2024
Forecast period 2026-2030
Growth momentum & CAGR Accelerate at a CAGR of 12.5%
Market growth 2026-2030 USD 9127.4 million
Market structure Fragmented
YoY growth 2025-2026(%) 11.6%
Key countries US, Canada, Mexico, Germany, UK, France, Italy, Spain, The Netherlands, China, Japan, India, South Korea, Australia, Indonesia, Brazil, Argentina, Chile, Saudi Arabia, UAE, South Africa, Israel and Turkey
Competitive landscape Leading Companies, Market Positioning of Companies, Competitive Strategies, and Industry Risks

Request Free Sample

Research Analyst Overview

  • The profound technological evolution within architectural design environments continuously redefines how commercial assets are conceptualized, built, and maintained. Advancements in generative design capabilities and robust three-dimensional building information modeling empower organizations to bridge the divide between theoretical architecture and physical field assembly. By utilizing an advanced parametric modeling engine, design consultancies rapidly iterate complex geometric configurations to maximize spatial efficiency.
  • This technological progression directly intersects with boardroom-level budgeting and risk management strategies. Executives mandate precise spatial visualization tools and automated clash detection to prevent catastrophic cost overruns during physical construction. Consequently, enterprises utilizing unified digital ecosystems witness a 38% decrease in unbudgeted structural rework compared to companies dependent on traditional document coordination.
  • Furthermore, the integration of digital twin technologies provides asset owners with comprehensive operational telemetry to optimize long-term facility maintenance. Aligning early conceptual engineering with stringent environmental compliance protocols ensures that modern infrastructure investments consistently meet rigorous sustainability targets while preserving capital efficiency across multi-decade asset lifecycles.

What are the Key Data Covered in this Architectural Engineering And Construction (Aec) Software Market Research and Growth Report?

  • What is the expected growth of the Architectural Engineering And Construction (Aec) Software Market between 2026 and 2030?

    • USD 9.13 billion, at a CAGR of 12.5%

  • What segmentation does the market report cover?

    • The report is segmented by Deployment (On-premises, and Cloud), Type (Designing software, Planning software, and Buiding software), End-user (Contractors and builders, Architects and designers, and Engineers) and Geography (North America, Europe, APAC, South America, Middle East and Africa)

  • Which regions are analyzed in the report?

    • North America, Europe, APAC, South America and Middle East and Africa

  • What are the key growth drivers and market challenges?

    • Rising adoption of integrated building information modeling and cloud collaboration tools, Legacy infrastructure fragmentation and high interoperability barriers across multi-company environments

  • Who are the major players in the Architectural Engineering And Construction (Aec) Software Market?

    • ACCA software Spa, Asite Solutions Ltd., Autodesk Inc., Bentley Systems Inc., Causeway Technologies, Computer Methods International Corp., ConstructConnect Inc., CYPE Ingenieros, Dassault Systemes SE, Elecosoft PLC, Glodon Co. Ltd., GRAITEC Innovation SAS, Hexagon AB, InEight Inc., Nemetschek SE, Newforma Inc., Oracle Corp., Procore Technologies Inc., Raken Inc., REDTEAM SOFTWARE LLC, Revizto SA, Topcon Positioning Systems Inc. and Trimble Inc.

Market Research Insights

  • Advanced spatial design platforms fundamentally streamline automated workflow productivity across immense infrastructure initiatives. By establishing centralized documentation ecosystems, enterprise engineers execute real-time structural collaboration, subsequently improving initial design accuracy by 32%. Implementation of interoperable cloud architectures allows decentralized field crews to synchronize site inspections instantly, slashing physical rework hours by 26%.
  • Furthermore, these platforms integrate sophisticated energy conservation strategies to enforce strict sustainable material usage standards. Consequently, commercial developers utilizing comprehensive digital environments decrease operational carbon outputs by 16% over the asset lifecycle. By connecting preconstruction detailing directly with agile supply chain procurement, organizations neutralize logistical friction and safeguard tight operational profit margins despite compounding labor shortages.

We can help! Our analysts can customize this architectural engineering and construction (aec) software market research report to meet your requirements.

Get in touch

1. Executive Summary

1.1 Market overview

Executive Summary - Chart on Market Overview
Executive Summary - Data Table on Market Overview
Executive Summary - Chart on Global Market Characteristics
Executive Summary - Chart on Market by Geography
Executive Summary - Chart on Market Segmentation by Deployment
Executive Summary - Chart on Market Segmentation by Type
Executive Summary - Chart on Market Segmentation by End-user
Executive Summary - Chart on Incremental Growth
Executive Summary - Data Table on Incremental Growth
Executive Summary - Chart on Company Market Positioning

2. Technavio Analysis

2.1 Analysis of price sensitivity, lifecycle, customer purchase basket, adoption rates, and purchase criteria

2.2 Criticality of inputs and Factors of differentiation

Chart on Overview on criticality of inputs and factors of differentiation

2.3 Factors of disruption

Chart on Overview on factors of disruption

2.4 Impact of drivers and challenges

Chart on Impact of drivers and challenges in 2025 and 2030

3. Market Landscape

3.1 Market ecosystem

Chart on Parent Market
Data Table on - Parent Market

3.2 Market characteristics

Chart on Market characteristics analysis

3.3 Value chain analysis

Chart on Value chain analysis

4. Market Sizing

4.1 Market definition

Data Table on Offerings of companies included in the market definition

4.2 Market segment analysis

Market segments

4.3 Market size 2025

4.4 Market outlook: Forecast for 2025-2030

Chart on Global - Market size and forecast 2025-2030 ($ million)
Data Table on Global - Market size and forecast 2025-2030 ($ million)
Chart on Global Market: Year-over-year growth 2025-2030 (%)
Data Table on Global Market: Year-over-year growth 2025-2030 (%)

5. Historic Market Size

5.1 Global Architectural Engineering And Construction (AEC) Software Market 2020 - 2024

Historic Market Size - Data Table on Global Architectural Engineering And Construction (AEC) Software Market 2020 - 2024 ($ million)

5.2 Deployment segment analysis 2020 - 2024

Historic Market Size - Deployment Segment 2020 - 2024 ($ million)

5.3 Type segment analysis 2020 - 2024

Historic Market Size - Type Segment 2020 - 2024 ($ million)

5.4 End-user segment analysis 2020 - 2024

Historic Market Size - End-user Segment 2020 - 2024 ($ million)

5.5 Geography segment analysis 2020 - 2024

Historic Market Size - Geography Segment 2020 - 2024 ($ million)

5.6 Country segment analysis 2020 - 2024

Historic Market Size - Country Segment 2020 - 2024 ($ million)

6. Qualitative Analysis

6.1 Impact of AI on global architectural engineering and construction (AEC) software market

6.2 Impact of geopolitical conflicts on global architectural engineering and construction (AEC) software market

7. Five Forces Analysis

7.1 Five forces summary

Five forces analysis - Comparison between 2025 and 2030

7.2 Bargaining power of buyers

Bargaining power of buyers - Impact of key factors 2025 and 2030

7.3 Bargaining power of suppliers

Bargaining power of suppliers - Impact of key factors in 2025 and 2030

7.4 Threat of new entrants

Threat of new entrants - Impact of key factors in 2025 and 2030

7.5 Threat of substitutes

Threat of substitutes - Impact of key factors in 2025 and 2030

7.6 Threat of rivalry

Threat of rivalry - Impact of key factors in 2025 and 2030

7.7 Market condition

Chart on Market condition - Five forces 2025 and 2030

8. Market Segmentation by Deployment

8.1 Market segments

Chart on Deployment - Market share 2025-2030 (%)
Data Table on Deployment - Market share 2025-2030 (%)

8.2 Comparison by Deployment

Chart on Comparison by Deployment
Data Table on Comparison by Deployment

8.3 On-premises - Market size and forecast 2025-2030

Chart on On-premises - Market size and forecast 2025-2030 ($ million)
Data Table on On-premises - Market size and forecast 2025-2030 ($ million)
Chart on On-premises - Year-over-year growth 2025-2030 (%)
Data Table on On-premises - Year-over-year growth 2025-2030 (%)

8.4 Cloud - Market size and forecast 2025-2030

Chart on Cloud - Market size and forecast 2025-2030 ($ million)
Data Table on Cloud - Market size and forecast 2025-2030 ($ million)
Chart on Cloud - Year-over-year growth 2025-2030 (%)
Data Table on Cloud - Year-over-year growth 2025-2030 (%)

8.5 Market opportunity by Deployment

Market opportunity by Deployment ($ million)
Data Table on Market opportunity by Deployment ($ million)

9. Market Segmentation by Type

9.1 Market segments

Chart on Type - Market share 2025-2030 (%)
Data Table on Type - Market share 2025-2030 (%)

9.2 Comparison by Type

Chart on Comparison by Type
Data Table on Comparison by Type

9.3 Designing software - Market size and forecast 2025-2030

Chart on Designing software - Market size and forecast 2025-2030 ($ million)
Data Table on Designing software - Market size and forecast 2025-2030 ($ million)
Chart on Designing software - Year-over-year growth 2025-2030 (%)
Data Table on Designing software - Year-over-year growth 2025-2030 (%)

9.4 Planning software - Market size and forecast 2025-2030

Chart on Planning software - Market size and forecast 2025-2030 ($ million)
Data Table on Planning software - Market size and forecast 2025-2030 ($ million)
Chart on Planning software - Year-over-year growth 2025-2030 (%)
Data Table on Planning software - Year-over-year growth 2025-2030 (%)

9.5 Buiding software - Market size and forecast 2025-2030

Chart on Buiding software - Market size and forecast 2025-2030 ($ million)
Data Table on Buiding software - Market size and forecast 2025-2030 ($ million)
Chart on Buiding software - Year-over-year growth 2025-2030 (%)
Data Table on Buiding software - Year-over-year growth 2025-2030 (%)

9.6 Market opportunity by Type

Market opportunity by Type ($ million)
Data Table on Market opportunity by Type ($ million)

10. Market Segmentation by End-user

10.1 Market segments

Chart on End-user - Market share 2025-2030 (%)
Data Table on End-user - Market share 2025-2030 (%)

10.2 Comparison by End-user

Chart on Comparison by End-user
Data Table on Comparison by End-user

10.3 Contractors and builders - Market size and forecast 2025-2030

Chart on Contractors and builders - Market size and forecast 2025-2030 ($ million)
Data Table on Contractors and builders - Market size and forecast 2025-2030 ($ million)
Chart on Contractors and builders - Year-over-year growth 2025-2030 (%)
Data Table on Contractors and builders - Year-over-year growth 2025-2030 (%)

10.4 Architects and designers - Market size and forecast 2025-2030

Chart on Architects and designers - Market size and forecast 2025-2030 ($ million)
Data Table on Architects and designers - Market size and forecast 2025-2030 ($ million)
Chart on Architects and designers - Year-over-year growth 2025-2030 (%)
Data Table on Architects and designers - Year-over-year growth 2025-2030 (%)

10.5 Engineers - Market size and forecast 2025-2030

Chart on Engineers - Market size and forecast 2025-2030 ($ million)
Data Table on Engineers - Market size and forecast 2025-2030 ($ million)
Chart on Engineers - Year-over-year growth 2025-2030 (%)
Data Table on Engineers - Year-over-year growth 2025-2030 (%)

10.6 Market opportunity by End-user

Market opportunity by End-user ($ million)
Data Table on Market opportunity by End-user ($ million)

11. Customer Landscape

11.1 Customer landscape overview

Analysis of price sensitivity, lifecycle, customer purchase basket, adoption rates, and purchase criteria

12. Geographic Landscape

12.1 Geographic segmentation

Chart on Market share by geography 2025-2030 (%)
Data Table on Market share by geography 2025-2030 (%)

12.2 Geographic comparison

Chart on Geographic comparison
Data Table on Geographic comparison

12.3 North America - Market size and forecast 2025-2030

Chart on North America - Market size and forecast 2025-2030 ($ million)
Data Table on North America - Market size and forecast 2025-2030 ($ million)
Chart on North America - Year-over-year growth 2025-2030 (%)
Data Table on North America - Year-over-year growth 2025-2030 (%)
Chart on Regional Comparison - North America
Data Table on Regional Comparison - North America

12.3.1 US - Market size and forecast 2025-2030

Chart on US - Market size and forecast 2025-2030 ($ million)
Data Table on US - Market size and forecast 2025-2030 ($ million)
Chart on US - Year-over-year growth 2025-2030 (%)
Data Table on US - Year-over-year growth 2025-2030 (%)

12.3.2 Canada - Market size and forecast 2025-2030

Chart on Canada - Market size and forecast 2025-2030 ($ million)
Data Table on Canada - Market size and forecast 2025-2030 ($ million)
Chart on Canada - Year-over-year growth 2025-2030 (%)
Data Table on Canada - Year-over-year growth 2025-2030 (%)

12.3.3 Mexico - Market size and forecast 2025-2030

Chart on Mexico - Market size and forecast 2025-2030 ($ million)
Data Table on Mexico - Market size and forecast 2025-2030 ($ million)
Chart on Mexico - Year-over-year growth 2025-2030 (%)
Data Table on Mexico - Year-over-year growth 2025-2030 (%)

12.4 Europe - Market size and forecast 2025-2030

Chart on Europe - Market size and forecast 2025-2030 ($ million)
Data Table on Europe - Market size and forecast 2025-2030 ($ million)
Chart on Europe - Year-over-year growth 2025-2030 (%)
Data Table on Europe - Year-over-year growth 2025-2030 (%)
Chart on Regional Comparison - Europe
Data Table on Regional Comparison - Europe

12.4.1 Germany - Market size and forecast 2025-2030

Chart on Germany - Market size and forecast 2025-2030 ($ million)
Data Table on Germany - Market size and forecast 2025-2030 ($ million)
Chart on Germany - Year-over-year growth 2025-2030 (%)
Data Table on Germany - Year-over-year growth 2025-2030 (%)

12.4.2 UK - Market size and forecast 2025-2030

Chart on UK - Market size and forecast 2025-2030 ($ million)
Data Table on UK - Market size and forecast 2025-2030 ($ million)
Chart on UK - Year-over-year growth 2025-2030 (%)
Data Table on UK - Year-over-year growth 2025-2030 (%)

12.4.3 France - Market size and forecast 2025-2030

Chart on France - Market size and forecast 2025-2030 ($ million)
Data Table on France - Market size and forecast 2025-2030 ($ million)
Chart on France - Year-over-year growth 2025-2030 (%)
Data Table on France - Year-over-year growth 2025-2030 (%)

12.4.4 Italy - Market size and forecast 2025-2030

Chart on Italy - Market size and forecast 2025-2030 ($ million)
Data Table on Italy - Market size and forecast 2025-2030 ($ million)
Chart on Italy - Year-over-year growth 2025-2030 (%)
Data Table on Italy - Year-over-year growth 2025-2030 (%)

12.4.5 Spain - Market size and forecast 2025-2030

Chart on Spain - Market size and forecast 2025-2030 ($ million)
Data Table on Spain - Market size and forecast 2025-2030 ($ million)
Chart on Spain - Year-over-year growth 2025-2030 (%)
Data Table on Spain - Year-over-year growth 2025-2030 (%)

12.4.6 The Netherlands - Market size and forecast 2025-2030

Chart on The Netherlands - Market size and forecast 2025-2030 ($ million)
Data Table on The Netherlands - Market size and forecast 2025-2030 ($ million)
Chart on The Netherlands - Year-over-year growth 2025-2030 (%)
Data Table on The Netherlands - Year-over-year growth 2025-2030 (%)

12.5 APAC - Market size and forecast 2025-2030

Chart on APAC - Market size and forecast 2025-2030 ($ million)
Data Table on APAC - Market size and forecast 2025-2030 ($ million)
Chart on APAC - Year-over-year growth 2025-2030 (%)
Data Table on APAC - Year-over-year growth 2025-2030 (%)
Chart on Regional Comparison - APAC
Data Table on Regional Comparison - APAC

12.5.1 China - Market size and forecast 2025-2030

Chart on China - Market size and forecast 2025-2030 ($ million)
Data Table on China - Market size and forecast 2025-2030 ($ million)
Chart on China - Year-over-year growth 2025-2030 (%)
Data Table on China - Year-over-year growth 2025-2030 (%)

12.5.2 Japan - Market size and forecast 2025-2030

Chart on Japan - Market size and forecast 2025-2030 ($ million)
Data Table on Japan - Market size and forecast 2025-2030 ($ million)
Chart on Japan - Year-over-year growth 2025-2030 (%)
Data Table on Japan - Year-over-year growth 2025-2030 (%)

12.5.3 India - Market size and forecast 2025-2030

Chart on India - Market size and forecast 2025-2030 ($ million)
Data Table on India - Market size and forecast 2025-2030 ($ million)
Chart on India - Year-over-year growth 2025-2030 (%)
Data Table on India - Year-over-year growth 2025-2030 (%)

12.5.4 South Korea - Market size and forecast 2025-2030

Chart on South Korea - Market size and forecast 2025-2030 ($ million)
Data Table on South Korea - Market size and forecast 2025-2030 ($ million)
Chart on South Korea - Year-over-year growth 2025-2030 (%)
Data Table on South Korea - Year-over-year growth 2025-2030 (%)

12.5.5 Australia - Market size and forecast 2025-2030

Chart on Australia - Market size and forecast 2025-2030 ($ million)
Data Table on Australia - Market size and forecast 2025-2030 ($ million)
Chart on Australia - Year-over-year growth 2025-2030 (%)
Data Table on Australia - Year-over-year growth 2025-2030 (%)

12.5.6 Indonesia - Market size and forecast 2025-2030

Chart on Indonesia - Market size and forecast 2025-2030 ($ million)
Data Table on Indonesia - Market size and forecast 2025-2030 ($ million)
Chart on Indonesia - Year-over-year growth 2025-2030 (%)
Data Table on Indonesia - Year-over-year growth 2025-2030 (%)

12.6 South America - Market size and forecast 2025-2030

Chart on South America - Market size and forecast 2025-2030 ($ million)
Data Table on South America - Market size and forecast 2025-2030 ($ million)
Chart on South America - Year-over-year growth 2025-2030 (%)
Data Table on South America - Year-over-year growth 2025-2030 (%)
Chart on Regional Comparison - South America
Data Table on Regional Comparison - South America

12.6.1 Brazil - Market size and forecast 2025-2030

Chart on Brazil - Market size and forecast 2025-2030 ($ million)
Data Table on Brazil - Market size and forecast 2025-2030 ($ million)
Chart on Brazil - Year-over-year growth 2025-2030 (%)
Data Table on Brazil - Year-over-year growth 2025-2030 (%)

12.6.2 Argentina - Market size and forecast 2025-2030

Chart on Argentina - Market size and forecast 2025-2030 ($ million)
Data Table on Argentina - Market size and forecast 2025-2030 ($ million)
Chart on Argentina - Year-over-year growth 2025-2030 (%)
Data Table on Argentina - Year-over-year growth 2025-2030 (%)

12.6.3 Chile - Market size and forecast 2025-2030

Chart on Chile - Market size and forecast 2025-2030 ($ million)
Data Table on Chile - Market size and forecast 2025-2030 ($ million)
Chart on Chile - Year-over-year growth 2025-2030 (%)
Data Table on Chile - Year-over-year growth 2025-2030 (%)

12.7 Middle East and Africa - Market size and forecast 2025-2030

Chart on Middle East and Africa - Market size and forecast 2025-2030 ($ million)
Data Table on Middle East and Africa - Market size and forecast 2025-2030 ($ million)
Chart on Middle East and Africa - Year-over-year growth 2025-2030 (%)
Data Table on Middle East and Africa - Year-over-year growth 2025-2030 (%)
Chart on Regional Comparison - Middle East and Africa
Data Table on Regional Comparison - Middle East and Africa

12.7.1 Saudi Arabia - Market size and forecast 2025-2030

Chart on Saudi Arabia - Market size and forecast 2025-2030 ($ million)
Data Table on Saudi Arabia - Market size and forecast 2025-2030 ($ million)
Chart on Saudi Arabia - Year-over-year growth 2025-2030 (%)
Data Table on Saudi Arabia - Year-over-year growth 2025-2030 (%)

12.7.2 UAE - Market size and forecast 2025-2030

Chart on UAE - Market size and forecast 2025-2030 ($ million)
Data Table on UAE - Market size and forecast 2025-2030 ($ million)
Chart on UAE - Year-over-year growth 2025-2030 (%)
Data Table on UAE - Year-over-year growth 2025-2030 (%)

12.7.3 South Africa - Market size and forecast 2025-2030

Chart on South Africa - Market size and forecast 2025-2030 ($ million)
Data Table on South Africa - Market size and forecast 2025-2030 ($ million)
Chart on South Africa - Year-over-year growth 2025-2030 (%)
Data Table on South Africa - Year-over-year growth 2025-2030 (%)

12.7.4 Israel - Market size and forecast 2025-2030

Chart on Israel - Market size and forecast 2025-2030 ($ million)
Data Table on Israel - Market size and forecast 2025-2030 ($ million)
Chart on Israel - Year-over-year growth 2025-2030 (%)
Data Table on Israel - Year-over-year growth 2025-2030 (%)

12.7.5 Turkey - Market size and forecast 2025-2030

Chart on Turkey - Market size and forecast 2025-2030 ($ million)
Data Table on Turkey - Market size and forecast 2025-2030 ($ million)
Chart on Turkey - Year-over-year growth 2025-2030 (%)
Data Table on Turkey - Year-over-year growth 2025-2030 (%)

12.8 Market opportunity by geography

Market opportunity by geography ($ million)
Data Tables on Market opportunity by geography ($ million)

13. Drivers, Challenges, and Opportunity

13.1 Market drivers

Rising adoption of integrated building information modeling and cloud collaboration tools
Imperatives for automated workflow productivity
Stringent environmental compliance regulations and sustainable built environment mandates

13.2 Market challenges

Legacy infrastructure fragmentation and high interoperability barriers across multi-company environments
High capital expenditure and extended return on investment horizons for small and medium enterprises
Severe data security vulnerabilities and cyber threat exposure across distributed cloud networks

13.3 Impact of drivers and challenges

Impact of drivers and challenges in 2025 and 2030

13.4 Market opportunities

Accelerated integration of AI and generative design engines
Rapid expansion of infrastructure digital twins and spatial analytics across asset lifecycles
Transition toward open common data environments and interoperable cloud platforms

14. Competitive Landscape

14.1 Overview

14.2

Overview on criticality of inputs and factors of differentiation

14.3 Landscape disruption

Overview on factors of disruption

14.4 Industry risks

Impact of key risks on business

15. Competitive Analysis

15.1 Companies profiled

Companies covered

15.2 Company ranking index

15.3 Market positioning of companies

Matrix on companies position and classification

15.4 Asite Solutions Ltd.

Asite Solutions Ltd. - Overview
Asite Solutions Ltd. - Product / Service
Asite Solutions Ltd. - Key offerings
SWOT

15.5 Autodesk Inc.

Autodesk Inc. - Overview
Autodesk Inc. - Business segments
Autodesk Inc. - Key offerings
Autodesk Inc. - Segment focus
SWOT

15.6 Bentley Systems Inc.

Bentley Systems Inc. - Overview
Bentley Systems Inc. - Business segments
Bentley Systems Inc. - Key news
Bentley Systems Inc. - Key offerings
Bentley Systems Inc. - Segment focus
SWOT

15.7 Dassault Systemes SE

Dassault Systemes SE - Overview
Dassault Systemes SE - Business segments
Dassault Systemes SE - Key news
Dassault Systemes SE - Key offerings
Dassault Systemes SE - Segment focus
SWOT

15.8 Glodon Co. Ltd.

Glodon Co. Ltd. - Overview
Glodon Co. Ltd. - Product / Service
Glodon Co. Ltd. - Key offerings
SWOT

15.9 GRAITEC Innovation SAS

GRAITEC Innovation SAS - Overview
GRAITEC Innovation SAS - Product / Service
GRAITEC Innovation SAS - Key offerings
SWOT

15.10 Hexagon AB

Hexagon AB - Overview
Hexagon AB - Business segments
Hexagon AB - Key news
Hexagon AB - Key offerings
Hexagon AB - Segment focus
SWOT

15.11 Nemetschek SE

Nemetschek SE - Overview
Nemetschek SE - Business segments
Nemetschek SE - Key news
Nemetschek SE - Key offerings
Nemetschek SE - Segment focus
SWOT

15.12 Newforma Inc.

Newforma Inc. - Overview
Newforma Inc. - Product / Service
Newforma Inc. - Key offerings
SWOT

15.13 Oracle Corp.

Oracle Corp. - Overview
Oracle Corp. - Business segments
Oracle Corp. - Key news
Oracle Corp. - Key offerings
Oracle Corp. - Segment focus
SWOT

15.14 Procore Technologies Inc.

Procore Technologies Inc. - Overview
Procore Technologies Inc. - Product / Service
Procore Technologies Inc. - Key news
Procore Technologies Inc. - Key offerings
SWOT

15.15 REDTEAM SOFTWARE LLC

REDTEAM SOFTWARE LLC - Overview
REDTEAM SOFTWARE LLC - Product / Service
REDTEAM SOFTWARE LLC - Key offerings
SWOT

15.16 Revizto SA

Revizto SA - Overview
Revizto SA - Product / Service
Revizto SA - Key offerings
SWOT

15.17 Topcon Positioning Systems Inc.

Topcon Positioning Systems Inc. - Overview
Topcon Positioning Systems Inc. - Product / Service
Topcon Positioning Systems Inc. - Key offerings
SWOT

15.18 Trimble Inc.

Trimble Inc. - Overview
Trimble Inc. - Business segments
Trimble Inc. - Key news
Trimble Inc. - Key offerings
Trimble Inc. - Segment focus
SWOT

16. Appendix

16.1 Scope of the report

Market definition
Objectives
Notes and caveats

16.2 Inclusions and exclusions checklist

Inclusions checklist
Exclusions checklist

16.3 Currency conversion rates for US$

16.4 Research methodology

16.5 Data procurement

Information sources

16.6 Data validation

16.7 Validation techniques employed for market sizing

16.8 Data synthesis

16.9 360 degree market analysis

16.10 List of abbreviations

Research Methodology

Technavio presents a detailed picture of the market by way of study, synthesis, and summation of data from multiple sources. The analysts have presented the various facets of the market with a particular focus on identifying the key industry influencers. The data thus presented is comprehensive, reliable, and the result of extensive research, both primary and secondary.

INFORMATION SOURCES

Primary sources

  • Manufacturers and suppliers
  • Channel partners
  • Industry experts
  • Strategic decision makers

Secondary sources

  • Industry journals and periodicals
  • Government data
  • Financial reports of key industry players
  • Historical data
  • Press releases

DATA ANALYSIS

Data Synthesis

  • Collation of data
  • Estimation of key figures
  • Analysis of derived insights

Data Validation

  • Triangulation with data models
  • Reference against proprietary databases
  • Corroboration with industry experts

REPORT WRITING

Qualitative

  • Market drivers
  • Market challenges
  • Market trends
  • Five forces analysis

Quantitative

  • Market size and forecast
  • Market segmentation
  • Geographical insights
  • Competitive landscape

Interested in this report?

Get your sample now to see our research methodology and insights!

Download Now

Frequently Asked Questions

Architectural Engineering And Construction (Aec) Software market growth will increase by USD 9127.4 million during 2026-2030.

The Architectural Engineering And Construction (Aec) Software market is expected to grow at a CAGR of 12.5% during 2026-2030.

Architectural Engineering And Construction (Aec) Software market is segmented by Deployment (On-premises, Cloud) Type (Designing software, Planning software, Buiding software) End-user (Contractors and builders, Architects and designers, Engineers)

ACCA software Spa, Asite Solutions Ltd., Autodesk Inc., Bentley Systems Inc., Causeway Technologies, Computer Methods International Corp., ConstructConnect Inc., CYPE Ingenieros, Dassault Systemes SE, Elecosoft PLC, Glodon Co. Ltd., GRAITEC Innovation SAS, Hexagon AB, InEight Inc., Nemetschek SE, Newforma Inc., Oracle Corp., Procore Technologies Inc., Raken Inc., REDTEAM SOFTWARE LLC, Revizto SA, Topcon Positioning Systems Inc., Trimble Inc. are a few of the key vendors in the Architectural Engineering And Construction (Aec) Software market.

North America will register the highest growth rate of 38.5% among the other regions. Therefore, the Architectural Engineering And Construction (Aec) Software market in North America is expected to garner significant business opportunities for the vendors during the forecast period.

US, Canada, Mexico, Germany, UK, France, Italy, Spain, The Netherlands, China, Japan, India, South Korea, Australia, Indonesia, Brazil, Argentina, Chile, Saudi Arabia, UAE, South Africa, Israel, Turkey

  • Rising adoption of integrated building information modeling and cloud collaboration tools is the driving factor this market.

The Architectural Engineering And Construction (Aec) Software market vendors should focus on grabbing business opportunities from the Deployment segment as it accounted for the largest market share in the base year.
RIA - Research AI Assistant
Ask RIA
