
Automated Industrial Quality Control (QC) Market Analysis, Size, and Forecast 2026-2030: Europe (Germany, UK, and France), North America (US, Canada, and Mexico), APAC (China, Japan, and India), South America (Brazil, Argentina, and Chile), Middle East and Africa (Saudi Arabia, UAE, and South Africa), and Rest of World (ROW)

Automated Industrial Quality Control (QC) Market Analysis, Size, and Forecast 2026-2030:
Europe (Germany, UK, and France), North America (US, Canada, and Mexico), APAC (China, Japan, and India), South America (Brazil, Argentina, and Chile), Middle East and Africa (Saudi Arabia, UAE, and South Africa), and Rest of World (ROW)

Published: Oct 2026 308 Pages SKU: IRTNTR43868

Market Overview at a Glance

$312.4 Mn
Market Opportunity
6.2%
CAGR 2025 - 2030
35.4%
Europe Growth
$300.8 Mn
Automotive industry segment 2024

Automated Industrial Quality Control (Qc) Market Size 2026-2030

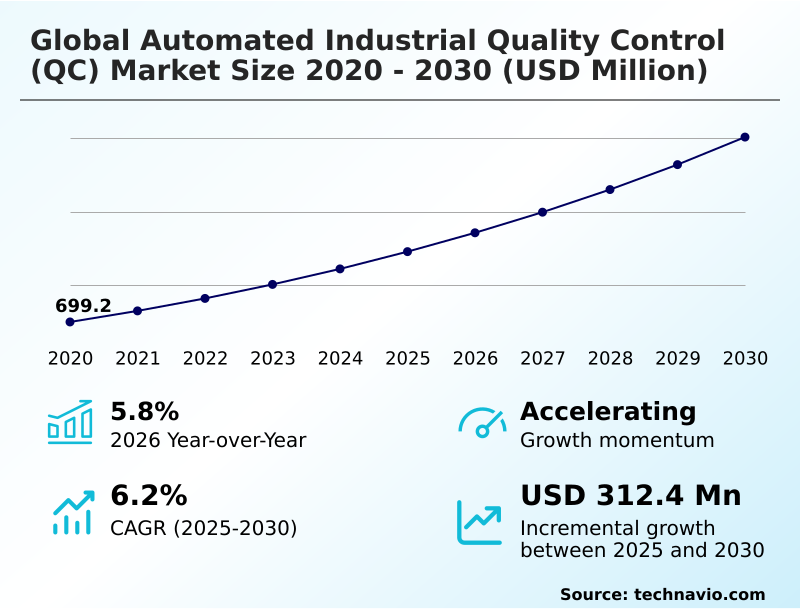
The automated industrial quality control (qc) market size is valued to increase by USD 312.4 million, at a CAGR of 6.2% from 2025 to 2030. Increasing demand for high-quality products and stringent regulatory standards will drive the automated industrial quality control (qc) market.

Major Market Trends & Insights

  • Europe dominated the market and accounted for a 35.4% growth during the forecast period.
  • By End-user - Automotive industry segment was valued at USD 300.8 million in 2024
  • By Solution - Hardware and software segment accounted for the largest market revenue share in 2024

Market Size & Forecast

  • Market Opportunities: USD 504.2 million
  • Market Future Opportunities: USD 312.4 million
  • CAGR from 2025 to 2030 : 6.2%

Market Summary

  • The Automated Industrial Quality Control (QC) Market is experiencing significant operational shifts as manufacturing paradigms move toward autonomous, data-driven frameworks. Escalating consumer expectations and rigorous compliance mandates demand absolute precision, acting as a primary driver for the adoption of sophisticated inspection technologies.
  • For example, in semiconductor fabrication, the integration of deep learning algorithms and high-resolution cameras enables real-time surface defect detection, allowing facilities to increase yield rates and reduce scrap material waste by 22% compared to manual legacy systems. This technological upgrade minimizes human error and guarantees adherence to tight regulatory tolerances.
  • Conversely, a major challenge hindering rapid deployment is the substantial initial capital expenditure required to integrate complex cyber-physical systems into existing infrastructure. Modernizing traditional assembly lines with advanced robotic nondestructive testing tools demands both high upfront costs and specialized technical expertise, creating integration bottlenecks for mid-sized manufacturers.
  • Despite these barriers, the strategic transition toward predictive quality analytics remains essential for businesses seeking to optimize supply chain stability and achieve verifiable, zero-defect manufacturing outcomes.

What will be the Size of the Automated Industrial Quality Control (Qc) Market during the forecast period?
Get Key Insights on Market Forecast (PDF) Get Free Sample

How is the Automated Industrial Quality Control (Qc) Market Segmented?

The automated industrial quality control (qc) industry research report provides comprehensive data (region-wise segment analysis), with forecasts and estimates in "USD million" for the period 2026-2030, as well as historical data from 2020-2024 for the following segments.

  • End-user
    • Automotive industry
    • Metal industry
    • Electronics industry
    • Others
  • Solution
    • Hardware and software
    • Service
  • Technology
    • Machine vision
    • Automated optical inspection
    • Coordinate measuring machine
    • X-ray inspection
    • Others
  • Geography
    • Europe
      • Germany
      • UK
      • France
      • Italy
      • Spain
      • The Netherlands
    • North America
      • US
      • Canada
      • Mexico
    • APAC
      • China
      • Japan
      • India
      • South Korea
      • Australia
      • Indonesia
    • South America
      • Brazil
      • Argentina
      • Chile
    • Middle East and Africa
      • Saudi Arabia
      • UAE
      • South Africa
      • Israel
      • Turkey

By End-user Insights

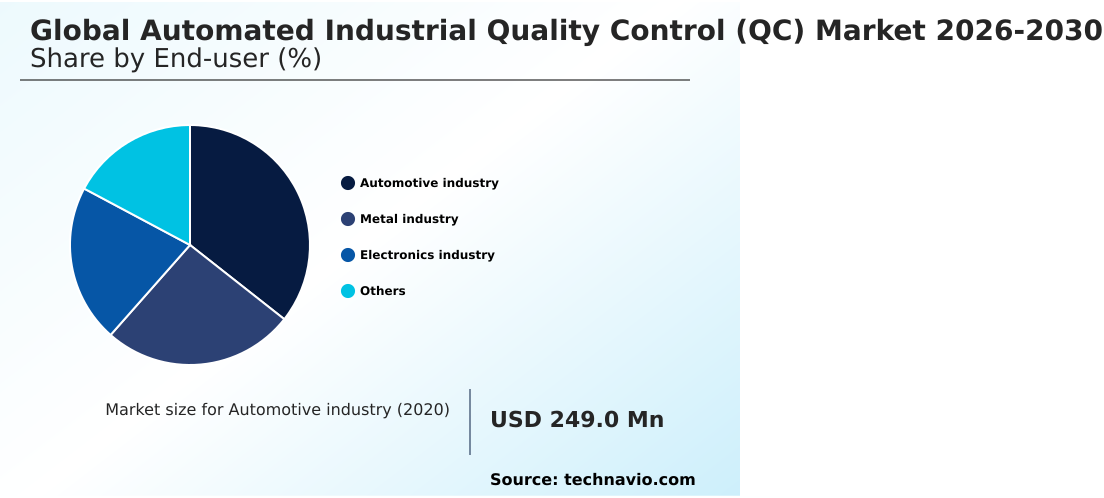
The automotive industry segment is estimated to witness significant growth during the forecast period.

The automotive industry segment within the Automated Industrial Quality Control (QC) landscape is transforming due to rigorous safety standards. As manufacturers shift toward electric vehicles and autonomous driving, zero-defect manufacturing becomes critical for battery cells and sensitive electronic components.

Manual inspection methods are inadequate for verifying intricate assemblies like lidar calibration or managing high-speed telemetry data. By integrating advanced machine vision and robotic nondestructive testing, companies have achieved a 30% reduction in processing time.

The deployment of inline inspection systems allows for continuous defect detection, improving overall error detection accuracy by 15% compared to traditional sampling.

This operational shift ensures consistent product reliability, mitigates safety risks, and maintains regulatory compliance across highly complex automotive supply chains.
Get Free Sample

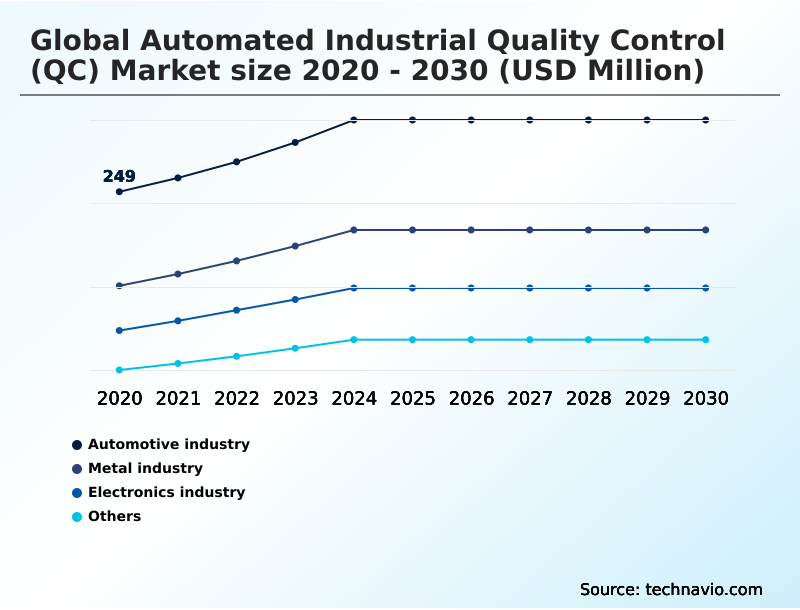
The Automotive industry segment was valued at USD 300.8 million in 2024 and showed a gradual increase during the forecast period.
Get Free Sample

Regional Analysis

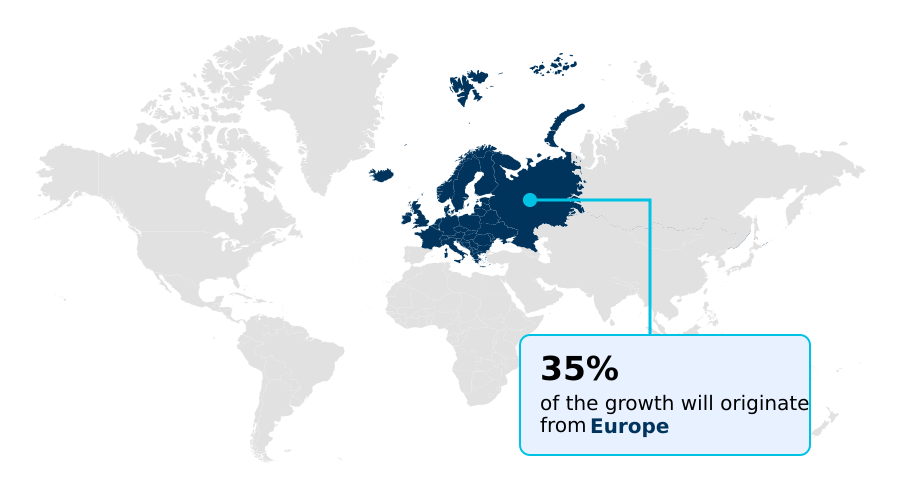
Europe is estimated to contribute 35.4% to the growth of the global market during the forecast period.Technavio’s analysts have elaborately explained the regional trends and drivers that shape the market during the forecast period.
See How Automated Industrial Quality Control (Qc) Market Demand is Rising in Europe Get Free Sample

The Automated Industrial Quality Control (QC) landscape exhibits diverse regional adoption trajectories shaped by regulatory frameworks and industrial maturity.

Europe demonstrates a highly structured approach driven by rigorous safety mandates, leading to a 35% higher penetration rate of advanced metrology equipment compared to South America.

European facilities heavily integrate thermal imaging and ultrasonic testing to evaluate aerospace components, achieving up to 20% improvements in overall operational efficiency.

In contrast, the APAC region relies heavily on real-time data collection and statistical process control to manage massive consumer electronics production volumes.

Consequently, APAC manufacturers are rapidly adopting quality-as-a-service platforms to minimize upfront costs while ensuring strict dimensional accuracy across high-speed assembly lines. These regional discrepancies highlight how localized labor dynamics dictate supply chain resilience and technology deployment.

Market Dynamics

Our researchers analyzed the data with 2025 as the base year, along with the key drivers, trends, and challenges. A holistic analysis of drivers will help companies refine their marketing strategies to gain a competitive advantage.

  • The continuous evolution of the Automated Industrial Quality Control (QC) landscape is fundamentally altering how modern production facilities manage compliance and operational planning. As supply chains become increasingly intricate, the reliance on manual validation is rapidly being replaced by highly sophisticated digital architectures.
  • For instance, the deployment of inline 3d automated optical inspection allows electronics manufacturers to proactively identify micro-level soldering errors before final assembly, yielding defect capture rates nearly 40% higher than traditional sample-based methods. This immediate feedback loop is critical for maintaining high-yield outputs.
  • Furthermore, facilities are leveraging deep learning based surface defect detection to evaluate complex geometries and natural material variations, a capability that vastly outperforms rule-based programming in identifying subtle cosmetic anomalies. In heavy industries, the integration of robotic nondestructive testing for aerospace components ensures that structural integrity is maintained without compromising production speed, directly supporting rigorous safety mandates.
  • Simultaneously, the industry is witnessing a strategic shift in software deployment, with organizations increasingly adopting cloud based quality management as a service to aggregate and analyze factory-wide data. This centralized approach facilitates predictive quality analytics in smart manufacturing, enabling decision-makers to anticipate machine wear and process deviations before they manifest as critical failures.
  • By comparing real-time operational data against historical benchmarks, supply chain managers can optimize maintenance schedules and significantly reduce unexpected downtime, ultimately driving more resilient and cost-effective manufacturing operations.
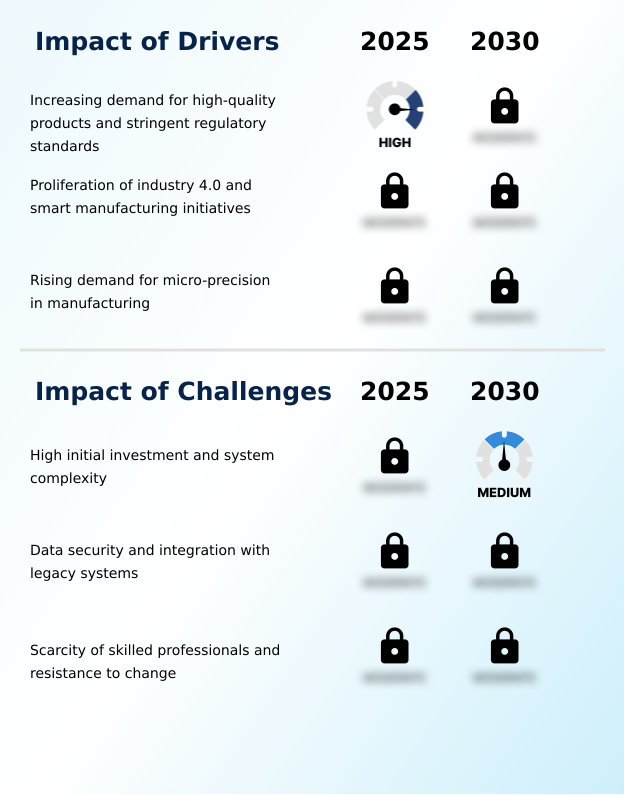
What are the key market drivers leading to the rise in the adoption of Automated Industrial Quality Control (Qc) Industry?

  • The market is primarily propelled by the escalating demand for high-quality products and the imperative to comply with increasingly stringent global regulatory standards.

  • The escalating demand for absolute micro-precision in semiconductor fabrication and medical device manufacturing serves as a primary driver for the Automated Industrial Quality Control (QC) landscape.
  • Because component miniaturization renders human inspection impossible, manufacturers are compelled to adopt sophisticated interferometry and computed tomography solutions.
  • Integrating these technologies alongside factory automation sensors allows facilities to verify structural integrity at the sub-micron level, directly driving a 35% yield improvement. Furthermore, strict international safety mandates force organizations to implement comprehensive traceability protocols for regulatory compliance.
  • By deploying digital twin technology alongside automated Xray inspection, companies have improved compliance reporting efficiency by 22%.
  • This operational shift guarantees that products meet exacting tolerances, thereby protecting brand reputation and mitigating the immense financial risks associated with large-scale product recalls.

What are the market trends shaping the Automated Industrial Quality Control (Qc) Industry?

  • A prominent trend shaping the market landscape is the strategic transition from offline quality inspection to integrated in-line and at-line metrology. This shift enables continuous real-time data collection and proactive process optimization directly on the factory floor.

  • A defining trend within the Automated Industrial Quality Control (QC) sector is the integration of artificial intelligence and deep learning algorithms into standard inspection platforms. This shift is occurring because traditional programming struggles to process unpredictable textures on items like printed circuit boards efficiently.
  • By utilizing neural networks and high-resolution cameras, manufacturers can drastically improve surface defect detection, leading to a 30% reduction in false-reject rates. Furthermore, the transition toward cloud-based quality management and subscription-based models enables facilities to aggregate automated optical inspection data across multiple sites, improving global forecast accuracy by 18%.
  • This interconnected approach empowers enterprises to deploy predictive quality analytics, transforming quality assurance from a post-production bottleneck into a dynamic, real-time driver of overall factory efficiency and automated oversight.

What challenges does the Automated Industrial Quality Control (Qc) Industry face during its growth?

  • The substantial initial capital expenditure and the inherent technical complexity of system integration present significant barriers to widespread adoption.

  • A formidable challenge restricting the widespread adoption of Automated Industrial Quality Control (QC) is the substantial capital expenditure and complex robotics integration required to modernize outdated factory floors. Because many older factories operate on disconnected legacy systems, linking them with modern industrial internet of things platforms and sophisticated 3D laser scanners demands specialized middleware development.
  • This technical friction frequently delays deployment timelines for a smart manufacturing ecosystem, inflating initial implementation costs by up to 25% compared to standardized installations. Additionally, the transmission of data through new cyber-physical systems exposes organizations to cybersecurity risks.
  • The scarcity of personnel skilled in calibrating coordinate measuring machines and implementing machine learning architectures occasionally reduces expected efficiency, stalling optimal defect rate reduction targets by 15% as existing teams struggle to adapt.

Exclusive Technavio Analysis on Customer Landscape

The automated industrial quality control (qc) market forecasting report includes the adoption lifecycle of the market, covering from the innovator’s stage to the laggard’s stage. It focuses on adoption rates in different regions based on penetration. Furthermore, the automated industrial quality control (qc) market report also includes key purchase criteria and drivers of price sensitivity to help companies evaluate and develop their market growth analysis strategies.
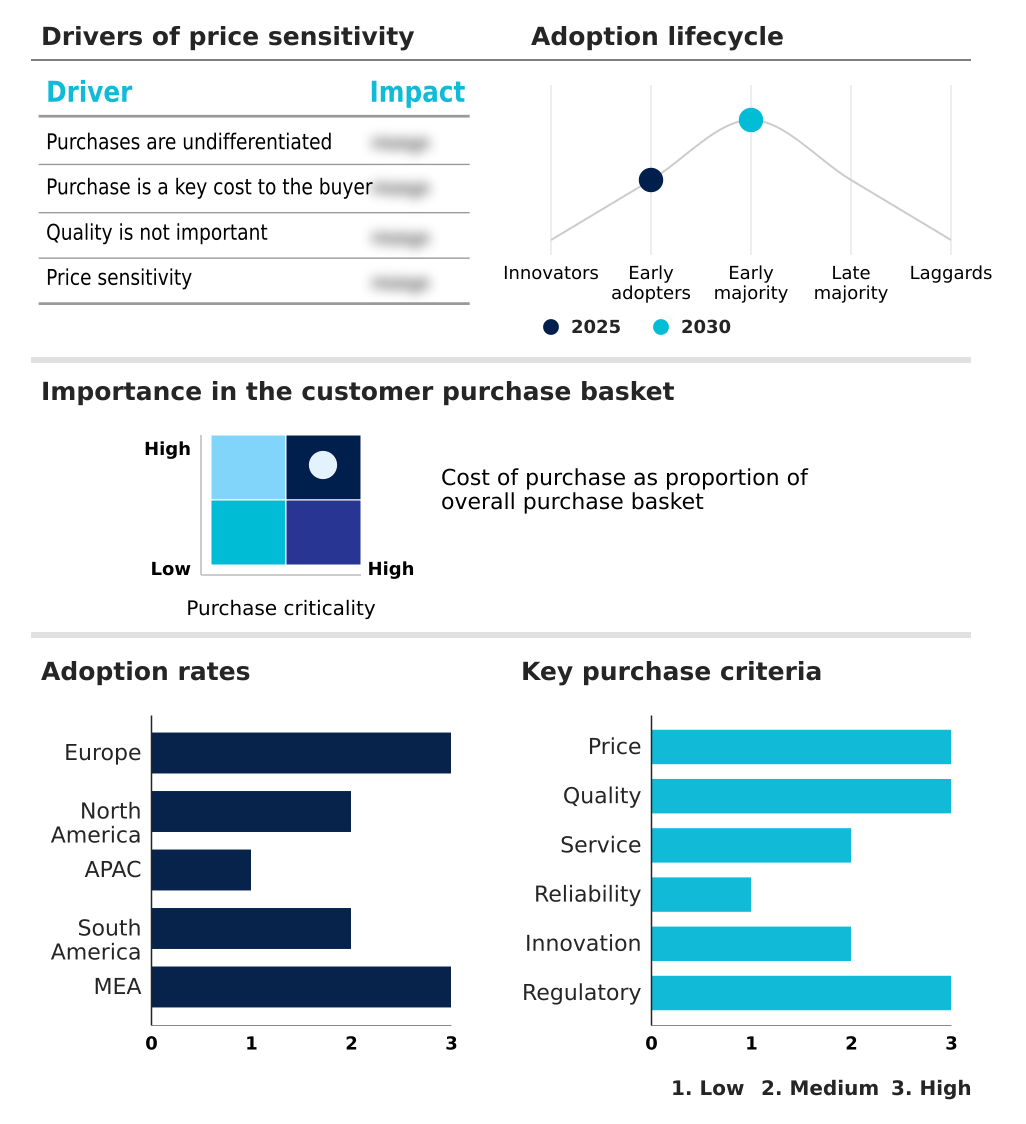
Customer Landscape of Automated Industrial Quality Control (Qc) Industry

Competitive Landscape

Companies are implementing various strategies, such as strategic alliances, automated industrial quality control (qc) market forecast, partnerships, mergers and acquisitions, geographical expansion, and product/service launches, to enhance their presence in the industry.

ABB Ltd. - The provider delivers automated industrial quality control solutions, including integrated vision software and flexible inspection systems designed to enhance precision and optimize manufacturing processes across diverse industrial applications.

The industry research and growth report includes detailed analyses of the competitive landscape of the market and information about key companies, including:

  • ABB Ltd.
  • Balluff GmbH
  • Banner Engineering Corp.
  • Basler AG
  • Baumer Holding AG
  • Carl Zeiss AG
  • Cognex Corp.
  • Creaform Inc.
  • FANUC Corp.
  • FARO Technologies Inc.
  • Hexagon AB
  • ISRA VISION GmbH
  • Keyence Corp.
  • Nikon Corp.
  • OMRON Corp.
  • Renishaw Plc
  • SICK AG
  • Teledyne Technologies Inc.
  • Universal Robots AS
  • Yaskawa Electric Corp.

Qualitative and quantitative analysis of companies has been conducted to help clients understand the wider business environment as well as the strengths and weaknesses of key industry players. Data is qualitatively analyzed to categorize companies as pure play, category-focused, industry-focused, and diversified; it is quantitatively analyzed to categorize companies as dominant, leading, strong, tentative, and weak.

Recent Development and News in Automated industrial quality control (qc) market

  • In the Electrical Components and Equipment industry, the aggressive shift toward additive manufacturing for complex geometries has necessitated stricter structural validation protocols, directly impacting Automated Industrial Quality Control (QC) demand by increasing the integration of computed tomography and 3D laser scanners to achieve complete internal defect detection.
  • The implementation of regional sustainable products regulations has enforced stringent lifecycle traceability mandates on heavy machinery producers, accelerating the adoption of cloud-based quality management platforms to maintain verifiable quality-as-a-service compliance records.
  • The transition toward high-density semiconductor fabrication utilizing extreme ultraviolet lithography has severely reduced acceptable error margins, compelling facilities to deploy inline 3d automated optical inspection and interferometry tools to cut micro-level defect rates by over 40%.
  • The widespread deployment of 5G infrastructure equipment has triggered a massive scale-up in printed circuit boards manufacturing, driving the requirement for high-resolution cameras and deep learning algorithms to continuously monitor solder joint integrity at peak operational speeds.

Dive into Technavio’s robust research methodology, blending expert interviews, extensive data synthesis, and validated models for unparalleled Automated Industrial Quality Control (Qc) Market insights. See full methodology.

Market Scope
Page number 308
Base year 2025
Historic period 2020-2024
Forecast period 2026-2030
Growth momentum & CAGR Accelerate at a CAGR of 6.2%
Market growth 2026-2030 USD 312.4 million
Market structure Fragmented
YoY growth 2025-2026(%) 5.8%
Key countries Germany, UK, France, Italy, Spain, The Netherlands, US, Canada, Mexico, China, Japan, India, South Korea, Australia, Indonesia, Brazil, Argentina, Chile, Saudi Arabia, UAE, South Africa, Israel and Turkey
Competitive landscape Leading Companies, Market Positioning of Companies, Competitive Strategies, and Industry Risks

Request Free Sample

Research Analyst Overview

  • The Automated Industrial Quality Control (QC) sector is experiencing a paradigm shift as organizations move from reactive flaw identification to proactive process optimization. Boardrooms are increasingly linking the adoption of digital twin technology directly to strategic compliance and budgeting decisions.
  • By simulating production parameters and integrating statistical process control, executives can accurately forecast potential quality deviations, reducing material scrap costs by 25% compared to conventional offline testing. The deployment of advanced metrology equipment and industrial internet of things connectivity facilitates continuous monitoring across global manufacturing footprints.
  • Furthermore, the utilization of thermal imaging and ultrasonic testing provides critical insights into internal component integrity, mitigating catastrophic failure risks in high-stakes environments. These technological integrations allow decision-makers to streamline regulatory reporting and maintain rigorous safety standards without sacrificing production velocity.
  • Ultimately, the transition toward intelligent, automated oversight ensures that enterprises can sustain competitive differentiation while safeguarding their supply chains against the cascading financial impacts of product defects and compliance breaches.

What are the Key Data Covered in this Automated Industrial Quality Control (Qc) Market Research and Growth Report?

  • What is the expected growth of the Automated Industrial Quality Control (Qc) Market between 2026 and 2030?

    • USD 312.4 million, at a CAGR of 6.2%

  • What segmentation does the market report cover?

    • The report is segmented by End-user (Automotive industry, Metal industry, Electronics industry, and Others), Solution (Hardware and software, and Service), Technology (Machine vision, Automated optical inspection, Coordinate measuring machine, X-ray inspection, and Others) and Geography (Europe, North America, APAC, South America, Middle East and Africa)

  • Which regions are analyzed in the report?

    • Europe, North America, APAC, South America and Middle East and Africa

  • What are the key growth drivers and market challenges?

    • Increasing demand for high-quality products and stringent regulatory standards, High initial investment and system complexity

  • Who are the major players in the Automated Industrial Quality Control (Qc) Market?

    • ABB Ltd., Balluff GmbH, Banner Engineering Corp., Basler AG, Baumer Holding AG, Carl Zeiss AG, Cognex Corp., Creaform Inc., FANUC Corp., FARO Technologies Inc., Hexagon AB, ISRA VISION GmbH, Keyence Corp., Nikon Corp., OMRON Corp., Renishaw Plc, SICK AG, Teledyne Technologies Inc., Universal Robots AS and Yaskawa Electric Corp.

Market Research Insights

  • The Automated Industrial Quality Control (QC) sector is fundamentally restructuring how enterprises approach product reliability and regulatory compliance. By transitioning away from manual legacy systems and adopting artificial intelligence, manufacturers have achieved a 28% reduction in product recall incidents. The integration of high-resolution cameras enables precise real-time data collection, cutting false-positive defect classifications by nearly 15%.
  • Furthermore, the shift toward subscription-based models for inspection software allows smaller facilities to access advanced analytics while lowering initial software deployment costs by 20%. These measurable operational efficiency gains demonstrate the critical role of automated frameworks in achieving sustainable, zero-defect manufacturing and protecting brand equity across competitive industrial markets.

We can help! Our analysts can customize this automated industrial quality control (qc) market research report to meet your requirements.

Get in touch

1. Executive Summary

1.1 Market overview

Executive Summary - Chart on Market Overview
Executive Summary - Data Table on Market Overview
Executive Summary - Chart on Global Market Characteristics
Executive Summary - Chart on Market by Geography
Executive Summary - Chart on Market Segmentation by End-user
Executive Summary - Chart on Market Segmentation by Solution
Executive Summary - Chart on Market Segmentation by Technology
Executive Summary - Chart on Incremental Growth
Executive Summary - Data Table on Incremental Growth
Executive Summary - Chart on Company Market Positioning

2. Technavio Analysis

2.1 Analysis of price sensitivity, lifecycle, customer purchase basket, adoption rates, and purchase criteria

2.2 Criticality of inputs and Factors of differentiation

Chart on Overview on criticality of inputs and factors of differentiation

2.3 Factors of disruption

Chart on Overview on factors of disruption

2.4 Impact of drivers and challenges

Chart on Impact of drivers and challenges in 2025 and 2030

3. Market Landscape

3.1 Market ecosystem

Chart on Parent Market
Data Table on - Parent Market

3.2 Market characteristics

Chart on Market characteristics analysis

3.3 Value chain analysis

Chart on Value chain analysis

4. Market Sizing

4.1 Market definition

Data Table on Offerings of companies included in the market definition

4.2 Market segment analysis

Market segments

4.3 Market size 2025

4.4 Market outlook: Forecast for 2025-2030

Chart on Global - Market size and forecast 2025-2030 ($ million)
Data Table on Global - Market size and forecast 2025-2030 ($ million)
Chart on Global Market: Year-over-year growth 2025-2030 (%)
Data Table on Global Market: Year-over-year growth 2025-2030 (%)

5. Historic Market Size

5.1 Global Automated Industrial Quality Control (QC) Market 2020 - 2024

Historic Market Size - Data Table on Global Automated Industrial Quality Control (QC) Market 2020 - 2024 ($ million)

5.2 End-user segment analysis 2020 - 2024

Historic Market Size - End-user Segment 2020 - 2024 ($ million)

5.3 Solution segment analysis 2020 - 2024

Historic Market Size - Solution Segment 2020 - 2024 ($ million)

5.4 Technology segment analysis 2020 - 2024

Historic Market Size - Technology Segment 2020 - 2024 ($ million)

5.5 Geography segment analysis 2020 - 2024

Historic Market Size - Geography Segment 2020 - 2024 ($ million)

5.6 Country segment analysis 2020 - 2024

Historic Market Size - Country Segment 2020 - 2024 ($ million)

6. Qualitative Analysis

6.1 Impact of AI on Global Automated Industrial Quality Control (QC) Market

6.2 Impact of Geopolitical Conflicts on Global Automated Industrial Quality Control (QC) Market

7. Five Forces Analysis

7.1 Five forces summary

Five forces analysis - Comparison between 2025 and 2030

7.2 Bargaining power of buyers

Bargaining power of buyers - Impact of key factors 2025 and 2030

7.3 Bargaining power of suppliers

Bargaining power of suppliers - Impact of key factors in 2025 and 2030

7.4 Threat of new entrants

Threat of new entrants - Impact of key factors in 2025 and 2030

7.5 Threat of substitutes

Threat of substitutes - Impact of key factors in 2025 and 2030

7.6 Threat of rivalry

Threat of rivalry - Impact of key factors in 2025 and 2030

7.7 Market condition

Chart on Market condition - Five forces 2025 and 2030

8. Market Segmentation by End-user

8.1 Market segments

Chart on End-user - Market share 2025-2030 (%)
Data Table on End-user - Market share 2025-2030 (%)

8.2 Comparison by End-user

Chart on Comparison by End-user
Data Table on Comparison by End-user

8.3 Automotive industry - Market size and forecast 2025-2030

Chart on Automotive industry - Market size and forecast 2025-2030 ($ million)
Data Table on Automotive industry - Market size and forecast 2025-2030 ($ million)
Chart on Automotive industry - Year-over-year growth 2025-2030 (%)
Data Table on Automotive industry - Year-over-year growth 2025-2030 (%)

8.4 Metal industry - Market size and forecast 2025-2030

Chart on Metal industry - Market size and forecast 2025-2030 ($ million)
Data Table on Metal industry - Market size and forecast 2025-2030 ($ million)
Chart on Metal industry - Year-over-year growth 2025-2030 (%)
Data Table on Metal industry - Year-over-year growth 2025-2030 (%)

8.5 Electronics industry - Market size and forecast 2025-2030

Chart on Electronics industry - Market size and forecast 2025-2030 ($ million)
Data Table on Electronics industry - Market size and forecast 2025-2030 ($ million)
Chart on Electronics industry - Year-over-year growth 2025-2030 (%)
Data Table on Electronics industry - Year-over-year growth 2025-2030 (%)

8.6 Others - Market size and forecast 2025-2030

Chart on Others - Market size and forecast 2025-2030 ($ million)
Data Table on Others - Market size and forecast 2025-2030 ($ million)
Chart on Others - Year-over-year growth 2025-2030 (%)
Data Table on Others - Year-over-year growth 2025-2030 (%)

8.7 Market opportunity by End-user

Market opportunity by End-user ($ million)
Data Table on Market opportunity by End-user ($ million)

9. Market Segmentation by Solution

9.1 Market segments

Chart on Solution - Market share 2025-2030 (%)
Data Table on Solution - Market share 2025-2030 (%)

9.2 Comparison by Solution

Chart on Comparison by Solution
Data Table on Comparison by Solution

9.3 Hardware and software - Market size and forecast 2025-2030

Chart on Hardware and software - Market size and forecast 2025-2030 ($ million)
Data Table on Hardware and software - Market size and forecast 2025-2030 ($ million)
Chart on Hardware and software - Year-over-year growth 2025-2030 (%)
Data Table on Hardware and software - Year-over-year growth 2025-2030 (%)

9.4 Service - Market size and forecast 2025-2030

Chart on Service - Market size and forecast 2025-2030 ($ million)
Data Table on Service - Market size and forecast 2025-2030 ($ million)
Chart on Service - Year-over-year growth 2025-2030 (%)
Data Table on Service - Year-over-year growth 2025-2030 (%)

9.5 Market opportunity by Solution

Market opportunity by Solution ($ million)
Data Table on Market opportunity by Solution ($ million)

10. Market Segmentation by Technology

10.1 Market segments

Chart on Technology - Market share 2025-2030 (%)
Data Table on Technology - Market share 2025-2030 (%)

10.2 Comparison by Technology

Chart on Comparison by Technology
Data Table on Comparison by Technology

10.3 Machine vision - Market size and forecast 2025-2030

Chart on Machine vision - Market size and forecast 2025-2030 ($ million)
Data Table on Machine vision - Market size and forecast 2025-2030 ($ million)
Chart on Machine vision - Year-over-year growth 2025-2030 (%)
Data Table on Machine vision - Year-over-year growth 2025-2030 (%)

10.4 Automated optical inspection - Market size and forecast 2025-2030

Chart on Automated optical inspection - Market size and forecast 2025-2030 ($ million)
Data Table on Automated optical inspection - Market size and forecast 2025-2030 ($ million)
Chart on Automated optical inspection - Year-over-year growth 2025-2030 (%)
Data Table on Automated optical inspection - Year-over-year growth 2025-2030 (%)

10.5 Coordinate measuring machine - Market size and forecast 2025-2030

Chart on Coordinate measuring machine - Market size and forecast 2025-2030 ($ million)
Data Table on Coordinate measuring machine - Market size and forecast 2025-2030 ($ million)
Chart on Coordinate measuring machine - Year-over-year growth 2025-2030 (%)
Data Table on Coordinate measuring machine - Year-over-year growth 2025-2030 (%)

10.6 X-ray inspection - Market size and forecast 2025-2030

Chart on X-ray inspection - Market size and forecast 2025-2030 ($ million)
Data Table on X-ray inspection - Market size and forecast 2025-2030 ($ million)
Chart on X-ray inspection - Year-over-year growth 2025-2030 (%)
Data Table on X-ray inspection - Year-over-year growth 2025-2030 (%)

10.7 Others - Market size and forecast 2025-2030

Chart on Others - Market size and forecast 2025-2030 ($ million)
Data Table on Others - Market size and forecast 2025-2030 ($ million)
Chart on Others - Year-over-year growth 2025-2030 (%)
Data Table on Others - Year-over-year growth 2025-2030 (%)

10.8 Market opportunity by Technology

Market opportunity by Technology ($ million)
Data Table on Market opportunity by Technology ($ million)

11. Customer Landscape

11.1 Customer landscape overview

Analysis of price sensitivity, lifecycle, customer purchase basket, adoption rates, and purchase criteria

12. Geographic Landscape

12.1 Geographic segmentation

Chart on Market share by geography 2025-2030 (%)
Data Table on Market share by geography 2025-2030 (%)

12.2 Geographic comparison

Chart on Geographic comparison
Data Table on Geographic comparison

12.3 Europe - Market size and forecast 2025-2030

Chart on Europe - Market size and forecast 2025-2030 ($ million)
Data Table on Europe - Market size and forecast 2025-2030 ($ million)
Chart on Europe - Year-over-year growth 2025-2030 (%)
Data Table on Europe - Year-over-year growth 2025-2030 (%)
Chart on Regional Comparison - Europe
Data Table on Regional Comparison - Europe

12.3.1 Germany - Market size and forecast 2025-2030

Chart on Germany - Market size and forecast 2025-2030 ($ million)
Data Table on Germany - Market size and forecast 2025-2030 ($ million)
Chart on Germany - Year-over-year growth 2025-2030 (%)
Data Table on Germany - Year-over-year growth 2025-2030 (%)

12.3.2 UK - Market size and forecast 2025-2030

Chart on UK - Market size and forecast 2025-2030 ($ million)
Data Table on UK - Market size and forecast 2025-2030 ($ million)
Chart on UK - Year-over-year growth 2025-2030 (%)
Data Table on UK - Year-over-year growth 2025-2030 (%)

12.3.3 France - Market size and forecast 2025-2030

Chart on France - Market size and forecast 2025-2030 ($ million)
Data Table on France - Market size and forecast 2025-2030 ($ million)
Chart on France - Year-over-year growth 2025-2030 (%)
Data Table on France - Year-over-year growth 2025-2030 (%)

12.3.4 Italy - Market size and forecast 2025-2030

Chart on Italy - Market size and forecast 2025-2030 ($ million)
Data Table on Italy - Market size and forecast 2025-2030 ($ million)
Chart on Italy - Year-over-year growth 2025-2030 (%)
Data Table on Italy - Year-over-year growth 2025-2030 (%)

12.3.5 Spain - Market size and forecast 2025-2030

Chart on Spain - Market size and forecast 2025-2030 ($ million)
Data Table on Spain - Market size and forecast 2025-2030 ($ million)
Chart on Spain - Year-over-year growth 2025-2030 (%)
Data Table on Spain - Year-over-year growth 2025-2030 (%)

12.3.6 The Netherlands - Market size and forecast 2025-2030

Chart on The Netherlands - Market size and forecast 2025-2030 ($ million)
Data Table on The Netherlands - Market size and forecast 2025-2030 ($ million)
Chart on The Netherlands - Year-over-year growth 2025-2030 (%)
Data Table on The Netherlands - Year-over-year growth 2025-2030 (%)

12.4 North America - Market size and forecast 2025-2030

Chart on North America - Market size and forecast 2025-2030 ($ million)
Data Table on North America - Market size and forecast 2025-2030 ($ million)
Chart on North America - Year-over-year growth 2025-2030 (%)
Data Table on North America - Year-over-year growth 2025-2030 (%)
Chart on Regional Comparison - North America
Data Table on Regional Comparison - North America

12.4.1 US - Market size and forecast 2025-2030

Chart on US - Market size and forecast 2025-2030 ($ million)
Data Table on US - Market size and forecast 2025-2030 ($ million)
Chart on US - Year-over-year growth 2025-2030 (%)
Data Table on US - Year-over-year growth 2025-2030 (%)

12.4.2 Canada - Market size and forecast 2025-2030

Chart on Canada - Market size and forecast 2025-2030 ($ million)
Data Table on Canada - Market size and forecast 2025-2030 ($ million)
Chart on Canada - Year-over-year growth 2025-2030 (%)
Data Table on Canada - Year-over-year growth 2025-2030 (%)

12.4.3 Mexico - Market size and forecast 2025-2030

Chart on Mexico - Market size and forecast 2025-2030 ($ million)
Data Table on Mexico - Market size and forecast 2025-2030 ($ million)
Chart on Mexico - Year-over-year growth 2025-2030 (%)
Data Table on Mexico - Year-over-year growth 2025-2030 (%)

12.5 APAC - Market size and forecast 2025-2030

Chart on APAC - Market size and forecast 2025-2030 ($ million)
Data Table on APAC - Market size and forecast 2025-2030 ($ million)
Chart on APAC - Year-over-year growth 2025-2030 (%)
Data Table on APAC - Year-over-year growth 2025-2030 (%)
Chart on Regional Comparison - APAC
Data Table on Regional Comparison - APAC

12.5.1 China - Market size and forecast 2025-2030

Chart on China - Market size and forecast 2025-2030 ($ million)
Data Table on China - Market size and forecast 2025-2030 ($ million)
Chart on China - Year-over-year growth 2025-2030 (%)
Data Table on China - Year-over-year growth 2025-2030 (%)

12.5.2 Japan - Market size and forecast 2025-2030

Chart on Japan - Market size and forecast 2025-2030 ($ million)
Data Table on Japan - Market size and forecast 2025-2030 ($ million)
Chart on Japan - Year-over-year growth 2025-2030 (%)
Data Table on Japan - Year-over-year growth 2025-2030 (%)

12.5.3 India - Market size and forecast 2025-2030

Chart on India - Market size and forecast 2025-2030 ($ million)
Data Table on India - Market size and forecast 2025-2030 ($ million)
Chart on India - Year-over-year growth 2025-2030 (%)
Data Table on India - Year-over-year growth 2025-2030 (%)

12.5.4 South Korea - Market size and forecast 2025-2030

Chart on South Korea - Market size and forecast 2025-2030 ($ million)
Data Table on South Korea - Market size and forecast 2025-2030 ($ million)
Chart on South Korea - Year-over-year growth 2025-2030 (%)
Data Table on South Korea - Year-over-year growth 2025-2030 (%)

12.5.5 Australia - Market size and forecast 2025-2030

Chart on Australia - Market size and forecast 2025-2030 ($ million)
Data Table on Australia - Market size and forecast 2025-2030 ($ million)
Chart on Australia - Year-over-year growth 2025-2030 (%)
Data Table on Australia - Year-over-year growth 2025-2030 (%)

12.5.6 Indonesia - Market size and forecast 2025-2030

Chart on Indonesia - Market size and forecast 2025-2030 ($ million)
Data Table on Indonesia - Market size and forecast 2025-2030 ($ million)
Chart on Indonesia - Year-over-year growth 2025-2030 (%)
Data Table on Indonesia - Year-over-year growth 2025-2030 (%)

12.6 South America - Market size and forecast 2025-2030

Chart on South America - Market size and forecast 2025-2030 ($ million)
Data Table on South America - Market size and forecast 2025-2030 ($ million)
Chart on South America - Year-over-year growth 2025-2030 (%)
Data Table on South America - Year-over-year growth 2025-2030 (%)
Chart on Regional Comparison - South America
Data Table on Regional Comparison - South America

12.6.1 Brazil - Market size and forecast 2025-2030

Chart on Brazil - Market size and forecast 2025-2030 ($ million)
Data Table on Brazil - Market size and forecast 2025-2030 ($ million)
Chart on Brazil - Year-over-year growth 2025-2030 (%)
Data Table on Brazil - Year-over-year growth 2025-2030 (%)

12.6.2 Argentina - Market size and forecast 2025-2030

Chart on Argentina - Market size and forecast 2025-2030 ($ million)
Data Table on Argentina - Market size and forecast 2025-2030 ($ million)
Chart on Argentina - Year-over-year growth 2025-2030 (%)
Data Table on Argentina - Year-over-year growth 2025-2030 (%)

12.6.3 Chile - Market size and forecast 2025-2030

Chart on Chile - Market size and forecast 2025-2030 ($ million)
Data Table on Chile - Market size and forecast 2025-2030 ($ million)
Chart on Chile - Year-over-year growth 2025-2030 (%)
Data Table on Chile - Year-over-year growth 2025-2030 (%)

12.7 Middle East and Africa - Market size and forecast 2025-2030

Chart on Middle East and Africa - Market size and forecast 2025-2030 ($ million)
Data Table on Middle East and Africa - Market size and forecast 2025-2030 ($ million)
Chart on Middle East and Africa - Year-over-year growth 2025-2030 (%)
Data Table on Middle East and Africa - Year-over-year growth 2025-2030 (%)
Chart on Regional Comparison - Middle East and Africa
Data Table on Regional Comparison - Middle East and Africa

12.7.1 Saudi Arabia - Market size and forecast 2025-2030

Chart on Saudi Arabia - Market size and forecast 2025-2030 ($ million)
Data Table on Saudi Arabia - Market size and forecast 2025-2030 ($ million)
Chart on Saudi Arabia - Year-over-year growth 2025-2030 (%)
Data Table on Saudi Arabia - Year-over-year growth 2025-2030 (%)

12.7.2 UAE - Market size and forecast 2025-2030

Chart on UAE - Market size and forecast 2025-2030 ($ million)
Data Table on UAE - Market size and forecast 2025-2030 ($ million)
Chart on UAE - Year-over-year growth 2025-2030 (%)
Data Table on UAE - Year-over-year growth 2025-2030 (%)

12.7.3 South Africa - Market size and forecast 2025-2030

Chart on South Africa - Market size and forecast 2025-2030 ($ million)
Data Table on South Africa - Market size and forecast 2025-2030 ($ million)
Chart on South Africa - Year-over-year growth 2025-2030 (%)
Data Table on South Africa - Year-over-year growth 2025-2030 (%)

12.7.4 Israel - Market size and forecast 2025-2030

Chart on Israel - Market size and forecast 2025-2030 ($ million)
Data Table on Israel - Market size and forecast 2025-2030 ($ million)
Chart on Israel - Year-over-year growth 2025-2030 (%)
Data Table on Israel - Year-over-year growth 2025-2030 (%)

12.7.5 Turkey - Market size and forecast 2025-2030

Chart on Turkey - Market size and forecast 2025-2030 ($ million)
Data Table on Turkey - Market size and forecast 2025-2030 ($ million)
Chart on Turkey - Year-over-year growth 2025-2030 (%)
Data Table on Turkey - Year-over-year growth 2025-2030 (%)

12.8 Market opportunity by geography

Market opportunity by geography ($ million)
Data Tables on Market opportunity by geography ($ million)

13. Drivers, Challenges, and Opportunity

13.1 Market drivers

Increasing demand for high-quality products and stringent regulatory standards
Proliferation of industry 4.0 and smart manufacturing initiatives
Rising demand for micro-precision in manufacturing

13.2 Market challenges

High initial investment and system complexity
Data security and integration with legacy systems
Scarcity of skilled professionals and resistance to change

13.3 Impact of drivers and challenges

Impact of drivers and challenges in 2025 and 2030

13.4 Market opportunities

Shift from offline to in-line and at-line metrology
Increasing integration of AI and deep learning
Emergence of cloud-based quality management and quality as service models

14. Competitive Landscape

14.1 Overview

14.2

Overview on criticality of inputs and factors of differentiation

14.3 Landscape disruption

Overview on factors of disruption

14.4 Industry risks

Impact of key risks on business

15. Competitive Analysis

15.1 Companies profiled

Companies covered

15.2 Company ranking index

15.3 Market positioning of companies

Matrix on companies position and classification

15.4 ABB Ltd.

ABB Ltd. - Overview
ABB Ltd. - Business segments
ABB Ltd. - Key news
ABB Ltd. - Key offerings
ABB Ltd. - Segment focus
SWOT

15.5 Balluff GmbH

Balluff GmbH - Overview
Balluff GmbH - Product / Service
Balluff GmbH - Key offerings
SWOT

15.6 Banner Engineering Corp.

Banner Engineering Corp. - Overview
Banner Engineering Corp. - Product / Service
Banner Engineering Corp. - Key offerings
SWOT

15.7 Basler AG

Basler AG - Overview
Basler AG - Product / Service
Basler AG - Key offerings
SWOT

15.8 Baumer Holding AG

Baumer Holding AG - Overview
Baumer Holding AG - Product / Service
Baumer Holding AG - Key offerings
SWOT

15.9 Cognex Corp.

Cognex Corp. - Overview
Cognex Corp. - Product / Service
Cognex Corp. - Key offerings
SWOT

15.10 Creaform Inc.

Creaform Inc. - Overview
Creaform Inc. - Product / Service
Creaform Inc. - Key offerings
SWOT

15.11 FANUC Corp.

FANUC Corp. - Overview
FANUC Corp. - Business segments
FANUC Corp. - Key offerings
FANUC Corp. - Segment focus
SWOT

15.12 FARO Technologies Inc.

FARO Technologies Inc. - Overview
FARO Technologies Inc. - Product / Service
FARO Technologies Inc. - Key offerings
SWOT

15.13 Hexagon AB

Hexagon AB - Overview
Hexagon AB - Business segments
Hexagon AB - Key news
Hexagon AB - Key offerings
Hexagon AB - Segment focus
SWOT

15.14 Keyence Corp.

Keyence Corp. - Overview
Keyence Corp. - Product / Service
Keyence Corp. - Key offerings
SWOT

15.15 Nikon Corp.

Nikon Corp. - Overview
Nikon Corp. - Business segments
Nikon Corp. - Key offerings
Nikon Corp. - Segment focus
SWOT

15.16 OMRON Corp.

OMRON Corp. - Overview
OMRON Corp. - Business segments
OMRON Corp. - Key offerings
OMRON Corp. - Segment focus
SWOT

15.17 Renishaw Plc

Renishaw Plc - Overview
Renishaw Plc - Business segments
Renishaw Plc - Key offerings
Renishaw Plc - Segment focus
SWOT

15.18 Teledyne Technologies Inc.

Teledyne Technologies Inc. - Overview
Teledyne Technologies Inc. - Business segments
Teledyne Technologies Inc. - Key offerings
Teledyne Technologies Inc. - Segment focus
SWOT

16. Appendix

16.1 Scope of the report

Market definition
Objectives
Notes and caveats

16.2 Inclusions and exclusions checklist

Inclusions checklist
Exclusions checklist

16.3 Currency conversion rates for US$

16.4 Research methodology

16.5 Data procurement

Information sources

16.6 Data validation

16.7 Validation techniques employed for market sizing

16.8 Data synthesis

16.9 360 degree market analysis

16.10 List of abbreviations

Research Methodology

Technavio presents a detailed picture of the market by way of study, synthesis, and summation of data from multiple sources. The analysts have presented the various facets of the market with a particular focus on identifying the key industry influencers. The data thus presented is comprehensive, reliable, and the result of extensive research, both primary and secondary.

INFORMATION SOURCES

Primary sources

  • Manufacturers and suppliers
  • Channel partners
  • Industry experts
  • Strategic decision makers

Secondary sources

  • Industry journals and periodicals
  • Government data
  • Financial reports of key industry players
  • Historical data
  • Press releases

DATA ANALYSIS

Data Synthesis

  • Collation of data
  • Estimation of key figures
  • Analysis of derived insights

Data Validation

  • Triangulation with data models
  • Reference against proprietary databases
  • Corroboration with industry experts

REPORT WRITING

Qualitative

  • Market drivers
  • Market challenges
  • Market trends
  • Five forces analysis

Quantitative

  • Market size and forecast
  • Market segmentation
  • Geographical insights
  • Competitive landscape

Interested in this report?

Get your sample now to see our research methodology and insights!

Download Now

Frequently Asked Questions

Automated Industrial Quality Control (Qc) market growth will increase by USD 312.4 million during 2026-2030.

The Automated Industrial Quality Control (Qc) market is expected to grow at a CAGR of 6.2% during 2026-2030.

Automated Industrial Quality Control (Qc) market is segmented by End-user (Automotive industry, Metal industry, Electronics industry, Others) Solution (Hardware and software, Service) Technology (Machine vision, Automated optical inspection, Coordinate measuring machine, X-ray inspection, Others)

ABB Ltd., Balluff GmbH, Banner Engineering Corp., Basler AG, Baumer Holding AG, Carl Zeiss AG, Cognex Corp., Creaform Inc., FANUC Corp., FARO Technologies Inc., Hexagon AB, ISRA VISION GmbH, Keyence Corp., Nikon Corp., OMRON Corp., Renishaw Plc, SICK AG, Teledyne Technologies Inc., Universal Robots AS, Yaskawa Electric Corp. are a few of the key vendors in the Automated Industrial Quality Control (Qc) market.

Europe will register the highest growth rate of 35.4% among the other regions. Therefore, the Automated Industrial Quality Control (Qc) market in Europe is expected to garner significant business opportunities for the vendors during the forecast period.

Germany, UK, France, Italy, Spain, The Netherlands, US, Canada, Mexico, China, Japan, India, South Korea, Australia, Indonesia, Brazil, Argentina, Chile, Saudi Arabia, UAE, South Africa, Israel, Turkey

  • Increasing demand for high-quality products and stringent regulatory standards is the driving factor this market.

The Automated Industrial Quality Control (Qc) market vendors should focus on grabbing business opportunities from the End-user segment as it accounted for the largest market share in the base year.
RIA - Research AI Assistant
Ask RIA