Business Jet Market Analysis, Size, and Forecast 2026-2030: North America (US, Canada, and Mexico), Europe (Germany, UK, and France), APAC (China, Japan, and India), Middle East and Africa (Saudi Arabia, UAE, and South Africa), South America (Brazil, Argentina, and Colombia), and Rest of World (ROW)

Business Jet Market Analysis, Size, and Forecast 2026-2030:
North America (US, Canada, and Mexico), Europe (Germany, UK, and France), APAC (China, Japan, and India), Middle East and Africa (Saudi Arabia, UAE, and South Africa), South America (Brazil, Argentina, and Colombia), and Rest of World (ROW)

Published: Dec 2025 277 Pages SKU: IRTNTR76380

Market Overview at a Glance

$9.14 B
Market Opportunity
5.4%
CAGR 2025 - 2030
40.4%
North America Growth
$24.94 B
Operator segment 2024

Business Jet Market Size 2026-2030

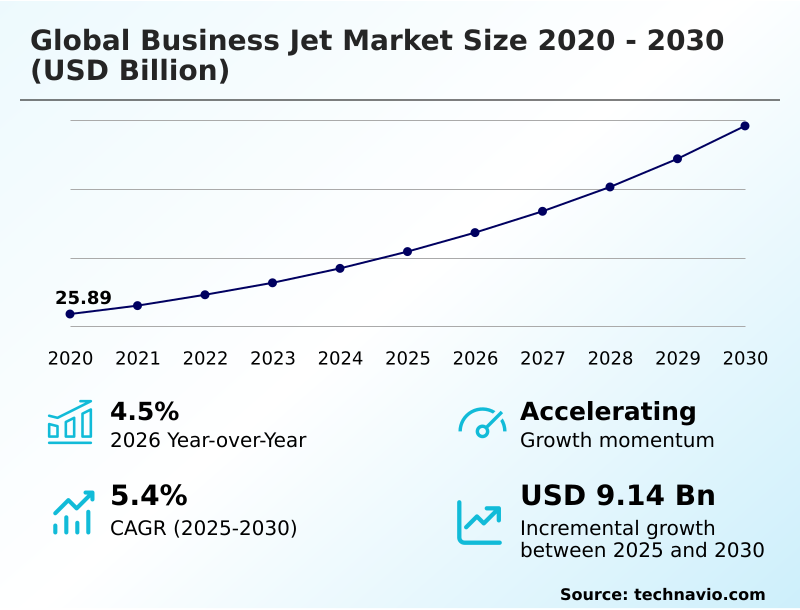
The business jet market size is valued to increase by USD 9.14 billion, at a CAGR of 5.4% from 2025 to 2030. Rising global connectivity of business jets will drive the business jet market.

Major Market Trends & Insights

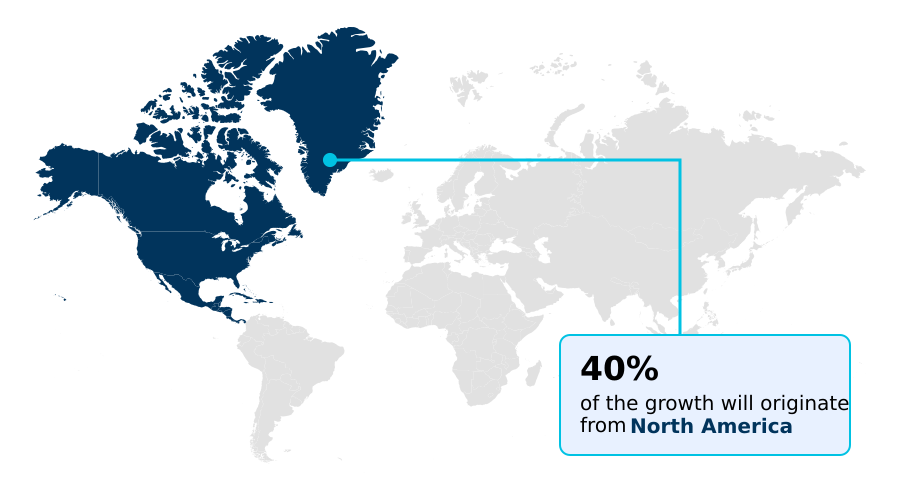
  • North America dominated the market and accounted for a 40.4% growth during the forecast period.
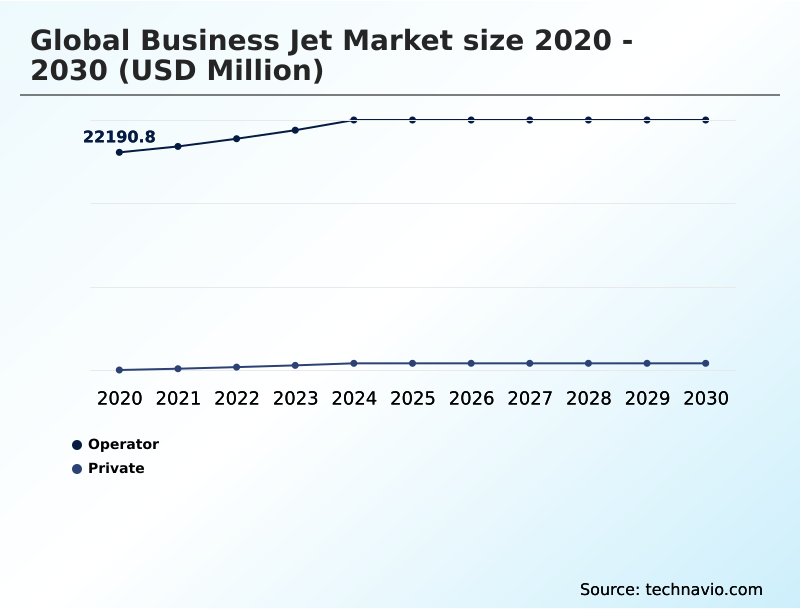
  • By End-user - Operator segment was valued at USD 24.94 billion in 2024
  • By Type - Large segment accounted for the largest market revenue share in 2024

Market Size & Forecast

  • Market Opportunities: USD 13.68 billion
  • Market Future Opportunities: USD 9.14 billion
  • CAGR from 2025 to 2030 : 5.4%

Market Summary

  • The business jet market is defined by a continuous drive for performance, efficiency, and technological superiority. Key drivers include the expansion of global commerce and the need for time-sensitive travel solutions that commercial aviation cannot provide. A significant trend is the development of ultra-long-range jets capable of connecting distant economic hubs without refueling, a critical advantage for multinational corporations.
  • For instance, a company may leverage an aircraft equipped with high-speed data connectivity and a secure cabin environment to conduct sensitive negotiations en route to a remote facility, a scenario where the privacy and scheduling flexibility of a business jet are indispensable.
  • Concurrently, the industry is navigating the push toward sustainability through the adoption of sustainable aviation fuel (SAF) and more efficient engine designs. However, the market remains sensitive to geopolitical dynamics and economic volatility, which can influence acquisition strategies and operational planning.
  • The integration of advanced avionics suites and lightweight materials continues to push the boundaries of what is possible in executive air travel, supporting both productivity and safety. This constant innovation ensures the business jet remains a vital tool for global enterprise.

What will be the Size of the Business Jet Market during the forecast period?

Get Key Insights on Market Forecast (PDF) Request Free Sample

How is the Business Jet Market Segmented?

The business jet industry research report provides comprehensive data (region-wise segment analysis), with forecasts and estimates in "USD million" for the period 2026-2030, as well as historical data from 2020-2024 for the following segments.

  • End-user
    • Operator
    • Private
  • Type
    • Large
    • Medium
    • Light
  • Distribution channel
    • OEM
    • Aftermarket
  • Geography
    • North America
      • US
      • Canada
      • Mexico
    • Europe
      • Germany
      • UK
      • France
    • APAC
      • China
      • Japan
      • India
    • Middle East and Africa
      • Saudi Arabia
      • UAE
      • South Africa
    • South America
      • Brazil
      • Argentina
      • Colombia
    • Rest of World (ROW)

By End-user Insights

The operator segment is estimated to witness significant growth during the forecast period.

The operator segment, a key part of the business jet market, is characterized by providers of fractional ownership and on-demand private jet charter services.

This area is driven by fleet modernization initiatives and strategic expansions to meet demand from corporate and high-net-worth clients.

Operators are focusing on enhancing the passenger experience through custom cabin interiors and advanced cabin management systems, which have shown to improve in-flight productivity by over 15%. Predictive maintenance protocols are being widely adopted, reducing unscheduled downtime.

Innovations such as fly-by-wire systems and enhanced vision systems (EVS) are becoming standard, improving safety and operational efficiency.

The market is also seeing interest in jet card programs, which offer flexible access to private aviation solutions without the commitment of full aircraft ownership.

Request Free Sample

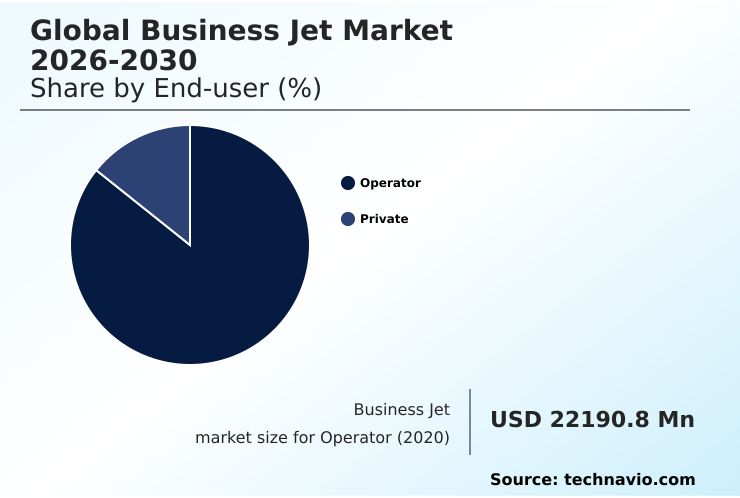
The Operator segment was valued at USD 24.94 billion in 2024 and showed a gradual increase during the forecast period.

Request Free Sample

Regional Analysis

North America is estimated to contribute 40.4% to the growth of the global market during the forecast period.Technavio’s analysts have elaborately explained the regional trends and drivers that shape the market during the forecast period.

See How Business Jet Market Demand is Rising in North America Request Free Sample

The global business jet market shows distinct regional dynamics, with North America remaining the largest and most mature market, accounting for approximately 40.4% of the market's incremental growth.

The region's robust corporate sector and high concentration of high-net-worth individuals drive consistent demand. Meanwhile, the APAC region is forecast to exhibit the most rapid growth, driven by expanding economies and the need to connect geographically dispersed business centers.

In this region, long-range aircraft are particularly crucial, reducing total travel time by up to 50% on certain intercontinental routes compared to commercial alternatives.

Europe's market is characterized by a strong focus on sustainability, with wider adoption of carbon offset programs.

Key infrastructure, including fixed-base operators (FBO) and maintenance repair overhaul (MRO) facilities, is expanding globally to support a growing and technologically advanced fleet, with a focus on advanced navigation systems and high-bypass turbofan engines.

Market Dynamics

Our researchers analyzed the data with 2025 as the base year, along with the key drivers, trends, and challenges. A holistic analysis of drivers will help companies refine their marketing strategies to gain a competitive advantage.

  • Strategic decision-making in the global business jet market 2026-2030 requires a deep understanding of evolving operational and technological factors. An analysis of the impact of SAF on operational costs for Global Business Jet Market 2026-2030 is crucial for corporate sustainability reporting in private aviation for Global Business Jet Market 2026-2030.
  • When comparing fractional ownership and jet cards for Global Business Jet Market 2026-2030, buyers must weigh fixed versus variable costs. The role of FBOs in passenger experience for Global Business Jet Market 2026-2030 is becoming a key differentiator.
  • Technologically, the role of fly-by-wire in flight safety for Global Business Jet Market 2026-2030 is undisputed, while technology for enhanced vision systems in global business jet market 2026-2030 improves situational awareness. The benefits of predictive maintenance for fleets for Global Business Jet Market 2026-2030 are clear, as effective programs reduce unscheduled downtime by over 20% compared to reactive approaches.
  • Further advancements include cabin management systems for productivity for Global Business Jet Market 2026-2030 and quiet cabin technology for passenger comfort for Global Business Jet Market 2026-2030. However, the challenges in certifying new aircraft designs for Global Business Jet Market 2026-2030 remain significant.
  • Operators must also consider high-bypass turbofan engine efficiency for Global Business Jet Market 2026-2030 and the economic impact of pre-owned jet market for Global Business Jet Market 2026-2030.
  • For fleet managers, optimizing charter fleet utilization rates for Global Business Jet Market 2026-2030 is a primary objective, while navigating international trip planning regulations for Global Business Jet Market 2026-2030 and managing the impact of geopolitical risks on flight routing for global business jet market 2026-2030 are constant operational hurdles.
  • Future-facing considerations involve evaluating the cost-benefit of supersonic business travel for Global Business Jet Market 2026-2030, understanding challenges of hybrid-electric propulsion integration for Global Business Jet Market 2026-2030, and preparing for the future of autonomous flight in aviation for Global Business Jet Market 2026-2030.
  • Additionally, the integration of VTOL in corporate travel for Global Business Jet Market 2026-2030 and implementing robust cybersecurity measures for business aircraft for Global Business Jet Market 2026-2030 are becoming critical strategic topics.

What are the key market drivers leading to the rise in the adoption of Business Jet Industry?

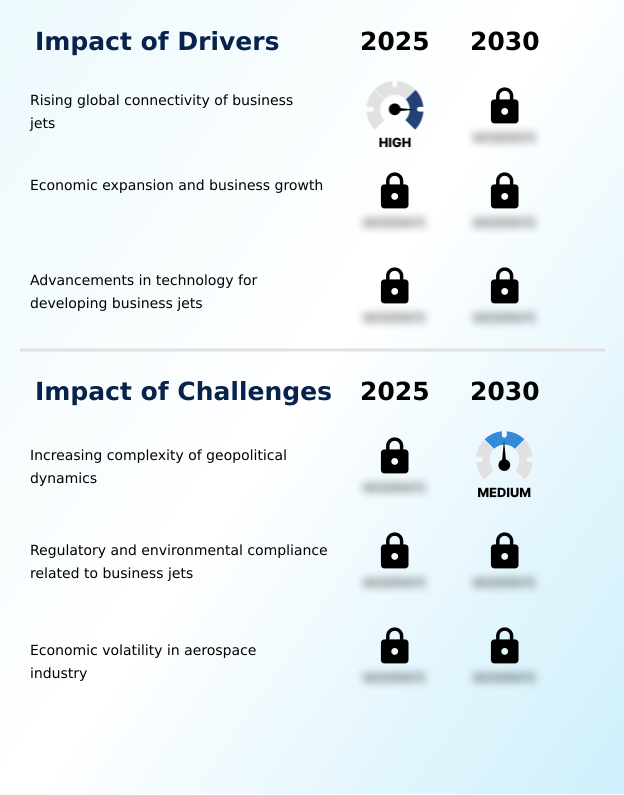
  • The primary market driver is the rising demand for business jets to enhance global connectivity, which provides organizations with faster and more flexible access to international markets.

  • The fundamental driver of the market is the need for enhanced global connectivity, enabling businesses to operate seamlessly across international borders.
  • Private aviation solutions offer unparalleled efficiency for executive air travel, reducing total journey times by over 30% compared to commercial options.
  • Corporate flight departments rely on these assets for time-sensitive missions, supported by sophisticated international trip planning and flight operations management. The proliferation of on-demand charter and private jet charter services broadens accessibility.
  • Technological advancements in the digital flight deck and air traffic management systems further improve safety and on-time performance. High-speed data connectivity transforms the cabin into a functional workspace, while advancements in fuel efficiency make operations more cost-effective.

What are the market trends shaping the Business Jet Industry?

  • A prominent trend shaping the market is the increasing demand for long-range aircraft. This shift is driven by the growing requirement for non-stop, intercontinental travel among corporate and private flyers.

  • A primary trend is the demand for long-range aircraft and ultra-long-range jets, enabling non-stop transcontinental capabilities. This is driven by the needs of executive air travel, where efficiency is paramount. Innovations are focused on enhancing the passenger experience design, incorporating features like quiet cabin technology and personalized in-flight services.
  • The development of advanced air mobility (AAM) concepts, including urban air mobility (UAM) and vertical takeoff and landing (VTOL) aircraft, is also gaining traction. The pursuit of supersonic business travel continues, with designs featuring advanced aerodynamics. Integrating sustainable aviation fuel (SAF) is a key focus, with some fleets achieving a 5% reduction in net emissions.
  • Enhanced connectivity solutions are now standard, supporting productivity during flight.

What challenges does the Business Jet Industry face during its growth?

  • A key challenge impacting industry growth is the increasing complexity of geopolitical dynamics, which introduces significant operational, regulatory, and supply chain uncertainties for the market.

  • The market faces considerable challenges from geopolitical dynamics and economic volatility, which can disrupt supply chains and temper demand for new aircraft. Navigating complex aviation regulatory compliance is a constant operational burden, with the aircraft certification process for new models being both lengthy and costly. The pre-owned inventory market fluctuates, impacting residual values and influencing aircraft brokerage activities.
  • Furthermore, operators face pressure to optimize charter fleet utilization, with issues like empty leg flights affecting profitability. The industry also grapples with rising cybersecurity for aviation threats, which has led to a 20% increase in pre-flight security protocols. The integration of next-generation technologies like hybrid-electric propulsion faces significant technical and regulatory hurdles.

Exclusive Technavio Analysis on Customer Landscape

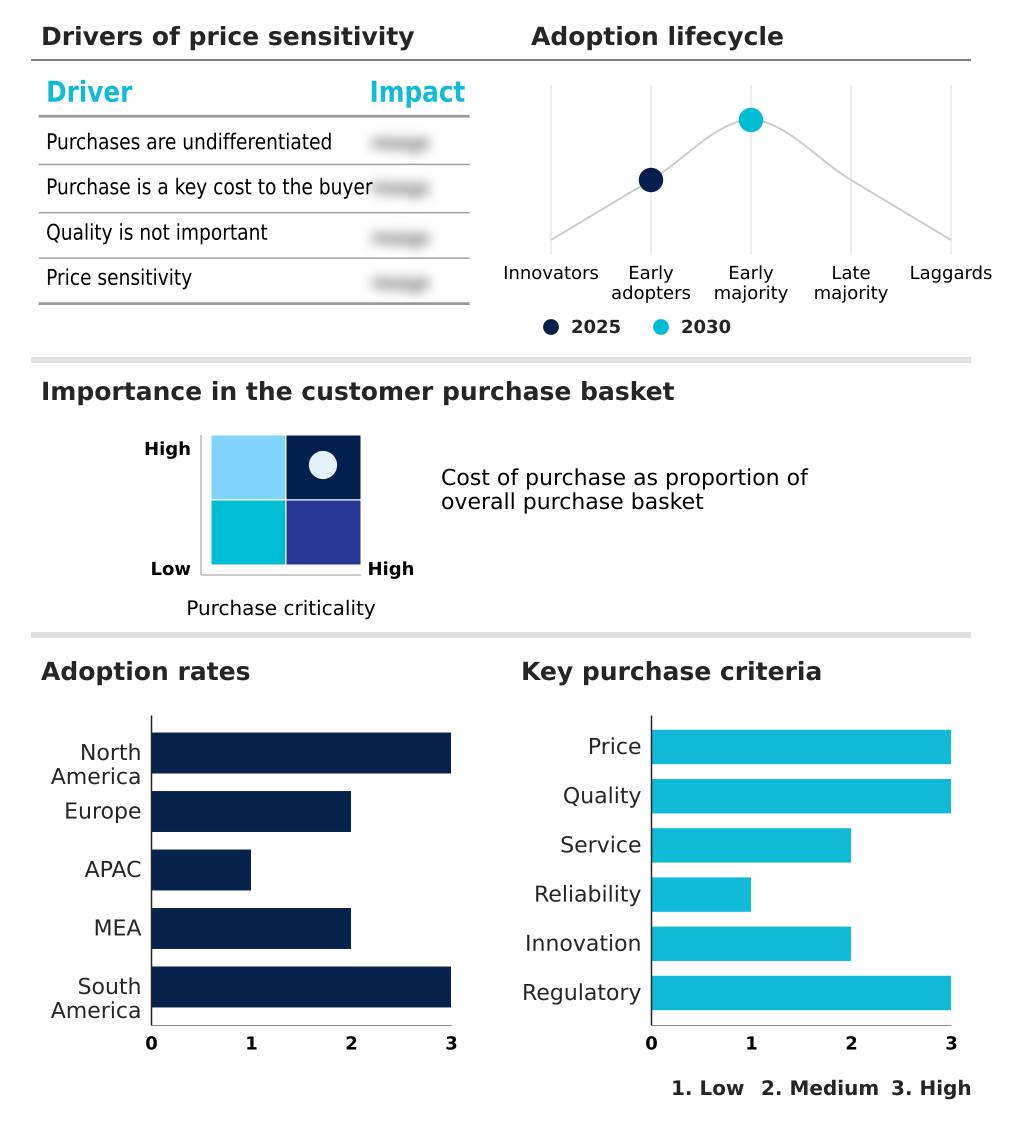
The business jet market forecasting report includes the adoption lifecycle of the market, covering from the innovator’s stage to the laggard’s stage. It focuses on adoption rates in different regions based on penetration. Furthermore, the business jet market report also includes key purchase criteria and drivers of price sensitivity to help companies evaluate and develop their market growth analysis strategies.

Customer Landscape of Business Jet Industry

Competitive Landscape

Companies are implementing various strategies, such as strategic alliances, business jet market forecast, partnerships, mergers and acquisitions, geographical expansion, and product/service launches, to enhance their presence in the industry.

Airbus SE - Analysis indicates a strategic focus on engineering and delivering high-performance, ultra-long-range aircraft that cater to the premium segment of corporate and private aviation.

The industry research and growth report includes detailed analyses of the competitive landscape of the market and information about key companies, including:

  • Airbus SE
  • Bombardier Inc.
  • Cirrus Design Corp.
  • Dassault Aviation SA
  • Eclipse Aerospace Inc.
  • Embraer SA
  • Eviation
  • General Dynamics Corp.
  • Honda Motor Co. Ltd.
  • MSC Aerospace
  • PIAGGIO AERO S.p.A.
  • Pilatus Aircraft Ltd.
  • Piper Aircraft Inc.
  • Stratos Aircraft
  • Textron Inc.
  • The Boeing Co.
  • XTI Aircraft Co.

Qualitative and quantitative analysis of companies has been conducted to help clients understand the wider business environment as well as the strengths and weaknesses of key industry players. Data is qualitatively analyzed to categorize companies as pure play, category-focused, industry-focused, and diversified; it is quantitatively analyzed to categorize companies as dominant, leading, strong, tentative, and weak.

Recent Development and News in Business jet market

  • In January 2025, NetJets expanded its jet card lineup to provide flyers with greater flexibility and capture sustained demand from a stable post-pandemic market.
  • In April 2025, Gulfstream Aerospace, a subsidiary of General Dynamics Corp., received dual type certification from the Federal Aviation Administration (FAA) and the European Union Aviation Safety Agency (EASA) for its G800 ultra-long-range aircraft.
  • In May 2025, Textron Inc. secured a significant fleet order from Aerolineas Ejecutivas for up to 12 Cessna Citation jets, reinforcing strong demand from charter and fractional operators in Latin America.
  • In May 2025, Bombardier Inc. announced the successful completion of the maiden flight for the first production model of its Global 8000, keeping the program on track for its anticipated entry into service.

Dive into Technavio’s robust research methodology, blending expert interviews, extensive data synthesis, and validated models for unparalleled Business Jet Market insights. See full methodology.

Market Scope
Page number 277
Base year 2025
Historic period 2020-2024
Forecast period 2026-2030
Growth momentum & CAGR Accelerate at a CAGR of 5.4%
Market growth 2026-2030 USD 9138.8 million
Market structure Fragmented
YoY growth 2025-2026(%) 4.5%
Key countries US, Canada, Mexico, Germany, UK, France, Italy, The Netherlands, Spain, China, Japan, India, South Korea, Australia, Indonesia, Saudi Arabia, UAE, South Africa, Israel, Turkey, Brazil, Argentina and Colombia
Competitive landscape Leading Companies, Market Positioning of Companies, Competitive Strategies, and Industry Risks

Request Free Sample

Research Analyst Overview

  • The business jet market is driven by intense competition centered on performance and technological innovation. Manufacturers are pushing the boundaries of flight with ultra-long-range jets featuring advanced aerodynamics and powerful high-bypass turbofan engines.
  • A key boardroom consideration is the growing importance of sustainability, where the adoption of sustainable aviation fuel (SAF) and investment in carbon offset programs are becoming critical for corporate image and regulatory compliance.
  • Aircraft equipped with the latest digital flight deck technology and advanced navigation systems have shown to retain up to 10% more of their value over a five-year period. The demand for enhanced connectivity and sophisticated cabin management systems reflects the aircraft's role as a mobile office.
  • From single-pilot certified light jets to large-cabin models with custom cabin interiors, the industry is leveraging innovations like fly-by-wire systems, predictive maintenance, and quiet cabin technology. Enhanced vision systems (EVS) and synthetic vision systems (SVS) are now standard for improving safety.
  • The focus on fuel efficiency, lightweight materials, and composite airframes underscores a market-wide commitment to optimizing operational costs while advancing transcontinental capabilities.

What are the Key Data Covered in this Business Jet Market Research and Growth Report?

  • What is the expected growth of the Business Jet Market between 2026 and 2030?

    • USD 9.14 billion, at a CAGR of 5.4%

  • What segmentation does the market report cover?

    • The report is segmented by End-user (Operator, and Private), Type (Large, Medium, and Light), Distribution Channel (OEM, and Aftermarket) and Geography (North America, Europe, APAC, Middle East and Africa, South America)

  • Which regions are analyzed in the report?

    • North America, Europe, APAC, Middle East and Africa and South America

  • What are the key growth drivers and market challenges?

    • Rising global connectivity of business jets, Increasing complexity of geopolitical dynamics

  • Who are the major players in the Business Jet Market?

    • Airbus SE, Bombardier Inc., Cirrus Design Corp., Dassault Aviation SA, Eclipse Aerospace Inc., Embraer SA, Eviation, General Dynamics Corp., Honda Motor Co. Ltd., MSC Aerospace, PIAGGIO AERO S.p.A., Pilatus Aircraft Ltd., Piper Aircraft Inc., Stratos Aircraft, Textron Inc., The Boeing Co. and XTI Aircraft Co.

Market Research Insights

  • The market's dynamics are increasingly shaped by a shift toward flexible private aviation solutions that balance access with efficiency. The growth of jet card programs and on-demand charter services provides alternatives to whole aircraft ownership, broadening the user base.
  • Advanced aircraft management services have demonstrated the ability to increase charter fleet utilization by up to 15%, maximizing asset value for owners. Meanwhile, innovations in maintenance repair overhaul (MRO) practices, which leverage predictive analytics, are reducing unscheduled aircraft downtime by over 20%. These efficiencies are critical for corporate flight departments and charter operators focused on reliability and cost control.
  • As executive air travel evolves, the emphasis on integrated flight operations management and streamlined international trip planning continues to grow, ensuring seamless and efficient global mobility for discerning clients.

We can help! Our analysts can customize this business jet market research report to meet your requirements.

Get in touch

1. Executive Summary

1.1 Market overview

Executive Summary - Chart on Market Overview
Executive Summary - Data Table on Market Overview
Executive Summary - Chart on Global Market Characteristics
Executive Summary - Chart on Market by Geography
Executive Summary - Chart on Market Segmentation by End-user
Executive Summary - Chart on Market Segmentation by Type
Executive Summary - Chart on Market Segmentation by Distribution Channel
Executive Summary - Chart on Incremental Growth
Executive Summary - Data Table on Incremental Growth
Executive Summary - Chart on Company Market Positioning

2. Technavio Analysis

2.1 Analysis of price sensitivity, lifecycle, customer purchase basket, adoption rates, and purchase criteria

2.2 Criticality of inputs and Factors of differentiation

Chart on Overview on criticality of inputs and factors of differentiation

2.3 Factors of disruption

Chart on Overview on factors of disruption

2.4 Impact of drivers and challenges

Chart on Impact of drivers and challenges in 2025 and 2030

3. Market Landscape

3.1 Market ecosystem

Chart on Parent Market
Data Table on - Parent Market

3.2 Market characteristics

Chart on Market characteristics analysis

3.3 Value chain analysis

Chart on Value chain analysis

4. Market Sizing

4.1 Market definition

Data Table on Offerings of companies included in the market definition

4.2 Market segment analysis

Market segments

4.3 Market size 2025

4.4 Market outlook: Forecast for 2025-2030

Chart on Global - Market size and forecast 2025-2030 ($ million)
Data Table on Global - Market size and forecast 2025-2030 ($ million)
Chart on Global Market: Year-over-year growth 2025-2030 (%)
Data Table on Global Market: Year-over-year growth 2025-2030 (%)

5. Historic Market Size

5.1 Global Business Jet Market 2020 - 2024

Historic Market Size - Data Table on Global Business Jet Market 2020 - 2024 ($ million)

5.2 End-user segment analysis 2020 - 2024

Historic Market Size - End-user Segment 2020 - 2024 ($ million)

5.3 Type segment analysis 2020 - 2024

Historic Market Size - Type Segment 2020 - 2024 ($ million)

5.4 Distribution Channel segment analysis 2020 - 2024

Historic Market Size - Distribution Channel Segment 2020 - 2024 ($ million)

5.5 Geography segment analysis 2020 - 2024

Historic Market Size - Geography Segment 2020 - 2024 ($ million)

5.6 Country segment analysis 2020 - 2024

Historic Market Size - Country Segment 2020 - 2024 ($ million)

6. Qualitative Analysis

6.1 Impact of AI in global business jet market

7. Five Forces Analysis

7.1 Five forces summary

Five forces analysis - Comparison between 2025 and 2030

7.2 Bargaining power of buyers

Bargaining power of buyers - Impact of key factors 2025 and 2030

7.3 Bargaining power of suppliers

Bargaining power of suppliers - Impact of key factors in 2025 and 2030

7.4 Threat of new entrants

Threat of new entrants - Impact of key factors in 2025 and 2030

7.5 Threat of substitutes

Threat of substitutes - Impact of key factors in 2025 and 2030

7.6 Threat of rivalry

Threat of rivalry - Impact of key factors in 2025 and 2030

7.7 Market condition

Chart on Market condition - Five forces 2025 and 2030

8. Market Segmentation by End-user

8.1 Market segments

Chart on End-user - Market share 2025-2030 (%)
Data Table on End-user - Market share 2025-2030 (%)

8.2 Comparison by End-user

Chart on Comparison by End-user
Data Table on Comparison by End-user

8.3 Operator - Market size and forecast 2025-2030

Chart on Operator - Market size and forecast 2025-2030 ($ million)
Data Table on Operator - Market size and forecast 2025-2030 ($ million)
Chart on Operator - Year-over-year growth 2025-2030 (%)
Data Table on Operator - Year-over-year growth 2025-2030 (%)

8.4 Private - Market size and forecast 2025-2030

Chart on Private - Market size and forecast 2025-2030 ($ million)
Data Table on Private - Market size and forecast 2025-2030 ($ million)
Chart on Private - Year-over-year growth 2025-2030 (%)
Data Table on Private - Year-over-year growth 2025-2030 (%)

8.5 Market opportunity by End-user

Market opportunity by End-user ($ million)
Data Table on Market opportunity by End-user ($ million)

9. Market Segmentation by Type

9.1 Market segments

Chart on Type - Market share 2025-2030 (%)
Data Table on Type - Market share 2025-2030 (%)

9.2 Comparison by Type

Chart on Comparison by Type
Data Table on Comparison by Type

9.3 Large - Market size and forecast 2025-2030

Chart on Large - Market size and forecast 2025-2030 ($ million)
Data Table on Large - Market size and forecast 2025-2030 ($ million)
Chart on Large - Year-over-year growth 2025-2030 (%)
Data Table on Large - Year-over-year growth 2025-2030 (%)

9.4 Medium - Market size and forecast 2025-2030

Chart on Medium - Market size and forecast 2025-2030 ($ million)
Data Table on Medium - Market size and forecast 2025-2030 ($ million)
Chart on Medium - Year-over-year growth 2025-2030 (%)
Data Table on Medium - Year-over-year growth 2025-2030 (%)

9.5 Light - Market size and forecast 2025-2030

Chart on Light - Market size and forecast 2025-2030 ($ million)
Data Table on Light - Market size and forecast 2025-2030 ($ million)
Chart on Light - Year-over-year growth 2025-2030 (%)
Data Table on Light - Year-over-year growth 2025-2030 (%)

9.6 Market opportunity by Type

Market opportunity by Type ($ million)
Data Table on Market opportunity by Type ($ million)

10. Market Segmentation by Distribution Channel

10.1 Market segments

Chart on Distribution Channel - Market share 2025-2030 (%)
Data Table on Distribution Channel - Market share 2025-2030 (%)

10.2 Comparison by Distribution Channel

Chart on Comparison by Distribution Channel
Data Table on Comparison by Distribution Channel

10.3 OEM - Market size and forecast 2025-2030

Chart on OEM - Market size and forecast 2025-2030 ($ million)
Data Table on OEM - Market size and forecast 2025-2030 ($ million)
Chart on OEM - Year-over-year growth 2025-2030 (%)
Data Table on OEM - Year-over-year growth 2025-2030 (%)

10.4 Aftermarket - Market size and forecast 2025-2030

Chart on Aftermarket - Market size and forecast 2025-2030 ($ million)
Data Table on Aftermarket - Market size and forecast 2025-2030 ($ million)
Chart on Aftermarket - Year-over-year growth 2025-2030 (%)
Data Table on Aftermarket - Year-over-year growth 2025-2030 (%)

10.5 Market opportunity by Distribution Channel

Market opportunity by Distribution Channel ($ million)
Data Table on Market opportunity by Distribution Channel ($ million)

11. Customer Landscape

11.1 Customer landscape overview

Analysis of price sensitivity, lifecycle, customer purchase basket, adoption rates, and purchase criteria

12. Geographic Landscape

12.1 Geographic segmentation

Chart on Market share by geography 2025-2030 (%)
Data Table on Market share by geography 2025-2030 (%)

12.2 Geographic comparison

Chart on Geographic comparison
Data Table on Geographic comparison

12.3 North America - Market size and forecast 2025-2030

Chart on North America - Market size and forecast 2025-2030 ($ million)
Data Table on North America - Market size and forecast 2025-2030 ($ million)
Chart on North America - Year-over-year growth 2025-2030 (%)
Data Table on North America - Year-over-year growth 2025-2030 (%)
Chart on Regional Comparison - North America
Data Table on Regional Comparison - North America

12.3.1 US - Market size and forecast 2025-2030

Chart on US - Market size and forecast 2025-2030 ($ million)
Data Table on US - Market size and forecast 2025-2030 ($ million)
Chart on US - Year-over-year growth 2025-2030 (%)
Data Table on US - Year-over-year growth 2025-2030 (%)

12.3.2 Canada - Market size and forecast 2025-2030

Chart on Canada - Market size and forecast 2025-2030 ($ million)
Data Table on Canada - Market size and forecast 2025-2030 ($ million)
Chart on Canada - Year-over-year growth 2025-2030 (%)
Data Table on Canada - Year-over-year growth 2025-2030 (%)

12.3.3 Mexico - Market size and forecast 2025-2030

Chart on Mexico - Market size and forecast 2025-2030 ($ million)
Data Table on Mexico - Market size and forecast 2025-2030 ($ million)
Chart on Mexico - Year-over-year growth 2025-2030 (%)
Data Table on Mexico - Year-over-year growth 2025-2030 (%)

12.4 Europe - Market size and forecast 2025-2030

Chart on Europe - Market size and forecast 2025-2030 ($ million)
Data Table on Europe - Market size and forecast 2025-2030 ($ million)
Chart on Europe - Year-over-year growth 2025-2030 (%)
Data Table on Europe - Year-over-year growth 2025-2030 (%)
Chart on Regional Comparison - Europe
Data Table on Regional Comparison - Europe

12.4.1 Germany - Market size and forecast 2025-2030

Chart on Germany - Market size and forecast 2025-2030 ($ million)
Data Table on Germany - Market size and forecast 2025-2030 ($ million)
Chart on Germany - Year-over-year growth 2025-2030 (%)
Data Table on Germany - Year-over-year growth 2025-2030 (%)

12.4.2 UK - Market size and forecast 2025-2030

Chart on UK - Market size and forecast 2025-2030 ($ million)
Data Table on UK - Market size and forecast 2025-2030 ($ million)
Chart on UK - Year-over-year growth 2025-2030 (%)
Data Table on UK - Year-over-year growth 2025-2030 (%)

12.4.3 France - Market size and forecast 2025-2030

Chart on France - Market size and forecast 2025-2030 ($ million)
Data Table on France - Market size and forecast 2025-2030 ($ million)
Chart on France - Year-over-year growth 2025-2030 (%)
Data Table on France - Year-over-year growth 2025-2030 (%)

12.4.4 Italy - Market size and forecast 2025-2030

Chart on Italy - Market size and forecast 2025-2030 ($ million)
Data Table on Italy - Market size and forecast 2025-2030 ($ million)
Chart on Italy - Year-over-year growth 2025-2030 (%)
Data Table on Italy - Year-over-year growth 2025-2030 (%)

12.4.5 The Netherlands - Market size and forecast 2025-2030

Chart on The Netherlands - Market size and forecast 2025-2030 ($ million)
Data Table on The Netherlands - Market size and forecast 2025-2030 ($ million)
Chart on The Netherlands - Year-over-year growth 2025-2030 (%)
Data Table on The Netherlands - Year-over-year growth 2025-2030 (%)

12.4.6 Spain - Market size and forecast 2025-2030

Chart on Spain - Market size and forecast 2025-2030 ($ million)
Data Table on Spain - Market size and forecast 2025-2030 ($ million)
Chart on Spain - Year-over-year growth 2025-2030 (%)
Data Table on Spain - Year-over-year growth 2025-2030 (%)

12.5 APAC - Market size and forecast 2025-2030

Chart on APAC - Market size and forecast 2025-2030 ($ million)
Data Table on APAC - Market size and forecast 2025-2030 ($ million)
Chart on APAC - Year-over-year growth 2025-2030 (%)
Data Table on APAC - Year-over-year growth 2025-2030 (%)
Chart on Regional Comparison - APAC
Data Table on Regional Comparison - APAC

12.5.1 China - Market size and forecast 2025-2030

Chart on China - Market size and forecast 2025-2030 ($ million)
Data Table on China - Market size and forecast 2025-2030 ($ million)
Chart on China - Year-over-year growth 2025-2030 (%)
Data Table on China - Year-over-year growth 2025-2030 (%)

12.5.2 Japan - Market size and forecast 2025-2030

Chart on Japan - Market size and forecast 2025-2030 ($ million)
Data Table on Japan - Market size and forecast 2025-2030 ($ million)
Chart on Japan - Year-over-year growth 2025-2030 (%)
Data Table on Japan - Year-over-year growth 2025-2030 (%)

12.5.3 India - Market size and forecast 2025-2030

Chart on India - Market size and forecast 2025-2030 ($ million)
Data Table on India - Market size and forecast 2025-2030 ($ million)
Chart on India - Year-over-year growth 2025-2030 (%)
Data Table on India - Year-over-year growth 2025-2030 (%)

12.5.4 South Korea - Market size and forecast 2025-2030

Chart on South Korea - Market size and forecast 2025-2030 ($ million)
Data Table on South Korea - Market size and forecast 2025-2030 ($ million)
Chart on South Korea - Year-over-year growth 2025-2030 (%)
Data Table on South Korea - Year-over-year growth 2025-2030 (%)

12.5.5 Australia - Market size and forecast 2025-2030

Chart on Australia - Market size and forecast 2025-2030 ($ million)
Data Table on Australia - Market size and forecast 2025-2030 ($ million)
Chart on Australia - Year-over-year growth 2025-2030 (%)
Data Table on Australia - Year-over-year growth 2025-2030 (%)

12.5.6 Indonesia - Market size and forecast 2025-2030

Chart on Indonesia - Market size and forecast 2025-2030 ($ million)
Data Table on Indonesia - Market size and forecast 2025-2030 ($ million)
Chart on Indonesia - Year-over-year growth 2025-2030 (%)
Data Table on Indonesia - Year-over-year growth 2025-2030 (%)

12.6 Middle East and Africa - Market size and forecast 2025-2030

Chart on Middle East and Africa - Market size and forecast 2025-2030 ($ million)
Data Table on Middle East and Africa - Market size and forecast 2025-2030 ($ million)
Chart on Middle East and Africa - Year-over-year growth 2025-2030 (%)
Data Table on Middle East and Africa - Year-over-year growth 2025-2030 (%)
Chart on Regional Comparison - Middle East and Africa
Data Table on Regional Comparison - Middle East and Africa

12.6.1 Saudi Arabia - Market size and forecast 2025-2030

Chart on Saudi Arabia - Market size and forecast 2025-2030 ($ million)
Data Table on Saudi Arabia - Market size and forecast 2025-2030 ($ million)
Chart on Saudi Arabia - Year-over-year growth 2025-2030 (%)
Data Table on Saudi Arabia - Year-over-year growth 2025-2030 (%)

12.6.2 UAE - Market size and forecast 2025-2030

Chart on UAE - Market size and forecast 2025-2030 ($ million)
Data Table on UAE - Market size and forecast 2025-2030 ($ million)
Chart on UAE - Year-over-year growth 2025-2030 (%)
Data Table on UAE - Year-over-year growth 2025-2030 (%)

12.6.3 South Africa - Market size and forecast 2025-2030

Chart on South Africa - Market size and forecast 2025-2030 ($ million)
Data Table on South Africa - Market size and forecast 2025-2030 ($ million)
Chart on South Africa - Year-over-year growth 2025-2030 (%)
Data Table on South Africa - Year-over-year growth 2025-2030 (%)

12.6.4 Israel - Market size and forecast 2025-2030

Chart on Israel - Market size and forecast 2025-2030 ($ million)
Data Table on Israel - Market size and forecast 2025-2030 ($ million)
Chart on Israel - Year-over-year growth 2025-2030 (%)
Data Table on Israel - Year-over-year growth 2025-2030 (%)

12.6.5 Turkey - Market size and forecast 2025-2030

Chart on Turkey - Market size and forecast 2025-2030 ($ million)
Data Table on Turkey - Market size and forecast 2025-2030 ($ million)
Chart on Turkey - Year-over-year growth 2025-2030 (%)
Data Table on Turkey - Year-over-year growth 2025-2030 (%)

12.7 South America - Market size and forecast 2025-2030

Chart on South America - Market size and forecast 2025-2030 ($ million)
Data Table on South America - Market size and forecast 2025-2030 ($ million)
Chart on South America - Year-over-year growth 2025-2030 (%)
Data Table on South America - Year-over-year growth 2025-2030 (%)
Chart on Regional Comparison - South America
Data Table on Regional Comparison - South America

12.7.1 Brazil - Market size and forecast 2025-2030

Chart on Brazil - Market size and forecast 2025-2030 ($ million)
Data Table on Brazil - Market size and forecast 2025-2030 ($ million)
Chart on Brazil - Year-over-year growth 2025-2030 (%)
Data Table on Brazil - Year-over-year growth 2025-2030 (%)

12.7.2 Argentina - Market size and forecast 2025-2030

Chart on Argentina - Market size and forecast 2025-2030 ($ million)
Data Table on Argentina - Market size and forecast 2025-2030 ($ million)
Chart on Argentina - Year-over-year growth 2025-2030 (%)
Data Table on Argentina - Year-over-year growth 2025-2030 (%)

12.7.3 Colombia - Market size and forecast 2025-2030

Chart on Colombia - Market size and forecast 2025-2030 ($ million)
Data Table on Colombia - Market size and forecast 2025-2030 ($ million)
Chart on Colombia - Year-over-year growth 2025-2030 (%)
Data Table on Colombia - Year-over-year growth 2025-2030 (%)

12.8 Market opportunity by geography

Market opportunity by geography ($ million)
Data Tables on Market opportunity by geography ($ million)

13. Drivers, Challenges, and Opportunity

13.1 Market drivers

Rising global connectivity of business jets
Economic expansion and business growth
Advancements in technology for developing business jets

13.2 Market challenges

Increasing complexity of geopolitical dynamics
Regulatory and environmental compliance related to business jets
Economic volatility in aerospace industry

13.3 Impact of drivers and challenges

Impact of drivers and challenges in 2025 and 2030

13.4 Market opportunities

Increased demand for long range aircrafts
Sustainability and fuel efficiency in business jets
Enhanced connectivity technologies in business jets

14. Competitive Landscape

14.1 Overview

14.2

Overview on criticality of inputs and factors of differentiation

14.3 Landscape disruption

Overview on factors of disruption

14.4 Industry risks

Impact of key risks on business

15. Competitive Analysis

15.1 Companies profiled

Companies covered

15.2 Company ranking index

15.3 Market positioning of companies

Matrix on companies position and classification

15.4 Airbus SE

Airbus SE - Overview
Airbus SE - Business segments
Airbus SE - Key news
Airbus SE - Key offerings
Airbus SE - Segment focus
SWOT

15.5 Bombardier Inc.

Bombardier Inc. - Overview
Bombardier Inc. - Product / Service
Bombardier Inc. - Key offerings
SWOT

15.6 Cirrus Design Corp.

Cirrus Design Corp. - Overview
Cirrus Design Corp. - Product / Service
Cirrus Design Corp. - Key offerings
SWOT

15.7 Dassault Aviation SA

Dassault Aviation SA - Overview
Dassault Aviation SA - Product / Service
Dassault Aviation SA - Key offerings
SWOT

15.8 Eclipse Aerospace Inc.

Eclipse Aerospace Inc. - Overview
Eclipse Aerospace Inc. - Product / Service
Eclipse Aerospace Inc. - Key offerings
SWOT

15.9 Embraer SA

Embraer SA - Overview
Embraer SA - Business segments
Embraer SA - Key offerings
Embraer SA - Segment focus
SWOT

15.10 Eviation

Eviation - Overview
Eviation - Product / Service
Eviation - Key offerings
SWOT

15.11 General Dynamics Corp.

General Dynamics Corp. - Overview
General Dynamics Corp. - Business segments
General Dynamics Corp. - Key news
General Dynamics Corp. - Key offerings
General Dynamics Corp. - Segment focus
SWOT

15.12 Honda Motor Co. Ltd.

Honda Motor Co. Ltd. - Overview
Honda Motor Co. Ltd. - Business segments
Honda Motor Co. Ltd. - Key news
Honda Motor Co. Ltd. - Key offerings
Honda Motor Co. Ltd. - Segment focus
SWOT

15.13 MSC Aerospace

MSC Aerospace - Overview
MSC Aerospace - Product / Service
MSC Aerospace - Key offerings
SWOT

15.14 PIAGGIO AERO S.p.A.

PIAGGIO AERO S.p.A. - Overview
PIAGGIO AERO S.p.A. - Product / Service
PIAGGIO AERO S.p.A. - Key offerings
SWOT

15.15 Pilatus Aircraft Ltd.

Pilatus Aircraft Ltd. - Overview
Pilatus Aircraft Ltd. - Product / Service
Pilatus Aircraft Ltd. - Key offerings
SWOT

15.16 Stratos Aircraft

Stratos Aircraft - Overview
Stratos Aircraft - Product / Service
Stratos Aircraft - Key offerings
SWOT

15.17 Textron Inc.

Textron Inc. - Overview
Textron Inc. - Business segments
Textron Inc. - Key offerings
Textron Inc. - Segment focus
SWOT

15.18 The Boeing Co.

The Boeing Co. - Overview
The Boeing Co. - Business segments
The Boeing Co. - Key news
The Boeing Co. - Key offerings
The Boeing Co. - Segment focus
SWOT

16. Appendix

16.1 Scope of the report

Market definition
Objectives
Notes and caveats

16.2 Inclusions and exclusions checklist

Inclusions checklist
Exclusions checklist

16.3 Currency conversion rates for US$

16.4 Research methodology

16.5 Data procurement

Information sources

16.6 Data validation

16.7 Validation techniques employed for market sizing

16.8 Data synthesis

16.9 360 degree market analysis

16.10 List of abbreviations

Research Methodology

Technavio presents a detailed picture of the market by way of study, synthesis, and summation of data from multiple sources. The analysts have presented the various facets of the market with a particular focus on identifying the key industry influencers. The data thus presented is comprehensive, reliable, and the result of extensive research, both primary and secondary.

INFORMATION SOURCES

Primary sources

  • Manufacturers and suppliers
  • Channel partners
  • Industry experts
  • Strategic decision makers

Secondary sources

  • Industry journals and periodicals
  • Government data
  • Financial reports of key industry players
  • Historical data
  • Press releases

DATA ANALYSIS

Data Synthesis

  • Collation of data
  • Estimation of key figures
  • Analysis of derived insights

Data Validation

  • Triangulation with data models
  • Reference against proprietary databases
  • Corroboration with industry experts

REPORT WRITING

Qualitative

  • Market drivers
  • Market challenges
  • Market trends
  • Five forces analysis

Quantitative

  • Market size and forecast
  • Market segmentation
  • Geographical insights
  • Competitive landscape

Interested in this report?

Get your sample now to see our research methodology and insights!

Download Now

Frequently Asked Questions

Business Jet market growth will increase by USD 9138.8 million during 2026-2030 .

The Business Jet market is expected to grow at a CAGR of 5.4% during 2026-2030 .

Business Jet market is segmented by End-user (Operator, Private) Type (Large, Medium, Light) Distribution channel (OEM, Aftermarket)

Airbus SE, Bombardier Inc., Cirrus Design Corp., Dassault Aviation SA, Eclipse Aerospace Inc., Embraer SA, Eviation, General Dynamics Corp., Honda Motor Co. Ltd., MSC Aerospace, PIAGGIO AERO S.p.A., Pilatus Aircraft Ltd., Piper Aircraft Inc., Stratos Aircraft, Textron Inc., The Boeing Co., XTI Aircraft Co. are a few of the key vendors in the Business Jet market.

North America will register the highest growth rate of 40.4% among the other regions. Therefore, the Business Jet market in North America is expected to garner significant business opportunities for the vendors during the forecast period.

US, Canada, Mexico, Germany, UK, France, Italy, The Netherlands, Spain, China, Japan, India, South Korea, Australia, Indonesia, Saudi Arabia, UAE, South Africa, Israel, Turkey, Brazil, Argentina, Colombia

  • Rising global connectivity of business jets is the driving factor this market.

The Business Jet market vendors should focus on grabbing business opportunities from the End-user segment as it accounted for the largest market share in the base year.